Friday, March 2, 2012

AAPL Analysis-Market Analysis

Since AAPL is virtually the market, what happens there effects the entire market and what I see makes a lot of sense. For me, this is one of the most exciting finds in a while and helps answer the question of "when?"

Starting from the long time frames (the most important) and working down.

 AAPL 60 min is in a relative negative divergence, that means the amount of accumulation present now, is the same as when AAPL was lower on the 8th, even though AAPL has gained. This would suggest AAPL has been distributed (sold/sold short) into strength.

 That divergence is flowing from worse divergences in the lower timeframes like this 30 min chart which is leading negative (remember they bleed in to the longer time frames if they are strong enough), we can also see the event on the 15th which I believe is a pivotal turning point for AAPL. 3C has not been able to surpass the 15th.

AAPL 15 min leading negative divergence-we have excellent confirmation.

 This 5 min chart suggests the end game, it is leading negative, but shows a late day positive divergence (the positive divergence is in a leading negative, meaning it is not a strong positive, but there seems to be some accumulation and I believe this is what is setting up the end game for AAPL and the market).

 Look at volume and volatility, it is squeezing very tight and AAPL has a fairly clear resistance zone.

 60 min Bollinger Bands show the volatility squeeze.

And here's the end game in my opinion. I'd say 80% of the time, before we see a major reversal, we almost always see a head fake move. Being AAPL is the most watched stock in the market, a head fake move here is almost a given and would set the market up for a sharp fall as AAPL longs are very loyal, they love the stock so they'll certainly buy a breakout move.

The purpose of a head fake move is to lock in as many longs at an eventual loss as possible, when the stock moves back down and puts those longs in a losing position, they start to sell, adding supply to the market and pressuring prices lower causing the remaining longs to take even deeper losses until they sell and it creates a cycle of selling. This is why we see these moves just before a reversal, they add extra fuel to the fire. A good recent example was the head fake trade we identified in GLD days before it reversed, it should be noted though that a head fake trade can happen in days or it can happen in a day or even hours. Here' the result...

 GLD took the sharpest 1 day loss it has seen (other then moves already within a down trend like an exhaustion move at the end of a downtrend which tend to be big) since 2008.

This is the point of  head fake and this is what I think the highest probability outcome is. This would also mean that we now have probably the best timing indicator for the market break. If you are wondering, "Well what if this is just a new leg up in AAPL?" I would refer you to the 3C charts, they are not accumulating for a new leg up, they are showing heavy distribution not only in AAPL, but in all of the market average and important industry groups.


I Hope You Have Been Paying Attention to RCII

If anyone took this trade, I'd love to hear from you. My last priority is placing trades, I only do it when I have time, but still, even here I'm considering taking this trade (short).

 RCII and the bear flag break down, I think this is the 3rd reminder post on RCII today.

 Once RCII broke the bear flag it kept going, no head fake, this in itself is a change in the character of the market and suggest more urgent selling.

 The  1 min chart has been in line or confirming the move down all day

 The same for the 5 min

 The 15 min is leading price.

 So is the 30 min

And the 60 min should see the 30 min bleed through, but for now it is confirming the downtrend, if you got on board, congratulations, this looks to be a solid entry/trade

When in Doubt, go to ES

That has happened several times this week, when there have been no strong signals or contradictions, ES has been the deciding factor. About 30 mins. ago I posted the ES negative divergence in to a slightly rising market.

The divergence seems to have stopped ES in its tracks and reversed it, the divergence is now leading negative even deeper.

The Chicken or the Egg?

I think this is AAPL moving the market and not vise-verse

 As I was starting my AAPL analysis I saw this move on volume, the next thing I did was check the averages to see they all looked similar.

 SPY

 QQQ

 DIA

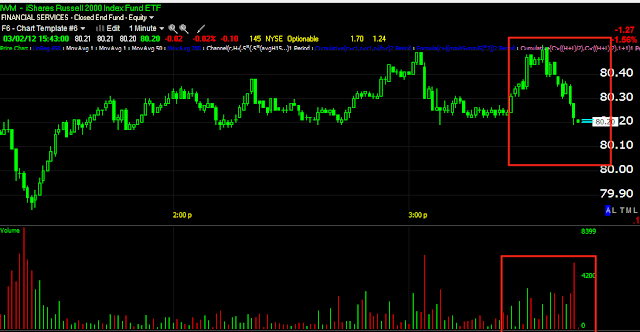
IWM

Market Update

 I'm starting with the 2 min chart and then the 1 min, the 2 min shows the positive divergence seen in ES and what appears to be some weakness although it is slight or just starting.

 For more detail on that weakness I'm looking at the 1 min chart which is showing more weakness

 I'm not sure how to take the 5 min chart, it could be the 2 min positive bled to the 5 min and the 5 min is not showing the weakness bleed through yet. Or it could be the 5 min is showing a bounce in to the end of day. I'll address this further, but remember the psychology in the market is buy the dip.

 IWM 2 min positive divergence and perhaps some weakness building in.

 The 1 min chart suggests that is the case.

 In further addressing the 5 min chart, it should be remember that even if there is a positive intraday divergence, the overall position is leading negative and even lower today, so an intraday bounce may materialize in to the close, but it is in a position of greater weakness which would suggest that it will just be shorted/sold in to strength by smart money.

 QQQ 2 min didn't show a positive divergence and while it has held up well today vs other averages, esp. the R2k, it seems the relative outperformance is being used to sell aggressively.

 QQQ 1 min shows a very small (weaker) relative positive, this is why it didn't show up on the 2 min, it wasn't strong enough to bleed through.

 The QQQ 5 min leading negative position.


 SPY 2 min positive divergence and basically in line right now

 The 1 min confirms the exact same

This has the strongest 5 min intraday positive divergence.

I'm going to look at sectors like financials, energy and AAPL as it is nearly its own sector now.

ES Update

The 3c template is loading now, but looking at ES/3C...

ES has been largely negative all day, there was a noon time positive divergence sending ES a bit higher, that is now going negative.

Risk Assets and Sector Rotation

We look at these risk assets because they "should" rally with the market. Many times they are predictive or leading indicators and the longer term shows how dislocated the market is and how serious it is. Sector rotation tells us a lot about the tome of the market and where potential trades are.

Commodities
 Commodities were a leading indicator early today as the market tested yesterday's afternoon highs, commodities moved lower, right now they are just about in line with the market probably due to the Euro consolidating as it broke below $1.32. Remember we often see a volatility bounce after n important support level is broken ad that happened in the EUR/USD pair today.

 As a reminder, longer term commodities are severely dislocated from equity performance

 High Yield Credit still hasn't made a higher high with the market is 4 trading weeks now, interestingly this is the same area where the 3C divergences have gained downside momentum and the averages have lost momentum.

Over the same 19 days the SPX has gained +1.88%, compare that to the previous 4 weeks at 5.25% . The R2k has a percentage move of -2.86% over the last 4 weeks compared to +9.93% for the previous 4 weeks. The Dow -30 has a .98% gain for the last 4 weeks compared to 3.65% for the previous 4 weeks and the NASDAQ 100 (the strongest) has a current 4 week gain of 4.47% compared to the previous 4 weeks at 7.56%.


 Yields which are like magnets for equities refused to make a higher high yesterday and the end of day comparison was a warning. Early today they declined while the market was lateral, even now they will not participate in this bounce.

 Long term, Yields called the July melt down in equities and the October rally, they have not participated since.

 Here's the EUR/USD (Euro) since yesterday's close, note the consolidation below $1.32

 The Euro's performance over the last several days vs the SPX.

 Longer term, the Euro called the 2011 top and July equity market decline, the Euro remains strongly dislocated from the market. I do not think the correlation is broken and I do believe equities will revert to the mean.

 High Yield Corporate Credit sank badly at yesterday's close.

 Here it is today, not participating as well as calling out a red flag between 1 and 2 p.m. yesterday which is precisely where we saw strong negative 3C divergences.

 This is Energy vs the SPX, it did not make a higher high yesterday with the market, a negative divergence and it is performing worse relative to the market today.

 The long term dislocation between energy and the SPX, note that they were in sync during August/October.

 Financials yesterday also were a red flag at the 1-2 pm area, they performed a bit stronger early today and have since weakened vs the SPX.

 The recent divergence between financials and the SPX

 Technology is outperforming today.

 Looking at today's sector rotation, Financials, Energy, Basic Materials, and Industrials have all lost ground. The trade is more defensive with Healthcare, Utilities & Staples gaining ground. Only Tech and Discretionary are risk sectors performing relatively well and not that well compared to the Defensive sectors.

This is the SPY vs AAPL, you can see where the Tech strength or at least relative outperformance is coming from.