Analysis turned into dinner and then a movie.
So here's my take, everyone was expectng a bounce on the done debt deal, the trade was too obvious, after the House passed the legislation, the debt deal was too obvious.
What the market is really worried about is a downgrade and tonight Moody's passed on a downgrade, although they did put out a negative outlook which they had to do to keep any credibility.
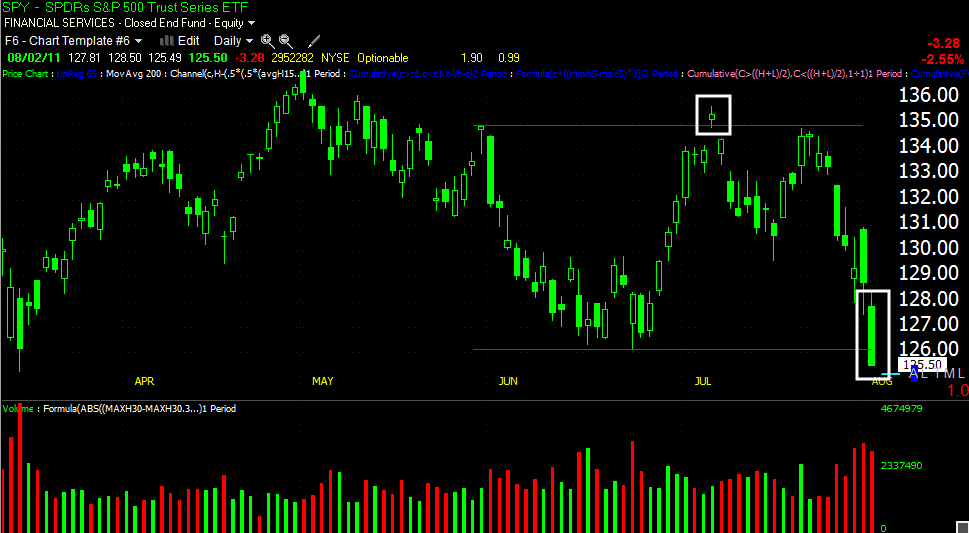
Today some serious levels were taken out, these are the kinds of levels that send traders into the market on the short side.
Some examples...
The Dow-30 breaking support and the 200 day moving average.
The Russell 2k at new lows for the year.
And the SPY taking out support, but in this is a possible head fake move as well, with all of the important levels broken, there's going to be a large short presence, a perfect setup for a head fake. You can see the last head fake in the SPY on a new high, they tend to be at extremes.
If a head fake plays out, I would expect the market to open lower and probably sell-off a bit more committing shorts to the move. I'm not basing my analysis on an oversold move because there's no way to define oversold, I'm basing it on 3C charts that seemed to defy new lows and made higher highs. Also the Price / Volume relationship came in at Price Down/Volume up, this is a typical short term reversal relationship on short term capitulation.
Some other information I found interesting...
The quote stuffing at the end of day which coincided with the market breaking afternoon support and pushing a few averages that little bit extra needed to break important levels. What I find interesting s why cancel the order if you are bearish?
The McClellan Oscillator is at lows that are associated with rallies-the SPY is in red here.
On a 5-day Bollinger Band (20,2) in a flat BB environment, when the market closes below the lower band, often it leads to a move up. The key s a break of the band and the bands being relatively flat (indicating the volatility of a topping market).
Also when the % of stocks above their 40 day moving average spike low, often a rally follows.
Ultimately we see a lot of head fakes, they help set up the trade and the give extra energy to the resulting move and more then anything, they cause a lot of people to be wrong. In retrospect, the expectation of a rally today on the debt deal was so peppered across the media, it was just way too obvious.
I'll be keeping an eye on the early trade, but I would expect the morning to look pretty nasty, it makes sense just from a head fake point of view, you need traders to commit to the short.
No matter what happens, whether you are long or riding out some of our shorts, HONOR your stops. If there's to be a bounce, they'll be time to catch it. If the top breaks down, there's tons of room on the downside.
Keeping your chips is what the game boils down to. There will always be another train on Wall Street.
Tuesday, August 2, 2011
Miners Trading System Signal
The signal remains Long DUST.
Keep in mind the stop-loss is $38.02
I'll be posting a wrap up post, but I'm testing some historical correlations on Stockfinder, once I'm done, I'll bring you the Daily Wrap post.
Keep in mind the stop-loss is $38.02
I'll be posting a wrap up post, but I'm testing some historical correlations on Stockfinder, once I'm done, I'll bring you the Daily Wrap post.
HFT Quote Stuffing
Appeared in the markets at 15:41 (3:41 p.m.)
Compare to the SPY..
These aren't orders meant to go through as they are placed and almost immediately pulled.
The definition of QS-
"A tactic of quickly entering and withdrawing large orders in an attempt to flood the market with quotes that competitors have to process, thus causing them to lose their competitive edge in high frequency trading. This tactic is made possible by high-frequency trading programs that can execute market actions with incredible speed. Only market makers and other large players in the market are capable of executing these tactics, since they require a direct link to the exchange in order to be effective. "
Given some of the other strange stuff seen today, draw your own conclusions.
More Strange Behavour
We know that a strong dollar usually means a weak market, the FXE (Euro) is the inverse of the Dollar Index, so when we see strength in the FXE, it means the Dollar Index should weakness, which has inverse correlations with the market.
FXE strengthening 1 mn
FXE 10 min
FXE 15 min
UUP 1 min
UUP 5 min
UUP 10 min.
FXE strengthening 1 mn
FXE 10 min
FXE 15 min
UUP 1 min
UUP 5 min
UUP 10 min.
FXA
As many of you know, we've used the Australian dollar as a divergence indicator or a leading indicator for the market. So far every time we've used it, it has worked. While the SPY is near new lows here, the FXA is near new highs. An interesting chart.
Market Update
DIA 1 min leading
DIA 30 min chart now leading!
IWM 1 min leading
IWM 2 min leading
IWM 15 min leading and look at the relative points of divergence.
IWM 30 min chart now leading -also note relative points of divergence.
QQQ 1 min leading
QQQ 5 mn also leading
QQQ 15 min leading and note relative points of divergence.
QQQ 30 min chart now leading-also note relative points of divergence.
SPY, RSI positive divergence on a possible inverse H&S base...
SPY 1 min leading
15 min also leading and note relative points of divergence
This is a strange market, the VIX is behaving strangely, however, these are some very strong readings, rarely seen.
HBI Follow Up
HBI was a short trade idea from July 22 @ $31.12
Here's the initial trade, still like HBI and it's staying on my short list.
However, just in case, I would consider a trailing stop-a 50 bar average on a 60 min chart will keep this trade at a profit and not let it become a loser.
Here's the initial trade, still like HBI and it's staying on my short list.
However, just in case, I would consider a trailing stop-a 50 bar average on a 60 min chart will keep this trade at a profit and not let it become a loser.
Head Fake?
We know from experience on daily and intraday timeframes that the head fake is the most common Wall Street game we see before a reversal, we see it probably something like 85% of the time.
So is today another head fake?
Head fake on the DJ-20
On the Q's
The SP-500
And XLF just to name a few.
With the exception of the DJ-20, usually a break of support would send these averages plummeting, n fact if I were trading the way I did 5 years ago, I'd be short everything and have expected the Dow to have given up 300 points today. Price s the final judge, but more often then not, price indications can be very devious.
Franc Follow Up
The Franc is one of the currencies, like the Australian dollar that can often be a leading indication for the market (inversely).
The FXF hasn't added anymore gains to its parabolic, knee jerk-like rally and just broke some initial support on increasing volume.
SRS long Follow Up
SRS is a long trade from 7/27 The trade is up nearly 10%
This remains one of my favorite trades and I think it has a lot of upside. For the swing traders, I would consider a trailing stop in this area. If you are long term, then I'd probably just leave it alone.
a 50-bar m.a. on a 30 mn chart would be my choice, although it could be widened out to a 60 min scale.
SRS isn't showing any dire signs, but there's usually a pullback after a break out from the base we were looking at.
MRX Short Trade Follow Up
MRX was a short from 7/15 @ $38.54
Here's the entry @ nearly a 7% gain.
I still like the trade a lot, but I would consider a trailing stop, maybe a 50-bar average on a 60 min chart.
Here's the entry @ nearly a 7% gain.
I still like the trade a lot, but I would consider a trailing stop, maybe a 50-bar average on a 60 min chart.
Market Update
There's some short term hart movement now...
DIA 1 min approaching a leading position.
The IWM has looked the best 3C-wise all morning, I'd like to see this chart lead.
The 2 min chart is leading
QQQ 1 min is starting to lead.
The SPY is not leading, but there has been improvement on a relative basis at the second white arrow.
DIA 1 min approaching a leading position.
The IWM has looked the best 3C-wise all morning, I'd like to see this chart lead.
The 2 min chart is leading
QQQ 1 min is starting to lead.
The SPY is not leading, but there has been improvement on a relative basis at the second white arrow.