Friday, March 27, 2015

Daily Wrap

What a week, but the end of the week may have been most interesting.

This was some of the worst weekly performance for the averages in months.

Biotechs, the momentum Energizer Bunny was halted dead in its tracks...
Not only was this the worst weekly performance since the October lows that broke some important long term trendlines for the broad market, it was also the HIGHEST VOLUME EVER! This gives a lot more credibility to the case for a "Blow-off top" in biotechs, down -6% on the week. Now you can see why Bios are near the top of my list for assets to short in to price strength on a market bounce.

The intraday Biotech chart closed like the averages as you'll see below. Sticking with the concept that price usually picks up where the 3C divergence left off, we should see weakness in bios on Monday morning/Monday and then a bounce along with the rest of the market.

However, take a look at the last sell-off in October and compare the 4 hour 3C chart's divergence then compared to now...
There was a large negative divegrence in to the Q1 2014 highs and the strong pullback of over 21%, but the next divergence is the October pullback of approximately -9%. Even though the percentage loss wasn't as big this week, look at the leading negative divegrence since the October lows, it seems smart money has been using this parabolic move for months on end to get out of bios as retail holds the bag at unsustainable prices. This one is going to be ugly, thus I want in at the best place possible as a new position or an add to position as long as it doesn't violate risk management rules.

Financials are another, you'll see their performance in the sector performance and of course transports.

Financials look set to bounce, but again they look horrible. I love FAZ long here and would add to it on a bounce in Financials.
This extremely strong 6 hour chart of Financials (XLF) is so ugly that it's beautiful, I couldn't bring myself to draw on it, although I doubt you need any hints as to where the worst divergences are and how bad it has gotten over the [past several months.

Remember the oil/USO pullback we were expecting just before the Yemen conflict erupted? Well Crude was on track to have its best week since July 2013 before our negative divergence kicked in and pushed Crude RED ON THE WEEK!!!
As you know, we have near term expectations (lower) intermediate expectations (more base building) and longer term (upside reversal).

The Averages this week...
 The averages on the week with transports looking horrible, another group I'd like to add to an already open short position on a bounce. This was the biggest weekly decline for transports in 6 months!

Almost all of the averages have retraced all gains since pre-F_O_M_C knee jerk. Transports have been destroyed.

And Year to date, the SPX, Dow and Transports which never confirmed the Industrials this year, are all red.


As for sectors...

Today's performance isn't surprising given the daily candle (close) which sets up a bullish short term reversal...
S&P with a Star yesterday and today.

Thus the daily sector performance isn't surprising with 6 of 9 sectors in the green. However...
 On the week, this is what the 9 S&P sectors looked like with Financials performing the worst.

Since the F_O_M_C knee jerk reaction...

As for Morningstar Groups today, again not surprising given the last two flat days, 168 of 238 closed green.

Yields were up slightly on the week, bonds slightly down as we had an ugly 5 and then 7 year auction mid-week.

The $USD lost -4% on the week, I suspect this is directly related to the carry trade unwind.

Yellen was on deck today (afternoon) and as I have maintained since 2012 when the F_E_D started changing or even talking about changing their model for forward guidance, they were already looking for the exit way back then.

As you may recall, the F_E_D first talked about which was my first hint and then actually did, change the yardstick for guidance from  quantitative as in "We will raise rates 6 months after the end of QE3 " which is what Bernanke said to a Qualitative one which sounds like, "It depends on the incoming data".

What is unique and special about this is that it gives the F-e-d the ability to change interest rates or other policy long before objectives are actually achieved like 2% inflation. The F_E_D even said that they would raise rates as long  as they "FELT" comfortable that inflation would move to their 2% comfort zone. This allows them to say anything about what they feel despite the data and hike rates even when inflation data is very poor.

Well for all the "Buy the Dippers" out there and the "F_E_D has our back " crowd, the "This time it's different" folks, Yellen just confirmed everything I've been saying since we first saw the first hints that the F_E_D was looking for a way out. From today's Yellen speech:

"I would first note that the current stance of monetary policy is clearly providing considerable economic stimulus. The near-zero setting for the federal funds rate has facilitated a sizable reduction in labor market slack over the past two years and appears to be consistent with further substantial gains. A modest increase in the federal funds rate would be highly unlikely to halt this progress, although such an increase might slow its pace somewhat.

Second, we need to keep in mind the well-established fact that the full effects of monetary policy are felt only after long lags. This means that policymakers cannot wait until they have achieved their objectives to begin adjusting policy. I would not consider it prudent to postpone the onset of normalization until we have reached, or are on the verge of reaching, our inflation objective. Doing so would create too great a risk of significantly overshooting both our objectives of maximum sustainable employment and 2 percent inflation, potentially undermining economic growth and employment if the FOMC is subsequently forced to tighten policy markedly or abruptly.In addition, holding rates too low for too long could encourage inappropriate risk-taking by investors, potentially undermining the stability of financial markets. That said, we must be reasonably confident at the time of the first rate increase that inflation will move up over time to our 2 percent objective, and that such an action will not impede continued solid growth in employment and output"

And that's what is known as a "Hawkish F_E_D". Given today's statement in which Yellen (you must read between the lines with the F_E_D, they can't come out and say it if it's not in the F_O_M_C forum) all but told the market RATE HIKES ARE COMING and likely JUNE, I wouldn't be surprised to see the "bounce" divergence run over.

This is what I would consider new, fundamental data that the market hasn't discounted. I don't mean a June Rate Hike, the market believes that, but this is  THE CLEAREST YELLEN HAS BEEN ABOUT A RATE HIKE AS SHE USUALLY TRIES TO EMPLOY GREEN-SPEAK AND WALK A FINE LINE IN WHICH SHE TELLS YOU NOTHING.

ALSO, THERE'S CLEAR CONCERN ABOUT THE MARKET BUBBLE AND IT SEEMS JUST AS THE F_E_D WAS DESTINED TO INFLATE IT, THEY ARE NOW READY TO POP IT.


MOVING ON, IN TO THE CLOSE THA MARKET GOT A BOOST FROM ANOTHER FUNDAMENTAL SURPRISE THAT HAD NOT BEEN DISCOUNTED, INTC IN TALKS TO ACQUIRE ALTR.

This is what caused the end of day ramp, not any divergences and I don't think this changes Monday morning as the concept of the market picking up where the 3C signals left off is a strong one, even over a 3-day weekend (which is next week).

Was the INTC news front ran by those with inside information? While we can never tell for sure, the market didn't show a positive divegrence today, the QQQ specifically did not show a positive divergence today, the Dow of which INTC is a component didn't show a positive divergence today, but strangely just after the open today, INTC did show a positive divegrence. If there was a leak, it was this morning.
INTC intraday had been in line, it had a very flat rangebound trend today like the market, yet 3C continues to move higher in a leading positive divergence all day as if more and more INTC stock was accumulated before the news broke. It's your call whether or not you find this "Fishy".

Looking at our Leading Indicators again to keep up on them from day to day...
 Our custom SPX:RUT Ratio indicator was in line Wednesday, but leading the market Thursday and today, suggesting a near term/short term bounce.

Pro Sentiment Indicators were slightly supportive today, thus signaling a short term bounce is highly probable.

Our second version of Pro Sentiment was looking better the last 2 days, but weakened a bit today which would be in line with the pullback to broaden the base Monday as I have expected and the 3C charts ended for the day.

High Yield Corp. Credit is still in a near term supportive area around the $209 (SPY) area which is about where I thought we might bounce to based on where we first saw the 3C divergence.

However looking at HY Credit for the year, at 1 we have the range I said needed to br broken on the upside before we see any serious downside as it was just that obvious and retail will chase the breakout.

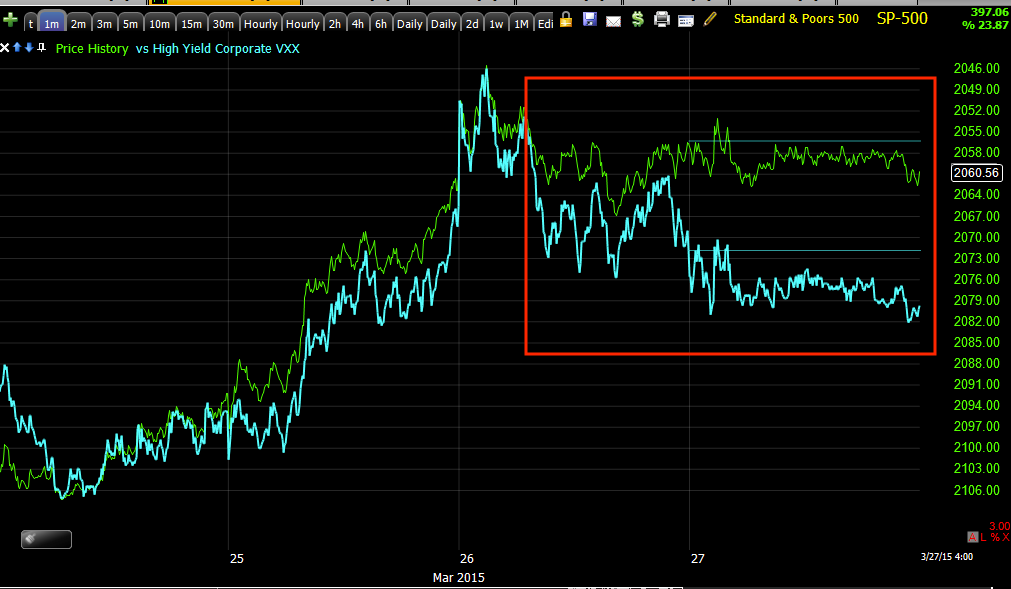
At # 1 and 2 note HYG leading the SPX making higher lows and at 3HYG is in line with the SPX.At 4 and 5 HYG is in line with the decline and at 6 HYG is making a negative divergence which carries through the rest of the bounce, but still leaves some slight near term support.

On a primary trend basis...
HYG has confirmed the SPX in 2013 and diverged in 2014 and is now in a primary downtrend making lower highs (red) and lower lows (orange), just as with the charts above, HY Credit tend to lead the market so I expect the market to catch down to credit. Note the area in yellow, if you can't see the HYG divergences that sent price lower, below I zoomed in on the area just to show you HY Credit's leading quality as it is a smart money risk asset, if they are not buying risk, why would you want to be?
This is the area in yellow from above, note HYG's lower highs in to the SPX's higher highs, a negative divegrence which sent the SPX lower and to the right the HY Credit divergence that caused the sel -off to the October lows which is what happens if I scroll over to the right a bit more, you can see above to the right of the yellow box.

HY Credit (another form) sold off in to the last bounce sending it lower, but has slight support for the bounce I have been expecting, a smaller bounce, but watch out for volatility, that is actually what I'm most interested in as it will lead us deeper in to stage 4 decline where the large downside moves occur, check past charts of sell offs at the start and in the middle/end.

Also note pros who trade HY Credit are selling in to the F_O_M_C rather than a knee jerk buy, they understood the significance highlighted by Yellen today.


HY credit short term over the last several days is supportive of the bounce we have been expecting since just before the Yemen conflict sent the market lower.

Commodities are also near term supportive, but today suggest we see the pullback I anticipate early Monday to finish the base, then we should bounce on increasing volatility where we want to enter any additional and perhaps final (at least best positioning) positions before a move to make a lower low on higher volatility.

Look at the VXX/Short term VIX futures today vs the SPX (SPX in green is inverted so you can see the normal correlation). Today VXX underperformed the market, again suggesting a bounce early next week as well as accumulation of VXX at lower prices.

Spot VIX also looked the same and...

Look at this VIX slam on the open this morning, it idn't move the market up as it normally would, perhaps it was needed just to keep the market from collapsing on the op-ex max pain pin.


Yields (5 year) moved lower today, also hinting we see an early pullback Monday...

However on a larger basis we see yields falling in to the F_O_M_C just like HY Credit and the knee jerk move that has been all but retraced in almost every asset asI warned, don't trust the knee jerk move.

At #2 Yields lead the market lower at the top of the SPX's bounce and it follows at #3, yields have a slight positive divergence suggesting a bounce next week as we have suspected. Again, I would not try to play this bounce long, I think there's too much risk, but I would short in to its price strength as we see distribution signals setting in.

30 year yields intraday at the close moving lower , remember they act like a magnet for the market so another sign that we should expect early downside to finish the base Monday.

Adding to that is the 3C close for the averages, the market tends to pick up where the 3C divergence left off which intraday is negative for the SPY.

Negative for the IWM

And for the Q's.

All of these suggest the market sees early weakness on Monday, it should finish the base from the last 2 days and bounce, the bounce should be volatile so don't be surprised if it looks strong. After a week like this week longs aren't going to be tempted back in to buying easily without a strong looking move which they'll chase, putting them long near the top of the move where we'll be looking to short as smart money will be selling and shorting as well.

Well that's going to do it for today, I hope everyone has a fantastic weekend. Remember next week is a 4-dday week with Friday closed for Good Friday.


EOD Ramp on INTC talks to acquire ALTR

For a moment it almost looked like the market would stayed pinned through the entire day which would be unusual after 2 p.m. on Friday, but INTC let out that they are in talks to acquire ALTR sending both stocks and the averages higher, however this made absolutely no change to the underlying trend and the probabilities in to early Monday and as far as the rest of the week and beyond go.

News on INTC...

More on the way, an interesting week for sure, however the Week Ahead forecasts stands.

The 2 P.M. Op-Ex Pin Expiration / Week Ahead

Typically by about 2 p.m. we see the market do as it pleases, often randomly as the options expiration pin is released, having caused the largest dollar amount of options to expire worthless giving Wall Street easy profits as a majority of options will expire worthless which is why I have adopted a different strategy with options that is essentially the opposite of everything that is appealing about options as they were created by Wall St. just like the state's create the lotto, they know what appeals to people and like Las Vegas, they know the odds are on their side. So while I won't get in to the whole thing right now, I have tuned my profitability on options around, rather than taking large losses as I played options the way they appeal to us (buy cheap, but a lot, buy short expirations so you can buy cheap and a lot and hold them too long trying to score a triple digit gain). Rather I try to buy in the money, quality options with lots of time, more than I think I'll need and I never buy them chasing an asset, but only when they move in the opposite direction of my intended plan so I get them at a steep discount and sell them at the first sign of a pullback or consolidation to avoid losses through time decay. I also use options as a tool for specific trades and circumstances rather than a trading system, but that's another post.

We are near the end of the Friday op-ecx pin which we have typically seen end around 2 pm as most contracts are closed out by then.

Now the market is free to move a bit more and we get some of the best 3C data of the week the last 2 hours of today.

Here's what the intraday averages look like, remember what I expect very short term (pullback)...Therefore, the signals we see right now could either work in to the close, but I'd still expect some more work to be done on a short term bounce base that we have been looking at in to Monday or these signals could just pick up in to Monday Either way, I think the charts below should give you a good idea of what to expect next week broadly speaking. If I need to make any changes or updates to the forecast, I will.

 QQQ 1 min with a VERY narrow range today, typical of an options expiration maximum pain pin level. However note the 3C negative divegrence intraday today suggesting a drop in to the close or in to early next week/Monday morning likely as the white arrow is about where I'd expect price to move to in order to have a base that can support even a 1-2 day bounce.

More important than any bounce we can sell in to is RISING VOLATILITY, that is what we see between stage transitions and even though we've already transitioned to stage 4 decline, as I have shown in 3 examples this week, even in stage 4 it's not until volatility picks up do we see the sharp downside moves that stick.

 Confirmation on QQQ 2 min with a positive at yesterday's base low and a negative in to today as we need to touch the area of that low one more time.

QQQ 3 min negative divergence today is even more confirmation, keep in mind all short term intraday charts.

 As for the bounce, QQQ 5 min with distribution at stage 3 top which forced price in to stage 4 decline or the start of it and the base accumulation area for the bounce I'm looking for, more importantly the increase in volatility whether up, down or sideways.


 IWM 1 min going negative intraday today

 IWM 2 min with the suspected base lows from yesterday (white) and a negative divegrence short term in to today for the move down expected to finish the base.


 3 min IWM leading negative divegrence today, again whether we move down in to the close or Monday morning, it looks like that's where we are going as suspected yesterday. Remember we expected today to be a dull day because of the op-ex pin.


IWM 5 min bounce chart/divegrence, although I don't think the base is done, the chart that needs to be positive for any bounce more than intraday, is.

Now a broader look at the week ahead using SPY.

We have the positive in to yesterday's lows, likely the base area and a negative in to today's tight op-ex pin.

SPY 3 min also negative as well as a larger negative at the stage 3 top of the last bounce sending prices lower.

This 10 min chart shows the F_O_M_C knee jerk move, the distribution in to it we expected and the complete retrace of the entire knee jerk move as I always warn, "Beware the F_E_D knee jerk move, 80% of the time it is wrong".

To the far right a positive for a bounce, but no where near as large as the negative on the chart.

As far as what happens after a bounce early next week which I want to use to short in to or open puts as the bounce looks to end...

Remember the early 2015 range and my warning that we will have to see a head fake move allowing smart money to sell in to retail buying on a breakout above the obvious range before we can move any lower. That range and head fake move have occurred, the distribution in to the move which we expected is now on the chart, thus any bounce on short term charts is a gift to use to sell or short in to.

We have a horrible leading negative divegrence and this is no 3 min chart, it's a 30 min so I expect as the bounce ends next week, we see another sharp move lower like this week, except this is the real volatility move that sticks if you remember the 3 examples of similar situations in the recent past.

I do believe we will make a new low for 2015 and we will challenge the October lows and we will, maybe not next week, but soon, break to a new low for the entire trend since 2009, below the October lows.

That's the game plan.

USO Update

Events in Yemen this week seem to have run over some anticipated moves such as an oil pullback as oil moved higher on middle east risk, gold pullback as gold moved higher on the same risk as flight to safety and the broader market in which a bounce was expected a bit earlier, but again events sent futures plummeting on initial news of the start of the coalition's invasion to confront the Iranian backed Shiite militia that was closing in on the Port of Aden in Yemen, having an Iranian puppet regime on Saudi Arabia's 1100 mile border with Yemen which also gives militants in Yemen the opportunity to establish a stronghold in which they can attack or pirate shipping through the world's 4th most important choke point as nearly 4 bn barrels of oil flow through the route every day and at its narrowest point is only 18 miles wide connecting the Red Sea to the Gulf of Aden, was simply a risk the Saudis were not willing to tolerate and apparently about 10 other countries in the coalition all in the MENA region. Of course this risk is not over even though the overwhelming force brought to bare on the militants should make short work of them, it is the unexpected and unintended consequences, the unforeseen that is always the most dangerous like this turning from a proxy Saudi/Iranian proxy war to a broader Sunni/Shiite secular conflict, Iraq is the quintessential example of what arbitrary borders can cause when a Sunni minority rules over a Shiite majority in a country like Iraq. Unfortunately as much as I disdain the acts of Saddam Hussein, it takes an iron fist to keep a country like that intact and although by barbaric/brutal tactics, he kept Iraq intact for 40 years. Since his deposing Iraq has been on the verge of a failed state with sectarian strife and outside militants easily gaining a foothold in the country.

Another example is Afghanistan whereby the Taliban may have officially been removed from power, but the capital can hardly project any influence outside of Kabul itself.

And perhaps the most atrocious example of them all, the genocide in Rwanda that killed nearly 1 million minority Tutsis by the Hutu majority in just 100-days as the international community and the UN stood aside and watched it happen. In this case though this was an artificially imposed sectarian separation as Rwanda was a colony of Belgium and the Rwandans who were all one people were divided in to groups by the European colonial power. The taller, lighter skinned Rwandans who seemed to have more European features were designated as Tutsis while the darker, shorter and broader Rwandans were designated as Hutus. The Belgium authorities gave the minority Tutsis all of the important positions of power causing animosity which materialized after Belgium abandoned the colony and Hutus were left to their own devices.

My point simply being, if an imagined difference that is merely born out of appearance can be so deadly, how much more so can a real difference between two sects of Islam that have been feuding for centuries?  Thus we may not have seen the last of events in Yemen or born out of the conflict there.

As for oil, I have been expecting a pullback, a stronger base to be finished up and while I have no idea what the catalyst would be other than perhaps a reversal in the $USD, I suspect a primary trend change in oil from down to up.

 This is the long term and very strong divergent 2 hour USO (WTI Crude) chart showing a H&S top and the negative divegrence at the top should be clear as it is one of the larger divergences over the last year. At the far right and lows, a large and building positive divegrence which I initially though early on would simply lead to a sharp counter-trend rally and then a resumption of the downtrend, but the base is too big now for a simple counter trend rally and I have suspected for the last 6 weeks or so that this is a primary trend base or thereabouts to lead to an upside reversal in oil.

 The 30 min chart is not as strong of a divergence as a 2 hour chart, but it confirms the same information, distribution at the top in a H&S price pattern to the left, 3C confirmation of lower prices as 3C moves lower with price and then not only a change in price trend from down to sideways, but a large leading positive 3C divegrence/accumulation.

You can already see a "W" base or double bottom which we predicted a couple of weeks ago would happen and additionally that it would make a slightly lower low (the head fake/stop run or bear trap).

This is the area of the second low at the white trend line and confirmation of the move higher off that low on a 5 min chart, still an institutional timeframe, but more for near term trade and it has recently gone negative suggesting a pullback as the longer/stronger charts are still very positive and don't reflect that kind of distribution. Thus this is what I have suspected for this week which was delayed by the sudden onset of hostilities in Yemen by the Saudi coalition.

 The very short term intraday 1 min chart also shows confirmation of the move higher off the second base lows and a recent negative divergence suggesting out forecast of a pullback in oil is a probability.

I'm not interested in shorting oil beyond perhaps a quick options (put) trade or a swing trade with some leverage. The bigger trade here is the long position and a pullback is the kind of trade I like the most in which the market comes to us on our terms and must prove itself before we ever enter in to any position or risk, it's also giving us a better price point and less risk as well as better timing.

One scenario I can imagine that may send oil higher is the reversal of the strong $USD trend. Since the end of QE, the legacy Arbitrage correlation of dollar denominated assets has returned, it disappeared during the F_E_D's QE as anything and everything were bid up on virtually free money the F_E_D was passing through the banks which they put in to the market, but since the end, it seems the historical $USD legacy arbitrage correlation has returned. This is  when $USD denominated asset like oil, gold, silver, etc. move opposite the dollar. If the dollar gains in value oil falls, if the dollar loses value prices of oil must rise to compensate. The F_E_D needs to break $USD strength and as such, that may be what changes oil's trend.

 This is USO in green and the $USD in red, note the inverse correlation in which they move opposite each other. Also note the large volume or capitulation after a nearly -80% decline in oil at the 2008 highs which marked the end of the downtrend and note a similar volume swell now that also looks like capitulation or a mass selling event or flame out.

If the Dollar is broken by the F_E_D as I believe they have to and it has already shown signs of failing, then oil has a good chance of bouncing.

This is the daily chart of the $US Dollar Index and the strong uptrend with 3C confirmation until very recently, suggesting the Dollar lose ground as it has already had one of the sharpest pullbacks in over a year recently.

Short term I expect oil to pullback to the base area at the red trendline before heading higher. A move to new lows to run stops is a probability and also a probable excellent long entry.

My Trend Channel not only held the uptrend, but is still holding the downtrend with a stop at the $18.60 area, this should tell us when there is a real change of character and oil should reverse course on a move to the upside.

As pointed out earlier today, the pullback we have been looking for near term has begun today, I suspect we see more for the immediate near term, but after that, I think we have the chance at a beautiful, long term trend trade long oil/USO.