Thursday, December 18, 2014

No Daily Wrap Tonight

We pretty much know where we are, just about all indicators that have begun to move in the right direction , but need a little more time and strength, otherwise, everything is on track as I expected, maybe even ahead of schedule.

I will look at and post the futures tonight should I find anything that threatens to alter the course or speed up events in moving of this market to the downside.

Remember tomorrow is an options expiration Friday and should likely see the typical max pain pin near Thursday's close until 2 p.m. or so.

I'll be back in a bit with tonight's futures update.

SPXU, SQQQ, SRTY

The only thing missing in these assets themselves are the reversal process, one I expect will likely be put in tomorrow, perhaps Monday, but I would not fault anyone with starting positions in any of these as they confirm the weakness in the market averages being seen with their strength.

 SRTY 3 min leading as if very little was sold.

SRTY 3x short IWM at a significant discount leading at 5 min

 SQQQ 1 min leading

SQQQ 2 min


SQQQ 5 min, again as if very little was sold in any scale, aware of the same thing we are in our forecast.

SPXU 2 min

SPXU 3 min, also leading as if very little was ever sold in advance of yesterday's move.

All I can say is I'm glad that my positions are all in place.

I would normally expect a wider reversal process, I think it would be healthier and we have an op-ex Friday.

However with the pace of events, the additional theory that this initial move fool longs in to thinking a Santa Claus rally has begun, would provide a most venomous sting if they were to awake Monday morning to a gap taking out the entire move.

Market Update

Everything is set upon its proper path, everything about our forecast, both ways (Crazy Ivan) have been giving incredibly clear signals.

It is very difficult for me t say though, "Short here" if we are trying to thread the needle. If you are interested in the broader perspective and highest probabilities, than as long as you have the risk tolerance and emotional ability to deal with days like yesterday, then by all means, this is your place.


The move yesterday and today gave you significant advantage on entering new or add-to shorts.

The reason I can't or don't feel comfortable saying, "right here" which I may at some point with signals that are screaming as we are already broadly in line with our forecast as the IWM starts to create a bull trap which I believe is capable of adding more, is the fact that the base for this move is so unstable.

I have a very high risk tolerance, which I suppose is one of the reasons I can sit in my fully short personal positions through a day like yesterday and not lose a wink of sleep, so long as probabilities are on my side.

As  a professional trader being my ONLY means of income with a rather sizable monthly bill to carry and all of my net-worth in my trading account other than my home (which I understand is relative to each of us, but for me, relative to my trading account  it was a wonder I could make it) I would make between 100 and 200 trades a week on average which is why my broker agreed to lower my commissions. If you took the weekly transaction costs alone, I could pay my monthly bills easily most weeks (i.e. my discounted commission because of so many trades was still between $600 and $1200 a week in transaction costs not including slippage in my fills). My point being, I had little problem taking on trades such as yesterday's with a very high risk tolerance, often carrying short term day trading positions of over 15% of my account overnight. However, even I was not keen to take on a trade I believed with all of my heart would make at least IWM $118, almost +13% in 2 days (using the typical 3x leveraged ETFs I'm fond of).

The reason as mentioned before, the base was not solid and as such prone to sudden failure especially upon any unforeseen (non-discounted news) . This particular market and this move are so unstable that I could easily imagine waking up to a gap that erased 50-100% of yesterday's gains and most people who make sizable money in a short period are very slow to sell such positions, not wanting to believe it is possible such a strong move could fail so fast, leaving them with the largest losses of all.

In any case, my point is it's difficult to say, "This is the exact area I'd enter shorts" beyond the broader perspective that I hold because of such an unstable base.

Intraday since I gave you the baseline for the averages , Index futures, and levers, this is what has happened so far. In almost all cases, there's an increased degree of distribution and the levers are quickly fading.

 SPY intraday deterioration increasing

 SPY 2 min leading negative which is now even deeper than this capture.

 The SPY 5 min chart for the first time leading negative on an institutional (intraday) timeframe.

 The SPY in context of its positive divegrence (again note the head fake in yellow).


 QQQ 2 min relative negative increasing to a leading negative divergence

 QQQ 5 min (institutional intraday timeframe) showing distribution throughout the day.

In context, the same 5 min divegrence.

IWM 1 min starting with weaker relative performance today after strongly out performing yesterday. Initially a weak 3C start, but adding some support and then in line with a leading negative divegrence setting in.

 IWM 2 min chart, deeply leading negative for the timeframe. This chart is slightly worse since the capture.


 IWM 3 min showing pure distribution through today on this 3 min chart, also worse since the capture.


Es intraday seeing shaperning leading negative distribution.

ES 5 min adding to its divegrence

NQ 1 min negative

And remaining so at the 5 min mark.

TICK is fading as intraday breadth weakens .

 Finally the $USDX 1 min is leading negative, this should begin to effect the carry cross, USD/JPY soon.

The 5 min Yen positive which will also do the same to the carry pair.

And 30 year treasury futures which were not positive earlier are now so.

I am not calling for the sky to fall at this moment, but everything is quickly moving to undo the support built since Friday.

This will be a bull trap and will take the market lower. Ironically the higher the market and IWM in particular move, the stronger the bull trap and deeper the decline, just like Monday's downside move is what created the short squeeze momentum yesterday that saw small cap IWM stocks see their best short squeeze performance in 3 years.

Price is very deceptive, what seems like a bearish move is actually creating a bullish one and what is a bullish move is creating a bigger bearish drop.

It's all in the underlying trade and our other indicators, everyone else has to rely on what price shows them and the indicators that use price. 

Market Averages seeing SHARP/Fast Distribution

It looks like the IWM may try to hold as the others start to lose their relative performance today.

We are in the general area where a bull trap is set. I'll get charts up ASAP, but I needed to get this warning out quickly.

I like shorts in the area, although I can't say this is the perfect timing, in the big picture, I don't think it matters that much.

In any case, everything is moving as expected and now this.

Leading Indicators Keep Us on the Right Track

Yesterday's move up and the move to $IWM $118, which actually is more effective as a bull trap the higher it goes and the more longs it pulls in, was just the first half of the forecast which so far has not only given us the evidence to back up the theory, but the moves in the market to back it up.
However don't forget, that as bullish as yesterday's move was, this is a bull trap, that is the forecast, sending the market to new lows.

The Index futures, the market averages and the levers such as HYG are all on the right side today showing me that the forecast continues to provide evidence that the second half of it is correct as well and we are moving toward it just as Monday's move under the IWM's 6 trading week range was actually a bullish event that led to yesterday's move, much as yesterday's move will turn out to be a bearish event leading to new market lows.

Leading Indicators are the 3rd major post today to confirm that everything is moving in the direction anticipated, a bit earlier than I expected it to start, but also moving at a rather slow pace as well, so I guess it evens out in the middle.

Leading Indicators...
 Our custom indicators, SPX/RUT Ratio (red) and VIX Term Structure (white/green) were both positive, giving the market support for an upside move since last week , even with buy signals in white that haven't been seen since the October lows, although no where near as big as the October or August lows, but in line with some signals before that which led to 3-4% moves.

Today is the first day I recall this week that the indicators are not only not leading the market positive, but they are not confirming the price action today,  thus they are turning negative which is impressive as they were so unwavering in their signal in the run up to yesterday.

 HYG which I said, "There's only one reason to accumulate HYG" and that's to ramp the market, is not useful in ramping the market by accumulation alone, it's only by HYG leading the market as it did at the whole arrows, making a higher low than the SPX leading it higher yesterday and then leading throughout the day.

HYG is now leading the market to the downside or at least failing to confirm. This should get worse as distribution in HYG continues.

In addition, HY Credit which is NOT used to ramp the market, but is still an excellent leading indicator,  is failing to confirm today and not following equities exuberance both in HY Junk credit

And in PIMCO's HY Fund.

The VXX/Short term VIX futures is out performing the SPX today as well (note SPX prices are inverted to show the normal correlation).

Spot VIX is also showing dramatically better relative performance than SPX today as well.

 Our pro sentiment indicator that has moved down every day despite any bounces in the market , as a leading indicator, did go positive for yesterday, but it is already failing to confirm today.

A closer look, pro sentiment is not willing to chase prices any higher.

Commodities as well, a risk asset, but one reflecting a dramatically slowing global economy , didn't move at all with the market yesterday nor today and as you see, they did lead it to the downside.

5 year yields are leading intraday a bit, but...

Just like we saw at the last two F_O_M_C meetings., 30 year yields are beginning to diverge from the market. the last two times this happened , the knee jerk gains in the market were completely erased only to move to lower lows, so I'll be watching this one especially close.

Again, so far everything is exactly as it should be for our forecast to finish strong.

Market & Levers Update

My initial impression after looking around a bit more this morning is that this likely will not be a quick turn down as in today, although there may be some gap filling and additional upside before it's over, it just depends on how fast the divergences progress. There are a couple of other indications like Leading Indicators and market breadth I want to look at before making any firm near term statements, but the course the market should take is the same one that was part of the original forecast of a move above IWM $118 that sets up a bull trap for a sharper move below to make new lows.

The IWM had too obvious of a range, it was too easy to hit and too much easy money as well as short set ups to just pass by. WE RARELY SEE A REVERSAL SUCH AS THE ONE THAT HAS STARTED TO THE DOWNSIDE (OR UP) WITHOUT A HEAD FAKE MOVE AND THE IWM WAS MISSING THAT.


Other than that, there has been some rotation today in to the other averages with IWM lagging presently, but that may not last too much longer as intraday charts in IWM are gaining some ground over the others.

My initial thoughts (until I see Leading Indicators and breadth after the close), are that this isn't a time to be entering any longs, if you were going to take the long trade it needed to be done before the move above IWM $118, such as Tuesday when many of you did take long trades, call options, etc. If anything, this is a time to manage those and start putting together your short shopping list or in my case in which I'm already fully committed and in place, just be patient. I don't think this is the time yet to enter new shorts or add to them UNLESS YOU ARE PHASING IN TO THEM, if so, I'd be sure to leave some room in your risk management to add to the position at higher prices, if we are lucky enough to get them.

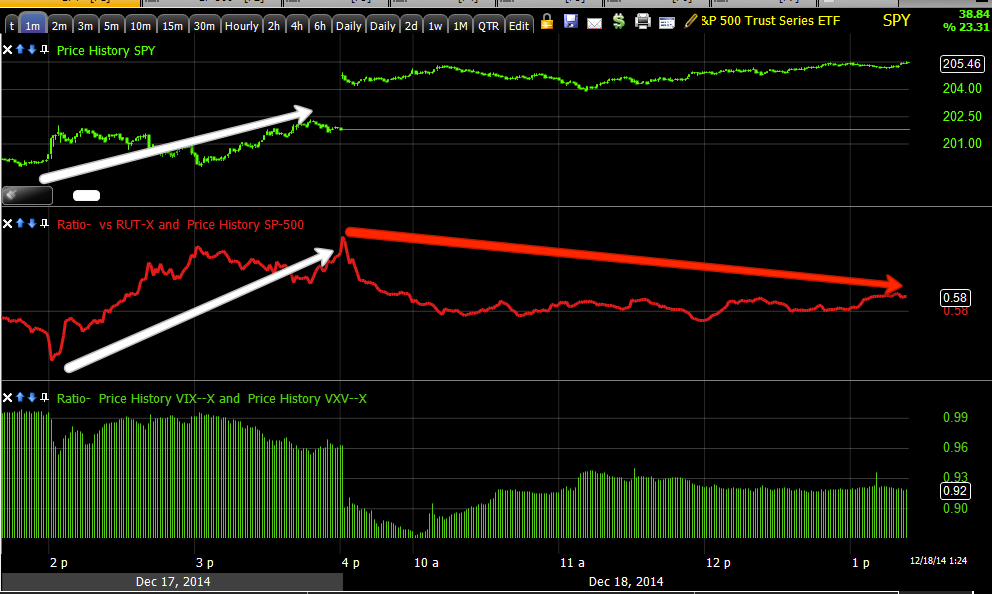
The levers have started their decline in the 3C charts , but they still have some time to go, although the VIX seems to be the least effected and probably will return to form the soonest.

As for the averages, like the Index futures they are showing the process has begun. Thus my initial impressions are more toward patience and management than jumping too quickly in to new positions, at least that's what I feel initially the morning after so to speak.

I'll be updating in smaller chunks as we go through the day and things start moving faster as it takes a while to capture and upload all of these charts and they can change quickly the further out we go; for now it should be fine, but things will start moving faster which means I need to do shorter updates with less charts. However for the moment, we need a baseline of where things stand to judge future developments against.

The averages...
 SPY intraday shows no confirmation, thus the gap up is a bit dangerous for any SPY longs here without proper intraday support.

The larger concern is the process of distribution which has started on the 2 min chart as can be seen, note the sharp leading negative divegrence in to today, higher prices are being used to advantage to sell/short sell in to them.

 The 5 min chart is ultimately where the 1, 2, 3 min negative divergences need to reach as they strengthen through migration of 3C timeframes.

Note the positive divegrence we watched for this week and the in line confirmation at the green arrow. I doubt any major break to the downside occurs before this chart goes negative.

Also while we talk about head fake moves occurring in every asset and every timeframe in either direction, I thought to point out the head fake move which is one of the best timing indications we have right before SPY headed higher.

In a larger context, the move below and above the IWM's range, the Crazy Ivan head fake, also is a keen, longer term signal for the downside reversal to continue. This is a fractal concept that can be used in any timeframe for any asset and any type of trading.

 The big picture chart that holds highest probabilities as seen above, the 30 min SPY which is deeply leading negative. If you follow price, no matter how impressive yesterday's move was, it's still part of a sequence of lower highs/lower lows, so while not in a bear market, we are is a stage 4 bearish decline from the October low cycle, thus a series of lower highs and lower lows should continue to develop which is commonly known as a downtrend.

This is why the IWM was a better asset to create a break move from as the SPY and others had much further to go and the market isn't that strong.

QQQ 1 min is in line so far.

The more important chart, the 12 min shows distribution already started

The 3 min chart shows there's migration of the negative divegrence meaning it is strengthening as we expected, so this is no surprise, but exactly what was expected, yet we have more to go as this is a process.

The 5 min chart is a pretty good picture of the entire move from accumulation to the start of distribution, when this is more negative we'll know to start taking swift action in new positions.

 As mentioned above, the intraday IWM seems to be gathering additional intraday strength so additional upside wouldn't be surprising or the steering divegrence is meant to keep IWM from falling before smart money can finish selling/short selling in to higher levels.

 The 2 min chart shows the process is underway already.

The 3 min chart shows the divergence is gaining strength as it migrates to longer timeframes.

And again, like QQQ above, the 5 min chart should give you a pretty good feel for how much more distribution needs to take place.

This "can" happen very quickly and I'll be watching for that, but at the pace the levers are deteriorating, I suspect we have more time, no rash decisions need to be made at present, patience is probably the wisest course right now.

As for the intraday breadth, there's no doubt it is lower today, we don't have the strongest small cap short squeeze seen in 3 years today  like yesterday,  so it makes sense intraday breadth is not as impressive.
 NYSE TICK shows the demarcation between yesterday and today at the red vertical trendline with yesterday easily hitting the +1500 levels and today, just above the +100 and just below the -1000, thus the look of price on a daily chart, VERY SMALL RANGES BEWEEN THE OPEN AND PRESENT PRICES, creating small body candles.

This is a bit concerning as far as taking action in short entries, but again, there needs to be more than just 1 indication and we still have room to go in the market averages, Index futures and levers like HYG, TLT, USD/JPY which is seeing some intraday weakness, likely off the earlier 1 min negative divegrence in the opening update and of course, VIX which were in the last update of futures.

 My custom TICK indicator vs the SPY, we'll also be watching for deterioration here as some has started, but again that is judging today by the sharpest small cap short squeeze in 3 years yesterday.

Levers...
 HYG's longer term trend is obviously very bearish and the market has a lot of downside to go just to catch up. You can clearly see the negative divergences at each pivot high where HYG was used as a short term ramping lever, but it's the overall HYG trend and 3C confirmation of that trend that tells us the most about the market, it's weakness and big picture probabilities.

Again, just like the SPY above, you can see a series of lower highs and lower lows in HYG, but that means to create them, a rally or ramp needs to occur, still it is most commonly known as a downtrend and where credit goes, stocks tend to follow.

HYG is strong and confirmed out to the 15 min chart so this one will need to turn negative.

The process has already started with this 3 min chart and distribution. Once again, note the head fake move just before HYG made it's move higher.

This is a momentum ignition, this is what I was trying to pass along in today's first post, but on a broader scale. However the concept is fractal and it works just as well in short term intraday charts of credit as it does in daily charts of the major stock averages (IWM Crazy Ivan downside head fake move just before yesterday's upside reversal).

Pay attention for these moves, they are often your best entries and exits at the best price, the lowest risk and the best timing as they tend to occur just BEFORE the actual reversal.

 Again as we saw in the averages above, today's gap up in HYG is seeing a sharp leading negative divegrence on a 5 min chart, thus the gap up is being used to sell/short HYG in to price strength and pretty aggressively. They took a risk by accumulating HYG to ramp the market, so they'll get the best exit they can, YOU GET PAID FOR TAKING RISKS.


TLT (20+ YEAR BOND FUND) or a decent proxy for the 30 year treasury bond.
 The 60 min chart in TLT is very strong, the uptrend still confirmed, but once again, in an uptrend it is formed by a series of higher highs and higher lows which means pullbacks such as yesterday are part of an uptrend, often making excellent entries.

This should be the continued longer term TLT trend, up, but for the short term, we could see it being used as a lever as yields which trade opposite bond prices, tend to act like a magnet for equity prices. Translation, a lower 30 year bond or TLT, a higher 30 year yield which pulls the market toward it (whether it is up or down).

 TLT shows pullback damage out to the 15 min chart, the divegrence I have been warning about for more than this week any way and we have the pullback. I will keep the 2x long TLT position open (via TBT short) as I believe TLT will return to its uptrend.

The 1 min chart shows some accumulation, but you can see there's still a ways to go.

The 2 min chart also shows accumulation as I showed yesterday, that started soon after or around the F_O_M_C announcement.

I'm going to take a quick look at leading indicators...

Again, I'd just be patient here, not make any big or rash decisions and let the market continue to tell us when it's time to make a move.