Wednesday, September 17, 2014

Daily Wrap

All in all, I could go on for hours about the F_O_M_C statement alone, but one of the best descriptions I've heard was "Double Faced". The market has been worried and discounting whether the "Considerable time" language would be removed which it wasn't, but in the press conference, Yellen essentially mad it irrelevant, explaining that everything is data dependent, so why not remove the date dependent language that was described as 6 months by Yellen at the last meeting, between the time QE ends and the time the first interest rake hikes begin which the market had anticipated to be Q3, now it's looking like the market believes January, but going with Yelen's definition and with it still not removed, it's April.

The market expected the language to be removed, at least until unofficial WSJ F_E_D mouthpiece Jon Hilsenrath predicted yesterday it wouldn't be before backing off his prediction today in saying, only the people in the rom know, yet as usual, he seems to be ahead of the curve as a completely meaningless bit of language that has the market up in arms is left in place, but explained away as irrelevant, unless it's really not.


While the central tendency of the forecasts were slightly lower growth and employment, "But still advancing", the rate out look continued to advance to higher levels, those blasted dots! Actually the dots were not that much of a news item as the number of participants seeing rising rates sooner which is mentioned above.

One thing is for sure, data dependent or not, the F_E_D isn't going to get more accommodative, they haven't even missed 1 target taper, they are moving toward policy normalization despite the double talk and mincing of words. There were a big fat two dissensions, both looking for earlier rate guidance to be put out.

If anything, the F_E_D is getting more hawkish. 14 members now see rate hikes in 2015 vs 12 in June. The median F_E_D Funds Rate is now 1.375% at the end of 2015 vs 1.1125 last meeting. While employment is "still gaining", yet has slowed and economic factors are still gaining, but have slowed, median F_E_D funds rate nearly across the board have risen, that was in fact, the only question that seemed to generate a market response through the entire press conference and a negative one at that. "Why, if employment and economic factors have slowed, have rate forecasts risen?" A more hawkish F_E_D!

In any case, if you back away from the semantics, the double talk, the meaningless (or so it seems) policy wording that is not meaningless enough to remove,  one fact is clear, this is a more hawkish F_E_D and they are not on any accommodative policy trip, they are returning to normalization which is anything but good for the market.

As for the charts, when Yellen first started speaking it seems the F_E_D's NY trading desk sent Citadel an order, Slam the VIX, it went from 13.27 before the F_O_M_C to under 12, but , as I had suspected  by the HYG divergence, the attempt to tamp the market on a knee jerk reaction backfired.

 While our minimum upside target from last Friday's "Week Ahead" post was met, the break above the SPX's downtrend which isa technical breakout/buy signal, intraday the SPX nearly saw new highs and then walked back all F_O_M_C gains despite HYG support tick for tick and a coordinated VIX slam the moment Yellen started talking.

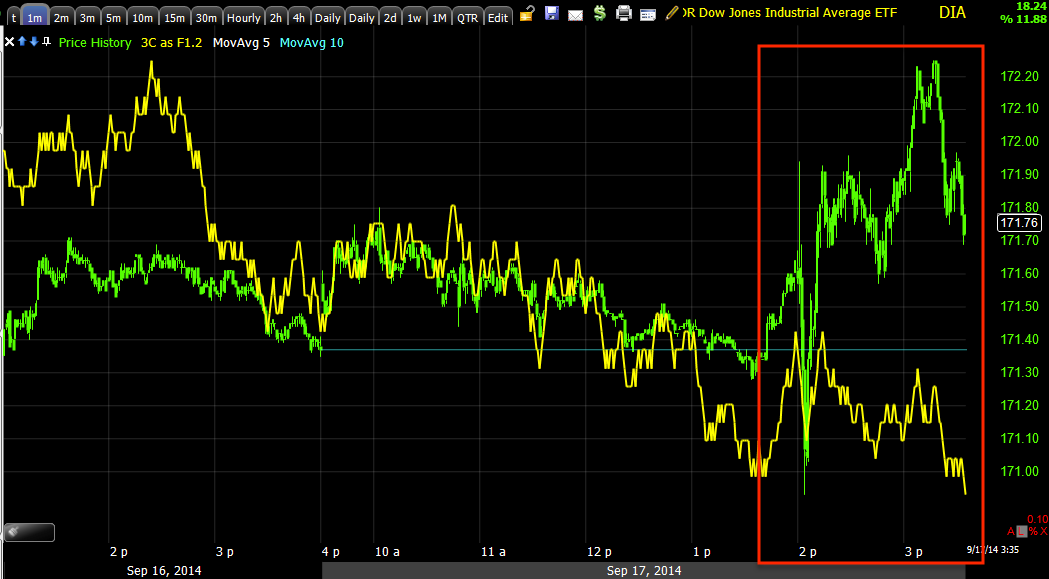
The averages on the day since the F_O_M_C looked like this...
To the far left are all 4 major averages at the 2 p.m. policy announcement, first dumped, then pumped and then dumped again giving back all post F_O_M_C gains.

Here the SPX takes a slightly different, albeit weak read on the minutes while bonds (blue) have a more hawkish interpretation.


As seen above with TLT, yields across the curve (5, 10 and 30) all gained post F_O_M_C and managed to hold a good bit of it, a different interpretation than the knee jerk up in stocks that was one of the weakest knee jerks despite HYG and VIX support, which ended losing the gains.

The $USDX reacted as you might expect. Do you recall the drop yesterday in the $USDX and me showing that happening in to a positive divegrence in last night's Daily Wrap? Well apparently there was something to that as the $USDX hit 4 year highs today.

 Yesterday's shellacking in the $USD is barely evident vs today's gain and a strong 15 min positive divegrence yesterday, perhaps there was some inside information floating about?

And this sent the USD/JPY to > $108, too bad about that Index future/ USD/JPY correlation failure, we'd be sitting on SPX $2500 right now.

As the $USD gained, we saw more evidence of the historical $USD Legacy Arbitrage relationship, gone missing for 5 years, start to re-emrge (remember, those who figure out the new dynamics of these changes of character win)...
While retail and the financial media go on about the "New Normal", another way of saying "It's different this time" during a bubble, I see the old correlations roaring back. Commodities dumped on the $USD strength today just like you'd have expected 5+ years ago before the F_E_D's experiment.

All in all the SPX gained +0.13%, the Dow and NASDAQ 100 gained +0.15% and the Russell 2000 gained a paltry +0.25%, one of the most pathetic market days, much less F_E_D knee jerk days I've ever seen.

As for Leading Indicators, you saw how HYG led tick for tick, the SPX...
 HYG (blue) vs the SPX (green).

And the longer term, as I said during the divegrence, "Nothing is going to save HYG from making a lower low.

High Yield Credit is making lower highs/lows while the SPx made the move above the channel we were anticipating. HY credit isn't manipulated like HYG short term, but be sure HYG will follow HY Credit as they can only hold these levers so long before facing massive losses.

In fact, end of day it looked like they may be giving up on the HYG divegrence long before it's due...
While realistically it's too early to say, this is the first negative divegrence in HYG and about the same time the VIX slam failed as well as TICK made lower lows. Tomorrow should be enlightening about short and long term trade direction.

 Our pro sentiment leading indicator was up yesterday in advance of today's action, but in to today, all downhill.

I speculated earlier in the week that the SPX would make a move toward our leading indication using yields, it looks like we were right on as it reverted exactly to the mean.

Now for some interesting stuff... Breadth... 

As far as a Dominant Price/Volume Relationship, the Dow has 13 in Close Up/Volume up, the most bullish of the 4 relationships, but also a 1-day overbought signal. The NDX had 45 in Close Up/Volume Down, the most bearish of the 4 relationships. The R2K and SPX had no dominant relationship at all and there wwas obviously none between the 4 major averages making it virtually a moot point.

Of the 9 S&P sectors, 4 of 9 closed green with Materials leading at +.605 and Energy (probably due to the strong $USD) lagging at -.55%.

Of the 239 Morningstar Industry/sub-industry groups, only 110 closed green.

Here's where it gets interesting... "The Percentage of All NYSE Stocks Trading 2 Standard Deviations Above their 40-day Moving Average" (momentum stocks) went up from 4.6% yesterday to 5.55% today, down from 33% in June.

"The Percentage of All NYSE Stocks Trading 1 Standard Deviation Above their 40-day Moving Average" saw a meager gain from 15.5% yesterday to 19.6% today, down from the average of 56% in July.

It just gets worse from here... "The Percentage of All NYSE Stocks Trading Above their 40-day Moving Average" made a meaningless move from 335 yesterday to 33.33% today, down from the average of 75%

"The Percentage of All NYSE Stocks Trading 2 Standard Deviations Above their 40-day Moving Average"  went from 27.72% to 27.56%, down from the June average of 60%

And the "The Percentage of All NYSE Stocks Trading  Above their 200-day Moving Average"
went from 56.65% yesterday down to 56.03% today, down from the July average of 74% and the "The Percentage of All NYSE Stocks Trading 1 Standard Deviation Above their 200-day Moving Average",  again down from 27.72% yesterday to 27.56% today.

Unbelievable moves or failure to move in breadth, despite the paltry gains in the market.

The HYG divergence is really one of the only things to watch as it has been the only real support as you have seen for the market, if that divergence has ended, we don't have much of anything to keep this facade of a market up.

Remember tomorrow we have the Scottish independence referendum and Friday we have Quadruple witching, wouldn't it be odd if either of those events created more volatility than the F_E_D today.


Post F_E_D Market Update

It seems excessively clear at this point with HYG making a 5-6 day positive divegrence, the idea was to make the August cycle's head fake move posted earlier today, yesterday/last night which looked like this in last night's Daily Wrap...
This is what the normal concept of a head fake move would look like before a downside reversal on top of a rounding top, all of this should be seen as a singular cycle off the early August lows and base from 8/1-8/8.

The reason for needing HYG? Exceptional breadth and internal weakness, underlying (3C) weakness, etc. The only real lever left as the carry trades have failed is HYG and it has not done so well for the market today as I currently don't see an average up more than a quarter of a percentage point on an upside head fake move or rather F_O_M_C knee jerk reaction.

As of this afternoon just after 1 p.m., the analysis was for such a move as posted in the previous update.

As for the initial charts I have during the post F_O_M_C and the press conference, there was a wait and see element, but tone quickly turned ugly, we'll find out how bad after the close with market internals, but during the event...


 SPY intraday leading negative as the press conference came to an end.

The SPY 5 min chart which is essentially the roof on the upside move for this week as forecasted Friday in the The Week Ahead  post is now showing a clear negative divegrence. There's only so much gas in the tank for a move on the upside with about a day (Monday and early Tuesday) of accumulation which reached the 5 min charts. As the 5 min charts deteriorate and turn negative, we have the same pivot as the Monday/Tuesday divergence, except to the downside.

 DIA 1 min intraday looking horrible.


The migration to longer charts, like the 3 min and...

The 5 min which was still in line this morning, now with a negative divegrence.

IWM took some of the worst of it with pretty sharp leading negative divergences, but it also had the most upside to sell in to.

 Showing the IWM 3 min with this week's early positive divegrence forecasted on Friday and the migration of the 1, 2 min negative divergences to the 3 min chart.


 This morning we had a small relative negative divegrence (the weakest form) on the IWM 5 min chart, you can see, since the F_O_M_C, that divegrence has grown and is in worse shape, now starting to lead negative (stronger divergence form).


The QQQ 2 min with the end of the positive divegrence in to Tuesday morning lows  and a sharper negative divegrence in to the F_O_M_C.

 There's clear migration from the QQQ 2 min chart to the 3 min chart, next stop the 5 min chart.

Thus far the 5 min is the only of the major averages still "in line", I suspect this changes soon, tomorrow.

As for breadth during today...
 The hard number count of advancing stocks less declining stocks intraday was tame pre-F_O_M_C and then was in a +1000 to -1000 range with a few outliers, but after the press conference dropped notably with -1500 and -1600 tags.

The TICK/SPY custom indicator trend shows TICK/intraday breadth slowly declining earlier in the day to a F_O_M_C pop and continuing to decline to lows of the day in to the close.

Daily breadth charts after a update should be revealing.

The MSI (Most Shorted Index) which saw a short squeeze in Russell 2000 names on the open continued to lead through the rest of the day saw a catch up after F_O_M_C and no longer had any edge for the market.

If you want to know what is moving the market, what the strongest correlation is, it's the same one that allowed us to forecast price movement in to the F_O_M_C this week, the same one that allowed us to call for an upside knee jerk reaction after the F_O_M_C and will likely be one of the key indications of near term market action, HYG...

 HYG has maintained an in line divegrence through the day with a little weakness in to the close, we'll see if that continues to deteriorate.  My gut feeling is, "If HYG with a 6 day divergence can't lift the market to something better than a quarter percent knee jerk move (often 1-2% moves), they'll abandon HYG quickly and that may be what we are seeing in to the close.

As far as actual proof of this correlation...

This is the SPY in green and HYG in red today, moving in tandem EXACTLY like yesterday, carry trades be damned.

More to come, I'm still picking through a lot of data. 

Knee Jerk Tone

The knee jerk move was as anticipated in the Quick Market Update post this afternoon before the F_)_M_C with the expectation being,

"Taking this altogether, this is something I suspected last week in the posts toward the end of the day Friday and early this week.

I suspect the F_O_M_C knee jerk reaction will be to the upside, it will be a failed move and also allow us nice entries in multiple shorts, some of which are in the area and listed yesterday.

Of course no one knows what the F_O_M_C will do or what Yellen will say at 2:30 (MAKE SURE YOU WAIT FOR YELLEN), but based on what I see thus far and being this was already a probability I suspected before this week's move higher even started, I'd put probabilities there.

The way I want to use that is to short in to those higher prices in the assets laid out and I will put out the posts as they confirm a false move or head fake.

That's my best guess at this time."

Not only is the strength of the knee jerk move surprisingly weak, the underlying tone is weak. I'll have some charts out in a moment, although there's much more to look at.

HYG remains the short term key.

Hilsenrath is the F_E_D's Leak

Yesterday Jon Hilsenrath from the WSJ sent the market higher when he said that the F_E_D, which was widely expected to remove the "Considerable Time" language which is a reference to how long the F_E_D will wait to raise rates AFTER QE has ended. When questioned during the last F_O_M_C meeting in the presser, Yellen said "Considerable Time" is  6 months. there's debate about whether this was off the top of her head in a press conference or is this really F_E_D forward guidance that maybe she let slip and might regret.

The market WIDELY has expected the "ConsiderableTime" language to be removed this meeting largely because in speeches from Hawks, Doves and Centrists, nearly all have said it's time to remove that language and update forward guidance for rate increases.

Judging by what we know as the F_E_D reduced MBS by another $5 billion today and Treasury purchases by $10 billion today, QE is set to expire next month which would theoretically put the first interest rate hike around April of 2015, well before the market's current sentiment of June 2015 or Q3 of 2015. Expect Yellen to back away from the 6 month definition for "Considerable Time" during the press conference, this is where you REALLY want to watch how the market responds to the Q&A and you'll find out some interesting information just as we did when QE 3 was introduced, but the market topped the same day (Sept. 13th, 2012) and went on to lose -8% in the months ahead and didn't regain those highs until nearly 4 months later as Bernake had inadvertently made clear in the press conference (at 2:24 p.m., can you believe I still remember it? It was that big at the time), that the F_E_D was changing their yardstick or at least moving toward a change from quantitative guidance based on dates to qualitative guidance based on incoming information, but  much less certain and the market hates uncertainty. That is exactly why the market topped after QE3 was announced on the same day at 2:24 p.m. as Bernanke accidentally or perhaps purposefully, let that cat out of the bag. The point is, listen to the press conference.


More to come as there are a number of small items that are lost in the shuffle that mean a lot to the bigger picture.

I just want you to catch the press conference and watch carefully.

Pre-F_O_M_C Update

There have been a couple of more dramatic negative shifts in some of the averages, but my opinion in the last post was based largely on concepts that have shown to be high probabilities and HYG, the concepts are what they are and I don't see deterioration on the scale in HYG yet, that would give up market support.

None of the carry (JPY based) trades are connected to or are supporting the market at all.

AUD/JPY vs ES/SPX futures...
 Total disconnect as AUD/JPY heads higher and Es lower, this is in line with intraday TICK data / market breadth.

HYG (red) continues to remain supportive of the SPX/market broadly short term.

The MSI is drifting lower with the market, although outperforming, it's not lifting anything.

 Price tone in most of the averages is in line with the cautious intraday breadth/TICK although we did see a panic move to the downside at -1200 which is not that bad vs some of the historic intraday lows seen over the last week or two.

 based on this move forecasted Friday for early in the week, pre-FO_M_C, the TICK/SPY custom indicator shows a natural rate of deterioration, there's only si much gas in the tank on a 1-day divergence and without outside influence, this would and may continue to deteriorate on pace with the size of Monday's positive divegrence.

 SPY 5 min is looking a bit worse than anticipated since earlier charts this morning.

We did see a strong leading negative move out of character with the leading negative divegrence at the red arrow, pretty much specific to the SPY.

 The 1 min intraday SPY chart shows a small intraday positive divegrence which we have seen some support from.

 The QQQ intraday 1 min shows stronger intraday support.

While the IWM seems to be seeing heavier profit taking.

Still it is the HYG divegrence that matter most at this point and it's just not seeing rapid deterioration.


Quick Market Update

Looking around for any possible leak of embargoed news, as we have found them before, although rare (news networks already have the F_O_M_C policy statement, this is how they have instantaneous reaction as they've read it long before us, although it is embargoed, however I would suspect it wouldn't be that hard to get some newbie at the station to get the gist of the statement out for a handsome fee, in fact the BLS built a new media center to rectify exactly that problem, in building the media center they had admitted embargoed information was reaching trading firms before the official release) What I see looks like a couple of things: on a 3C basis of the averages, it looks like the natural decay of the Monday/Tuesday morning accumulation for the move up based on a deep oversold breadth environment last Friday (the same scenario as last Tuesday with a 1-day oversold event in breadth that rallied Wednesday, although I have said from the start I expect this to be bigger than last week's based on HYG's divergence and of course the probability of a head fake move taken with the possibility or likelihood of an F_O_M_C knee jerk reaction-all concepts that are typically seen except of course the HYG divergence-which is a divergence, not a concept) first lets look at that.

 Intraday the SPY looks worse as it should as the natural decay/distribution from a day long positive divegrence only has so much gas in the tank. From a breadth perspective, very little of the oversold condition was worked off as of last night's data.

 SPY 5 min seeing about the expected rate of decay or negative divegrence migrating to the 5 min timeframe. So far this looks like the analysis from Friday for early this week "IF" it were in a bubble devoid of outside influence like the F_O_M_C.

The Q's with their positive divegrence Monday and early Tuesday morning and a natural looking negative divegrence in to the bounce. if we can call it that.

And the IWM 5 min chart with a relative negative divegrence (the weakest form), meaning the IWM lagging yesterday wouldn't give much reason to sell/short in to higher prices so it's seeing that today.

SO far, nothing that looks like a leak of the F_O_M_C.

On a different concept, the head fake one which I have drawn , talked about and posted numerous times over the last 2 weeks with last night's daily wrap showing this chart to get an idea of what one would look like, as they tend to be excellent timing indications just as longs jump in, shorts cover, they tend to reverse to the downside creating a boatload of momentum, which is behind the concept, "From failed moves come strong reversals"

 This was posted yesterday and last night, the "Igloo with a Chimney", the igloo representing a real reversal process or top and the chimney representing a false breakout that fails and gives the downside reversal momentum as shorts are forced to cover on the move and longs jump in to be caught in an eventual bull trap, thus increasing downside momentum which I suspect is one of the reasons (other than creating demand and supply) we see them so often just before a reversal  (80%).

 HYG's divegrence has deterioration, but not as much as I'd expect by this time.

In fact...
 HYG (red) supported the SPY/market intraday as it was moving lower along with the MSI.

Here's te intraday move lower from a TICK perspective with a -1200 reading so some serious selling there intraday, likely F_O_M_C nervousness as I see VIX futures were bid at the same time.

 The TICK trend continues to deteriorate...

And MSI holding up better than the SPY today, also giving support pre-F_O_M_C.

From this perspective, it looks like a head fake move as drawn above is probable as the initial F_O_M_C knee jerk is dependent on the market reaction, not the actual news so some HFTs hitting the ask can create an upside knee jerk if that's what they want until the F_O_M_C language sets in, thus the fade of the knee jerk reaction.

However, while HYG is manipulated short term for stuff like this, general HY credit is not and it is not looking good.
 HY Credit vs. the SPX

And while this is a new indicator for the site, VIX Inversion and SPX/RUT Ratio, it has been pretty spot on...

The July top has a negative SPX/RUT ratio (red) signal at the yellow area to the far left sending the market lower in to our 8/1-8/8 base where the indicator fails to confirm a new low and is divegrence as well as 3C positive at the base sending the market up in to the August cycle. Since however as we have been in stage 3 , there's another clear negative divegrence in the indicator.

Taking this altogether, this is something I suspected last week in the posts toward the end of the day Friday and early this week.

I suspect the F_O_M_C knee jerk reaction will be to the upside, it will be a failed move and also allow us nice entries in multiple shorts, some of which are in the area and listed yesterday.

Of course no one knows what the F_O_M_C will do or what Yellen will say at 2:30 (MAKE SURE YOU WAIT FOR YELLEN), but based on what I see thus far and being this was already a probability I suspected before this week's move higher even started, I'd put probabilities there.

The way I want to use that is to short in to those higher prices in the assets laid out and I will put out the posts as they confirm a false move or head fake.

That's my best guess at this time.