Tuesday, December 4, 2012

So far, we're on the right track

Closing out leveraged (options) positions that had short exposure (AAPL Puts and FAZ Calls) seems to have been the right call this afternoon as it was not only near the lows, but so far the Futures are moving off the 3C divergences, here's ES...

 ES 1 min with the 4 pm New York Close in red.

ES 5 min positive divergence leading at a new high, price is approaching today's regular hours highs.

So far, the indications are on track, it will be very important to see how the indications play out, whether we see a big gap up or even a decline by pre-market tomorrow morning.


Initial Thoughts

As I look around at a lot of different charts today I notice a few things, there's some strength in price in certain risk assets, particularly some of our leading indicators, but look at the underlying trade and the impression of strength quickly gives way.

Then we have some underlying trade in some short timeframes of the major averages that show mixed underlying strength, Equity Index Futures like the S&P and Dow Futures show short term (5 min chart) strength in underlying trade, but the longer timeframes are in bad shape with no improvement.

First I'll show you the charts and then give you my initial impressions, underlying trade tomorrow, whichever way the market moves, should provide a more definitive answer IF my theory or initial thoughts haven't already played out first.

The charts starting with some leading indicators...
 This is High Yield Credit vs the SPX on a 1 min chart, HY Credit diverges from the SPX and it gives a signal just as it did on the 30th and the 3rd the SPX dropped. HY credit went positive today, it also had a very sharp, very fast move to the upside near the end of the day, this is suggesting a move higher in the SPX and probably very soon. Still I'm struck by how quickly, parabolically HY credit moved at the end of the day, it gives me a feeling of a thin market without much beef behind it to support higher prices for very long.

 JUNK credit also put in a positive divergence today, this would also point to the SPX moving higher and likely tomorrow, however note that JUNK credit didn't approach the highs from late last week (red lines).

 High Yield Corporate Credit also put in a positive divergence today, all 3 forms of credit point to a move higher in the SPX/market , note though how HY Corp credit did surpass last Friday's highs and then backed off at the close.

Because HYG is fluid enough, we can use 3C on it.

 Here's the HYG 5 min chart it's in line as credit move up, but over the last several days HYG is seeing distribution, it looks like HYG is set for a move higher, but also set for a fast exit upon lower prices.

 Here's the 5 min chart today specifically, we see some past divergences that worked out perfectly, today's 3C indication is distribution so not only longer term, but shorter term as well. Again, it appears HYG longs are set for a quick exit if need be.

 Yields are like a magnet for the SPX, yields are negative and suggest that over a longer term period (defining a longer period as perhaps as short as 2 days or even less).

 TLT-Treasuries have been seeing safe haven flows as the market has been moving lower the last couple of days-think about that 20+ point decline in ES over 1 day (that's huge).RSI with ROC applied (red) seems to be supportive of TLT.

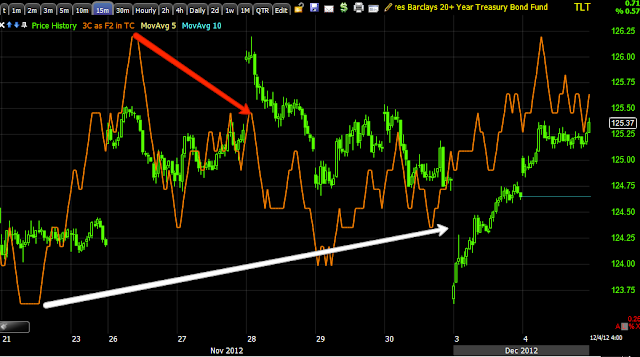
 The longer term 15 min chart of TLT also looks supportive, this would indicate that on a longer term, longer than the 1 day or so of upside credit is hinting at, TLT is strong which suggests there has been a flight to safety already set up, the players are already in place anticipating a move down in the market. I know this is getting a bit confusing with credit indicating what I believe will be a short lived move up in the market and Treasuries indicating a move down in the market as soon as the credit implied market bounce is over (again I'm thinking this could be a day or maybe even less-of course this is still a best guess until we have more supportive data).

TLT shorter term on a 5 min chart, say similar to the ES 5 min chart (the two are exactly opposite, which in this case means confirmation as ES is positive on the 5 min-"risk on" and Treasuries are negative recently on the 5 min "risk on" both confirm each other).

A quick look at a market average-the SPY...
 The 5 min SPY chart is positive in to a decline off Monday's gap up opening highs, again, like credit and Treasuries, all suggesting a near term move up for the market-this is what I was seeing and why I wanted to lower any exposure to leveraged short positions in the very near term.

 The SPY 3 min chart, again a very short term chart, has put in a strong leading positive divergence, but it does not have time on its side. In other words, the SPY looks like it's preparing for a sharp move higher, but since there isn't a large accumulation base (only about 4 hours) any such move would have a hard time sustaining itself for more than a day or so.

The long term chart of the SPY with the highest probabilities and able to sustain a longer move can be found on several timeframes shorter than this, but this 30 min leading negative divergence points to the size, duration  and intensity of a move lower this chart could support.

Now pulling it all together, the SPX and NDX Futures...
 The 5 min ES (SPX) Futures show a nice positive divergence, still it's only about a day long.

 The 60 min ES trend was positive at first and moved the market higher, since then though we have a leading negative divergence, just like the SPY longer term charts, again able to support a large, stronger move lower.

 The 5 min NASDAQ Futures show a positive divergence as well in to the lows today, most of the real leading was done this afternoon, in other words it's a strong positive divergence in intensity, but not in duration.

The duration comes in on the NASDAQ 60 min leading negative divergence.


Putting this all together (and remember this is just a theory, but if we get confirmation tomorrow you will understand it without a long explanation and be able to act on it), intense moves typically start with intense reversals, for instance a large trend higher starts with a large and intense head fake move, the same for a trend down, it starts with an intense head fake move usually to new highs or some important area before reversing.

What if the market were to show a lot of strength either most of tomorrow or for a day or so and then have the rug pulled out from under it sending us down on a longer, more intense short term trend? We would likely see the negative divergences in to the move up very early, giving us a chance to position ourselves before the reversal.


All of the charts above support this theory, or course it's not the only theory that could be supported, but it does work in this instance. This could set up some great positions while everyone else is being pulled in to a bull trap.

One more thing that we might consider, the F_E_D's POMO operations, tomorrow they are set to purchase 4.25 - 5.25 billion in longer dated treasuries, these will likely come from Wall Street banks who can quickly deploy the capital as we have seen in the past. However the NY FED is conducting another operation two days later, but this time they'll be doing the opposite and selling $7-$8 billion in short duration treasuries.

I'm not sure if this has anything to do with it, but as of tomorrow it is possible the banks could deploy several billion dollars in the market and 2 days later have to pull quite a bit more out, this could be the catalyst for an initial move up followed by a larger move down.

Again, this is theoretical, but the charts do support many of the assumptions laid out. Once more, if this is the case, we should see distribution in to strength fairly quick while the market moves higher allowing us to set up trades well before the market reverses.

I'll keep you updated on any changes in the overnight futures that may change the scenario.


MCP Update

I actually still do like MCP, however I want a more stable opinion on the market (mostly regarding tomorrow and the rest of the week). I have a feeling MCP is going to make a move higher, but I suspect we can remove some draw down and get a better price point.

The market can do 3 things tomorrow, go up, go down or sideways. Certain charts look like the market goes up (say tomorrow), there are gaps that could be filled, there's still a range in a lot of stocks that can be used for a stop fishing expedition. If the market moves up tomorrow, my main concern is that it doesn't hold it, I'm not putting this out as what I think is most probable because I'm still gathering that data, but if it did move up failed to hold it and then moves down aggressively as many charts still indicate, chief among them the longer timeframes in ES and NQ, then there's significant draw-down risk, but there's also significant opportunity to add or re-establish a position in a stock like MCP around the $6.50-$7 area.

 60 m MCP with a nice positive divergence, but it has lost momentum and it has lost what could otherwise be a continuing positive divergence at this consolidation area between $8 and $9; that's a little concerning.

 15 m. MCP also with a nice positive divergence, but again (and this is a shorter timeframe that moves easier), there's a lack of a continuing leading positive divergence in what is otherwise a wide range, almost a bull flag or pennant.

 The 5 min chart is showing a negative tone, not horrible like, "MCP moved up and smart money is heading full force for the exits", but more like preparation for a constructive pullback. The head fake move yesterday also doesn't fill me with confidence as it is a common marker or timing cue for a reversal move.

 Here it is again on the 3 min chart, note there is NO positive divergence here, only a leading negative. If there were accumulation I'd expect to see migration through these intraday timeframes, it doesn't take much to move a 3 min chart.

The 1 min chart does have a decent positive divergence, I think it is most likely one of two things: 1) preparation for a very fast, short lived pop up that may fade within an hour or so, like an opening gap or 2) the start of a positive divergence that migrates through the longer timeframes.

All things considered and at least in the scenario in which the market makes a quick move up tomorrow, followed by a devastatingly sharp move down, then I'd want to be looking to pick up MCP down in the gap-maybe $7 or so. If MCP continues to build a positive divergence off this starting block, then there's plenty of time to position long here, however I feel that this positive we are looking at which is only a 1 min chart, simply isn't enough accumulation to do much of anything with on the upside other than set up a head fake move. This timeframe is along the lines of a market maker. I'd rather take a $1.50 (assuming MCP can be bought again at $7.00) and collect another $1.50 or more on a move higher.

This 1 min chart simply isn't enough on its own and there's not much in the longer timeframes to support a move higher from here that can hold.

If you are holding MCP long and we do get a gap up early in the a.m. tomorrow in the stock, email me and we need to look at it quickly, it may be a good exit and then be patient and wait for it to set up again. The reason I say this is the 1 min chart's positive, but the fact it isn't enough to hold much so I'd suspect if anything, a gap that is almost immediately faded.


Initial Market Thoughts....

Since October, the signals have been good, we traded long and short Financials the same week in mid-October and were right on the money in both, switching mid-week. Then we had an expectation of an accumulation range that would develop, it did, it even started moving up on November 16th, but as it did, pullback signals became clear everywhere we looked, for me the instruments that were used for this pullback move were AAPL Puts which were closed today for a decent profit after having been down last week some 30%, but I stuck with the signals and even added Friday and it worked out very well. Yesterday's trade made sense, things were moving very nicely toward a pullback, all indications were pointing that way (or at least I didn't have any serious doubts), then today somewhere around 1 p.m. or so, some very strange signals started developing quickly, many are no longer visible in the averages, but in futures they sure are. I'm not sure what they mean so I want to reduce exposure unless I feel I have a good edge to base a trade off, AAPL was a good edge, it took a little more time than I wanted, but it worked.

Here are a few of the charts that developed today right around the time the New York F_E_D conducted a Permanent Open Market Operation (POMO) for between 1.5 and 2.25 billion, there's another tomorrow for $4.25-$5.25 billion. Because the F_E_D can't directly participate in Treasury offerings, they buy them from the banks in the secondary market, the banks can and have in the past, taken that profit almost immediately and drove stocks higher during QE1, but especially QE2.

I don't know if that is what is going on here, the F_E_D will also be selling short dated treasuries in other operations on other dates, here's the schedule.

While the stated goal is Maturities Extension (buy long data Treasuries and sell short dated), it doesn't look like the operation is 100% sterilized (meaning no new money enters the system) and who's to say the banks can't use the money quickly in and out  of the market. I really don't know the answer, but I'll be looking for clues and hints.

Today alone may not have been enough to warrant taking action to lower risk, but many assets like AAPL I was already moving out of before these strange signals developed and fast.

I'll show you a few and then where I really found them to be both accurate and strange, in the Equity Index Futures.

 AAPL 5 min chart was moving perfectly in a negative fashion, today it started seeing n intraday positive divergence, it's still in leading negative position, but this is a 5 min chart that saw decent activity.

 The reason I feel fine about being short AAPL stock rather than options right now is this 15 min chart is horrible, AAPL should see a massive decline based on this and an equity short is not going to produce andy significant draw down risk, timing isn't an issue, time decay isn't an issue, I believe you short AAPL and wait for this signal to be fulfilled, you have a nice AAPL trade.

 The 1 min chart was acting better than it should, I didn't say good, but better than it should. This could be some small time support to keep AAPL range bound, it also could be some support for a move to fill a gap higher, I don't know, it did deteriorate very quickly late in the day. If AAPL sets up again for a Put position and it looks very high probability, I'd love to see everyone make 30% or 115% like the last AAPL options trade; the last two have been successful because we have been patient and demand a higher standard in the signals.

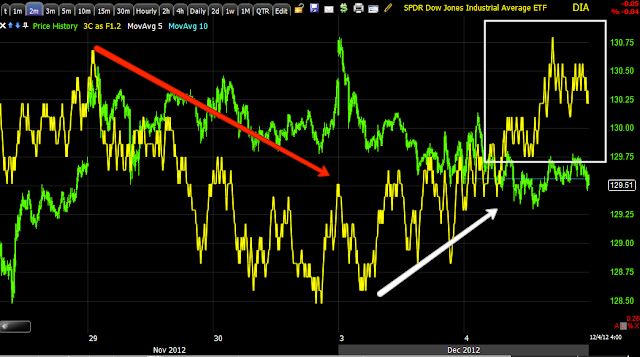
 The DIA 2 min chart was moving in the right direction, yesterday's positive divergence wasn't that big, it wasn't much of a concern, but when it started leading today, I have to back off a bit and see if this is a one day event or the start of a bigger trend.

 DIA 3 min saw a leading positive divergence as well, so there was migration across the timeframes, not good. There was late day deterioration, but was that the typical end of day profit taking, traders going flat overnight or something else?

Until I can answer that question, I must warn you and encourage some caution.

 The IWM 1 min looked horrible, especially next to some of the other charts, this is why I felt ok with a put position there, among other charts.

 The 2 min was initially concerning as it hit a leading positive divergence, but that went negative and the timeframe before it, the 1 min (which is where any changes to the 2 min would show up first) looked bad.

 There are a lot of negative timeframes in the IWM, but with a 60 min negative like this, that's some serious damage that I don't think can be repaired without a pullback, if they don't want to own the IWM up here and are distributing, why would that change unless price created a new dynamic?

 QQQ 1 min initially caused a little concern, this isn't that scary of a positive divergence on its own, but with some of the other averages and stock, it takes on a different hue in that atmosphere.

 The 3 min didn't see the strength some other 3 min charts saw and in fact went leading negative, this is part of the reason I also felt ok with short exposure in the QQQ.

 This 5 min chart became a bit concerning as well earlier, but it finished the day pretty close to in line, had it led to the upside in the last 15 minutes, I couldn't get warnings out fast enough.

 QQQ 15 min almost demands lower prices as it leads negative.

 As  does the 60 min, there are only a few averages negative out to 60 min, this is one.

 The SPY was especially concerning with a leading 3 min positive divergence this still suggests a decent mov higher in the next day or so.

If that be the case, then flattening out risk makes sense and re-entering at better prices on strong signals is smart trading, these are the kinds of signals 3C can give that give us an edge that most other people have no way of knowing, all they see is price kind of consolidating.

 A leading positive 5 min on the SPY as well and remember, most of these developed after 1 pm, so in many cases what you can't see on the chart (only in real time) was how fast these divergences were building up, that was pretty scary.

Here's the REAL trouble; the 5 min S&P Futures 3C chart.
 This is a clear negative divergence from last week, one of the reasons I liked the idea of adding some shorts Friday including AAPL Puts and FAZ calls, look at that negative divergence at the highs of ES, which had already been showing a negative tone last week, now move forward to the present...

 ES fell 23 points so far the last 2 days, that's a signal that worked VERY well as that's a big move for ES, however if that signal worked so well, then what of this 5 min leading positive divergence today?

Here are the charts in the same areas for the NASDAQ Futures...
 This is last week and in to this week's high, negative...

And NQ falls sharply this week, but puts in a rather large relative and leading positive divergence.

These two charts are the most concerning for the very near term (like tomorrow). While I may not have all of the information yet, I can't in good conscience withhold information like this from my members because I can't completely explain or understand it. The signal is there and that's enough for me to warn.

There were some other indications I didn't like today such as credit, yields, a few currencies even though there were reasons, I thin leading indicators on their own would have caused me some concern, throw in the above, it looks like something is shifting quickly, maybe this is just a bounce to fill some gaps and we see a very bad move down , but I want to have those signals in hand. We can always re-enter a position, we can't always undo damage that we didn't move on.

The last thing that was bothersome is I didn't and still don't know to what extent these signals are in the market, I need time to look through a lot of charts.

So while I do not like making rushed calls with little information for you, I must warn you when something is off. This may all work out as expected and this may be a blessing we don't even realize yet, but there are many other things it could be as well. We trade the highest probabilities, not guess or play a market version of pin the tail on the donkey.

More as I uncover it.


IWM Dec 83 Puts and QQQ Dec 66 Puts Added

Still on the fence with AAPL, I prefer no leverage until this becomes more clear, perhaps an equity short, but for now I'll wait it out and see what the closing stats look like.

Short exposure is pretty much represented in these two puts for near term trade.

Some new positions

I know this sounds a little chaotic and it is, but I'm going with the signals as they develop. I do like some short exposure to IWM, perhaps puts or a 2-3x leveraged ETF.

The same is true of the QQQ.

I am on the fence with AAPL, instead of leveraged positions there I'd prefer an equity short.

More as it develops, this is very fast moving.

Positions Staying Open-Equities

Other than Core shorts, for now the SQQQ 3x leveraged short QQQ will stay open, SCO will stay open (2x leveraged short oil).

For now the GOOG equity short will stay open.

AMD Long will stay open.

FAS 3x leveraged long Financials will stay open (this is why FAZ was so heavily leveraged with calls).

For now, TNA long will stay open.

ZNGA long will stay open

AMZN short will stay open

UNG long will stay open

MCP long will be closed.

Other positions I will decide as the data comes in, there are some very fast changes, they are still shorter term, but they are out of character so until I understand what this is about, I want to lower exposure, keep long exposure in certain areas that was meant for the intermediate up trend.

I'll explain more as the charts develop and if they hold.

Options Model Portfolios are flat

The bulk of the short exposure for the short term move down was in AAPL puts and FAZ calls, I just closed the last of the AAPL puts so there are no open options trades.


Lowering Short Exposure Except Core Positions

I'm lowering short exposure on leveraged trades, ETFs, puts, etc across the board, except the Core shorts for now and keeping long positions as the larger intermediate trend is long, which should come after a decent move down, but I don't like the way some of these charts are developing on the positive side and there was a POMO operation by the F_E_D today at 1 p.m., there's another tomorrow as part of the Securities extension program, while I can't say that money went in to the market, I can say that is what use to happen with POMO during QE1/QE2 so I want to be in a more neutral place with a bias toward the long side for now, shorts can be added if the signals are there at even better prices so there's not much harm there, but until I understand what this is, I want to flatten out with a bias toward quality shorts (Core) and long positions.

As any are added/closed, I will post them.

I'll also post the charts and fast change in character that is driving this move.

AAPL Puts

I only kept a small position in December $580 puts, the rest were closed and will be re-opened as soon as I see the set up.

I have a very low tolerance for pullbacks with highly leveraged products. If this were an AAPL short equity position I probably wouldn't have made much of a move, maybe cover a little to try to add back at better prices.

Depending on the correction and position size, I might take 50% off the table in a 3X leveraged ETF like FAZ, but with options and that kind of leverage plus time decay (not that ETFs don't have their own challenges), I have almost no tolerance for a correction, I'd rather re-establish the position after the correction.

AAPL positions closed or partially closed...
 Almost 31%

 A small loss of 2%on the position, as far as overall risk, it represents .17 %, not even 1/5th of 1%.

This is the one I kept half open just in case.


I'll try to get some AAPL charts up as well, I haven't changed my views on AAPL at all (just tactically).

Also Closing about half of AAPL Puts

For now

Follow Up-SPY

In the last market post, "We should see soon" I explained the mechanics of a reversal including a head fake move. These concepts can be put in to practice on any timeframe and in any risk asset that you think there are enough technical traders following (if it's a 30k share a day stock it's a lot less likely to attract their attention and that is what is needed).

Of course if you use these concepts in different timeframes, you obviously need to scale them to that timeframe, but the concept holds true for any risk asset, this is just how Technical Analysis has been turned on its head and used against traders. If you look at a Technical Analysis text book, what just happened shouldn't have happened, but it's so common place now that we actually use it as a timing signal.

The divergences in the Futures as well as the market averages also helped, in fact I wouldn't have been looking for this triangle if I had not known underlying intraday trade was shifting.


The SPY now...
The red arrows are what Technical Traders expected, since we already had a head's up from 3C, we expected some game as most reversals see this kind of head fake. The yellow area is the head fake where traders commit, the white area is where they are at a loss and starting to cover.

I need to keep an eye out, but this also helps explain FAZ which I will post charts for momentarily.

Closing FAZ Call

I'm closing this with a small gain, maybe 1-2%, but I see a pullback coming in FAZ (short Financials), if I was holding FAZ equity rather than options, I'd be tempted to hold, it's near term intraday pullback signals, the longer term and intermediate term still loo great. I might close half an equity position and try to add it back at lower prices.


We should see soon

If the last market update is correct or not, here's an example of the triangle I mentioned in the last update and how the setup works...
 On a 1 min SPY chart we have a clear downtrend, a symmetrical triangle found within a downtrend is considered by traders to be a consolidation/continuation pattern meaning it should break in the direction of the preceding trend and continue lower (typically the target is the distance between the last consolidation and this consolidation). Traders look for confirmation in price to enter trades so a break below the triangle is the confirmation they would look for to short the SPY and volume did pick up right as that happened.

Now the way Wall St. manipulates technical traders because they are so predictable, they run the move down, get the shorts in or the longs to sell on a stop out and then push prices back above the triangle which according to Technical Analysis tells traders it's a failed price pattern and they should reverse their trade, so now you have the shorts covering (adding to demand and pushing prices higher, which causes more shorts to cover) and longs see upside momentum and look to buy (adding more demand and upside pressure). Smart money can use all of this demand to sell or sell short in to at better prices with sufficient demand to move positions the size of theirs.

This doesn't have any bearing on the short term trend, it's just the intraday noise and manipulation of the market and traders, it's just how the game works.


Since the early morning positive divergence in the EUR/USD, it has seen several negative divergences and even the first break to the downside saw a move higher in to another negative divergence, but to traders all they see id the Euro holding up and stocks looking cheap comparatively.

Market Update

Remember earlier I said I wouldn't write off the positive divergences in the short intraday timeframes, well I think we'll see a move on those soon.

 ES is in a leading positive 1 min divergence

As is NASDAQ futures.

The EUR/USD is in a negative divergence, but it just hasn't broken down yet and the market hasn't moved to price in the higher EUR/USD.

I also see a few triangles within the intraday downtrend, they;d make for a good short term bear trap on a break below with a move back above.

I'm not changing any positioning and may find some opportunities in this, but I think probabilities are good for some upside intraday.