Friday, May 24, 2013

Mopping Up

Earlier today I closed half of the remaining UNG position, I saw a few things I didn't like very short term so I went ahead and took another half of what was a full size position after having already taken some off the table as it was an oversized position, the gain on UNG was +12.25%, but this is largely to do with averaging up, for instance the ooriginal position was probably near a 35% gain, then more shares were added and more shares were added so the original position if left at say $5,000 would be up 35% or so, but after adding several times as the trade worked in our favor (You want to average up your winners and never average down your losers unless that was part of a phased in plan before you entered), the dilution caused the overall position's gain to be lower, but all in all for the portfolio, money that wasn't doing anything was earning 12% or whatever the amount would be, so while it may seem like adding made the overall gain less, it didn't, the overall gain of actual profits in the portfolio would have been much higher with $22k in shares at 12% than 5k of shares at 35%($4800 in profits vs $1750 in profits).

The SCO position gained a paltry +5.29%, but I see other services blowing the horn over a 5% gain so I  guess it's not that bad, the important thing was to reduce risk in a volatile and near term, uncertain situation. I chose SCO so I could ride out corrections and follow the trend rather than using USO Puts, however it just seemed to me at this point, why risk anything here.

I put out a lot of options trades today, but I'm not a fan of options, it may not seem that way, but that's the truth. Right now the Equity tracking portfolio is being used to set up the longer term equity shorts (that have an advantage over Bear/Short ETFs) as you can see by this article I wrote probably 6 years ago, "Making More Than 100% in a Short", as most people think a short position's profit is limited to 100% and that's if the stock goes to zero, this article shows that is absolutely not true and shows you why and how you can make more than 100%.

The point is, as I have warned as we keep moving forward for months and more specifically since this week's nasty Key Reversal Day, Volatility will be very high.

As a surfer there's something called, "Going Over the Falls", typically its just missing a wave you have paddled for, but being so close that you can't back out and as the wave has crested and is breaking, you literally can be 10 or more feet above the smooth water in front of the wave and you are turned over and in to this white water monster as you go "Over the Falls" (sometimes you actually caught the wave but just lost control very early).  This is very intimidating to look down and see a 10 foot drop that you are about to become a part of, it's when a lot of surfers get hurt badly and as an example for the market, traders as well.

Wall Street wants to put as many traders as possible in to the situation of going over the falls where you are tossed around like a rag-doll in this huge circulation of white water, you have no idea which way is up and even letting your body go limp and hope to rise to the surface as you can literally swim toward the bottom thinking you are swimming for the top, won't work as the force of the wave and the circulation have you in a situation in which you have no idea which way is up. *As a side note, the worst is when this happens and before you can find the surface for air, another wave runs you through the entire process again. I've been in this situation in which there's been a half of a second of air between getting knocked around in tight sets of waves and the next wave coming-this has happened to me with probably a half dozen waves consecutively.

The point being, Wall St. is setting up the same situation. I don't like leverage and most of the longer term trending trades that we are setting up or have in place, have no leverage at all. However, I'm a believer in taking what the market gives so long as you do it responsibly and sometimes you need the right tool for the job. With this volatility and moves being very short and extreme before they are thrown in a different direction, options allow us the profit potential that would otherwise not be there on a great trading signal.

So today I offered a lot of these trades, but they are just a short term tool for the situation at hand, not a reflection of anything changing other than volatility.

Today being where it is as the global stock markets are hammered is a tough enough situation, add Op-Ex pins on top of that and Carbon based traders leaving early today fro a long holiday weekend and we have a very unique situation. I believe computers were used today to do some basic tasks that would otherwise look more familiar to us as traders can make decisions on the fly that computers running a program can't.

I might figure out exactly what happened today and how after looking at a lot of charts, but it seems to me that the Friday Op-Ex pin was in place, usually by about 2 p.m. or so most contracts are closed and the market can start being itself. I notice in a lot of areas that there seems to be intraday (market maker/specialist or an HFT) 1 min or so negative divergence to run prices down in to the later afternoon hours and as that happens we see accumulation of a larger nature around the same time.

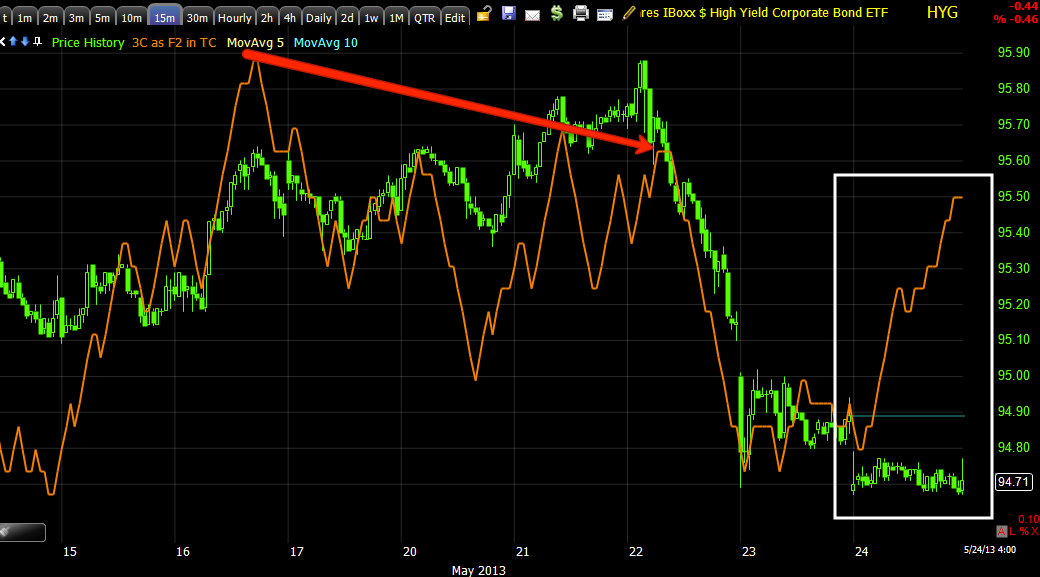
I have several examples and I know VXX and TLT (2 of 3 SPY manipulation/Arbitrage levers) played a part, exactly what , why and how is not clear yet, but they didn't want to use the third asset, HYG, it was steady and seemingly under constant accumulation all day.

I won't lie, today was a strange day like I haven't seen, at least not to my recollection, but I think the signals are the same, even though how we got to them is still unknown.
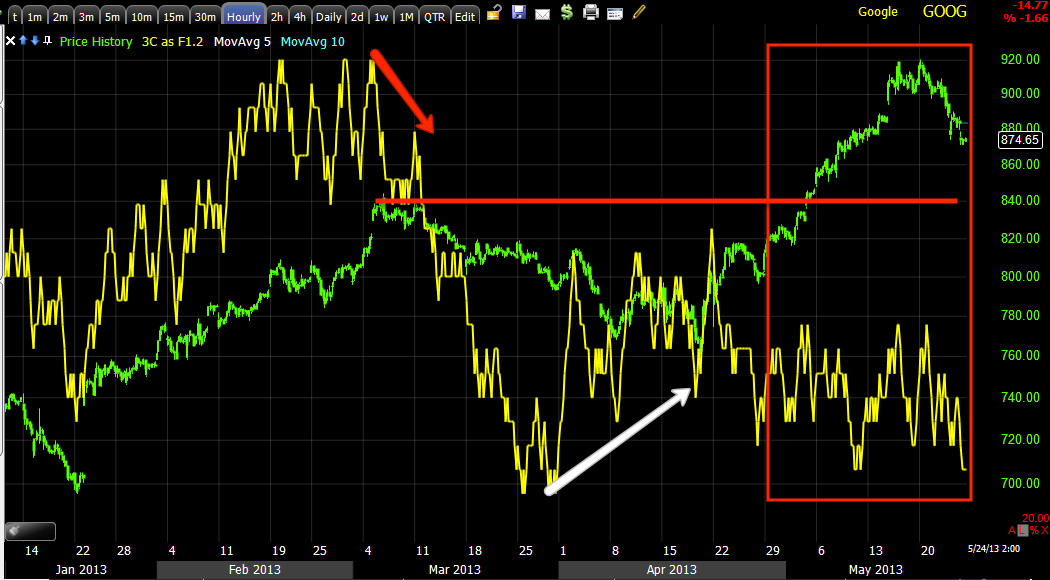
GOOG
 GOOG with a tell-tale flat range where we most often see accumulation or distribution depending on the preceding trend (accumulation in this case). Smart money places orders to be filled with the market makers or specialists that represent that stock and they try to fill right at VWAP, this is one of the reasons we see such a flat range as the middle men work the market to accumulate in a particular range.

 2 min chart showing accumulation all day

1 min chart shows a stronger divergence once GOOG broke support on a head fake move, something I posted I wanted to see as to see the result, here it is, increased positive divergence on the head fake.

Most tellingly, the size and timeframe of this divergence-10 min and developed fast in a day, says there was some heavy underlying trade.

SLV
 SLV heading lower off an intraday negative divergence

 The big picture though is a leading positive 15 min chart, this is why I chose AGQ long rather than options.

HYG
Look at HYG's typical movement over recent weeks.

Today's flat range is not at all the normal character for HYG, an asset that would need to rise to help the SPY rise through the arbitrage relationship.

Again, we keep seeing these 5, 10 or even 15 min 1-day leading positive divegrences, 15 mi's leading positive like above in a single day represents heavy activity.

 10 min chart confirms as well.

And the intraday gets a boost as HYG finds the lower end of its range in the afternoon.


 IWM
Another 15 min positive, it doesn't look like it, but look at all the movement for today only.

Here's a closer look, something is going on here.

Look at the 1 min chart with the biggest 3C move of the day  right as many support areas were broken throughout the market and after op-ex pins wouldn't matter.

AMZN
 Another leading 10 min

And look how sharp the confirming 5 min is.

AAPL
AAPL even saw a late day uptick in the 30 min

Also seen at the same time on the 10 min

And look at the dip in AAPL around 1:30, again one of the strongest 3C moves of the day.


More coming later or over the weekend, I have a lot to look at, but I think we are on the right side of the trade, at least for this short term trade.


Long Spec. URTY 3x long IWM

Taking VERY Small AAPL Calls

Opening AMZN June $260 Calls

SPECULATIVE

TLT Hint

TLT is seeing a VERY sharp 1 min positive that is s ending it higher, it's almost as if the clock hit a certain time and short term/intraday accumulation of TLT began which sent TLT higher, this would send the market lower, but these are intraday signals only. Perhaps sending the market lower to the head fake region, if GOOG continues to accumulate and other do the same, we have a very unique situation and the bounce would still very much be on.

GOOG Canary Follow Up

GOOG broke support, we have a potential head fake move as we were looking for, it broke $871.22 with $871.03, so far the 1 min chart, the first to show it has accumulation and GOOG is moving higher, possibly confirming the head fake move.

HYG positive divergences/Accumulation Seem to be VERY Steady and Positive

GOOG-Canary in the Coal Mine

GOOG is just about to break intraday support-the head fake move I was looking for, at $871.22.

We have very little time for real serious accumulation, but if GOOG breaks that level and shows heavy accumulation, then we know for sure that the theory of the last post is right on.


Going With Some XLF June $19 Calls

SPECULATIVE

Market Update

I can't quite put my finger on ally does, but this is far from business as usual and the carbon traders are now firing up the BBQ in the Hamptons, let me  show you and what I "Think" might be happening...
 SLV 1 min is finally heading the direction intraday 3C was pointing, this is why I chose AGQ-this is the exact reason.

HYG is in a range, it has been holding steady all day with a 5 min leading positive divergence.  I'd say with the absence of carbon life forms trading, it seems like the computers have received instructions to just keep buying at a steady pace that won't drive assets up too much, but its steady enough that most are holding up.

 IWM intraday should pullback, maybe it will, that would likely mean that Tuesday would have to be further accumulation beyond what is there, or that IWM is about to break down badly, I think we get the bounce first though.

IWM 15 min shows a very clear leading positive divergence all day today with out the pullback that we normally would see that kind of buying in to. Computers can't make all the decisions, they just do what they are told and if there has been a steady bid all day under IWM, that explains no pullback and a leading positive divergence, suggesting Tuesday is indeed the bounce day. This is unusual behavior, but I'm leading toward it.

 XLF-Financials 3 min seeing the same...


Financials 10 min seeing the same.

I usually don't like to take trades without them coming to us, but there are a few I will consider, please consider the risk, that these are short term trades, they aren't the larger positions, just some extra cash hopefully so please treat them that way in position size and risk management.

Going with AGQ Long Equity for a Silver Play

I'm not convinced on the short term SLV charts to take on the leverage of an options play, but this 15 min SLV chart has me pretty confident of SLV making a move higher, AGQ has 2x leverage, but any draw-down waiting for the move to unfold is not going to be significant and I can ride it out in AGQ whereas an options position would be a nightmare.

The chart...
I'll probably take about 2/3rds a normal size position, leaving some room to add and some room for drawdown if it comes. That's a 15 min chart and the kind of divergence I don't ignore-ever!

HYG Charts

Remember that HYG is a necessary component in the SPY arbitrage to support the market, HYG up with VXX and TLT down is a positive SPY arbitrage the algos will buy.

Since HYG doesn't have the kind of beta necessary for me to take the chance, I need leverage, for institutional money they have huge leverage on HYG and it is huge liquidity. Since 2008 banks have been selling their credit exposure so for any decent size hedge fund looking to put on a credit position with some diversification, it's almost impossible to find the assets as the banks have been wiping them off their books, along comes HYG, the institutional trader's "Risk on" position of choice and a very easy way to express a position in credit with some diversification in Corp. Credit without looking for enough bonds with 10 different corporations and HYG is SUPER liquid.

I entered now because we are close to the hour when the market moves outside the op-ex pin with most contracts closed and HYG's range has been attractive, I'd rather buy on a break below that range, but I don't have the time-maybe I can add.

 2 min- this is enough to keep this range in place

5 min positive looks like heavier flows and I doubt they are retail

15 min again, same thing, but the longer charts or even these show HYG is damaged beyond repair, this is a fast bounce trade, hit and run, in and out.


Entering HYG June $94 Calls- They're about $.99

Charts coming

Entering Spec-Size GOOG June $870 Calls

This is for a bounce trade only, as soon as GOOG makes any higher highs, I'd be using that strength to add to the Equity short for the big picture and perhaps a put position for the shorter term view.

XOM

We also entered/added to XOM short a few days ago at the top, I think it too will bounce, I'd like to add more if I have room on any strength, once again this is a position I'd feel comfortable as a new position adding maybe 1/3 of the intended size as it is a strong bounce candidate, on price strength, 3C weakness I'd add the rest of the position. Longer term charts suggest XOM has significant downside.

TJX Core Equity Short

I'll be looking for any strength in TJX to fill out the core equity short position, but it is not one of the better looking bounce candidates.

If you are interested in TJX, I would have no problem opening a partial position (short) right here, just make sure to leave room to add to it and a wide stop, which means fewer shares. We don't average down as a way to get out of bad positions, we average positions because we like what we see and want exposure, but think there's still a chance to add at a better price, the main difference being is that phasing in is planned in your risk management before you take on the first share whereas dollar cost averaging is throwing good money after bad in an attempt to reduce the overall cost basis to get out of a losing trade. These are winning-good looking trades that we are just leaving room because of market volatility.

I'd be comfortable adding up to half here as a new position as a full size position.

Also Taking SCO Long Off the Table For now

Taking Half of UNG current Position Off the Table

It is because of these two charts. Even though I look at UNG as a long term play, with these divergences, I'd rather not take the chance and have some extra dry powder right now.

I still like UNG, but will be looking for a lower price to add back shares.

 UNG 10 min, you can see what bothers me...

As for timing, UNG 3 min, obviously what bothers me is clearly visible.

AAPL Update

AAPL is a tough call right here. The charts don't give the impression of a bounce, but it's such an obvious lever needed to help the QQQ/NDX as AAPL's weight on the NASDAQ 100 is approximately at last known verification (as NASDAQ weighting schedules are proprietary, but you can get a membership to NASDAQ to find out the weight for a mere $10,000 a year) 20% of the NDX's weight, that means if you took all 50 least weighted AAPL stocks and combined them together, AAPL would have the same weight on the NDX as those 50 stocks combined. Theoretically if you took those 50 and AAPL and called it the NASDAQ 51, those 50 could be up 2% on average and if AAPL closed down -2.1%, the NDX 51 would be red for the day even though 50 of 51 stocks closed up.

 1 min AAPL chart suggests intraday pullback

so does the 2 min-perhaps AAPL gains a positive divergence during the pullback?

The 5 min chart is even negative, but resistance which is pretty clear and the psychological $450 level make for a nice magnetic target.

I'll keep you updates as best I can.

TLT, HYG and VXX

TLT looks like it will see an intraday bounce, that is good for the SPX/market pullback I'd like to see, perhaps the gap just needs to be filled first. All the longer term and intermediate charts for TLT look good as well, I'm surprised not to see at least some weakness in the early timeframes for a market bounce, but I will remain patient with that one for now.

VXX charts 1 min look like a pullback, that may be the gap fill in the SPY, at 2 min intraday they look like they'll see a little upside, that may be the SPX pullback to the bottom of the range I'd like to see. I do not see this as worth trading (these timeframes). The 3, 5 and 10 min are pretty much in line-the 10 is a bit more positive, this would be as expected for a market bounce. At the 30-60 min VXX is leading positive which is inline with the market breaking down even harder after the short term bounce. This will be a trading position, but first we want the bounce in the market with VXX discounter, that's where we want to buy VXX, UVXY or VXX calls.

HYG needs to go up to support the SPX bounce, I believe it will and this may be worth a short term call. Even though I'd prefer to see if we get a market pullback to the bottom of the range giving us a better entry in HYG calls for a short term bounce play, I have to say, HYG looks interesting right here.

I will be patient though and wait at least for an intraday new low in HYG-head fake and if it is confirmed, I'll look to enter calls in HYG for the bounce play. ***Remember all of the positions for the bounce play are very speculative and should be treated as such when it comes to risk management and position sizing.

This is a way to give us some extra gains, but this is by no means a trade of any length, not even swing, it's hit and run.

 HYG 3 min is positive in tis area, small, but positive with the price trend looking as it should-watch for the downside head fake to enter calls/long.

 10 min shows HYG's probability, a decent bounce, not near enough to overcome the significant downside damage.


Intraday, HYG is in line with 3C, I'd like to see a break to new intraday lows with a 3C positive divergence to enter a spec Call position here.

Remember you have to be nimble and available to close these trades.

GOOG P/L and charts

I expect a short term bounce in GOOG as it will draft the rest of the market, might as well take the Put profits, open the funds up to other positions and re-establish the Puts at a better cost basis when the bounce is ending. You'll see why I leave the equity short, which will suffer very little draw down, open.


At the $22.50 fill, the GOOG puts made +15%.

The short term 3 min chart has a positive divergence and the tell-tale flat range we see with accumulation/distribution.

The longer term 60 min GOOG chart shows a large head fake move, which usually is scaled to the expected reversal as well as the preceding trend, so this break above resistance was a head fake move as you can see solid distribution throughout, it was purposefully planned as you can see the accumulation needed to send GOOG higher. Smart money sells those accumulated shares in to higher prices and exits any remaining risk then enters short positions.

The bounce in the context of this chart is irrelevant, this is why the GOOG core equity short stays open and maybe is added to if the bounce is decent enough.

Closing GOOG June $890 Put

I'll re-open it later, the GOOG equity short stays in place.

Quick Market Update

The Yen is still negative, hasn't come down so much yet and there are some contradictions intraday I'm trying to piece together, it may be op-ex related, it may be something else like a move starts earlier. We will not enter anything that isn't high probability with all that it means, not just higher probabilities, but a good trade set up considering price, location, risk, etc.

In any case, here's what we have so far.

 Yen negative getting deeper, a pullback in the Yen should send the SPX higher, but the SPX in my view needs to base around yesterday's lows, maybe even make a head fake move below yesterday's lows before it's in trade-able position.

I don't see how the SPX can do this "if " the Yen pulls back intraday- OR perhaps the Yen builds a larger negative divergence that is set up for the eventual bounce.

Timing of the bounce becomes important, I was initially thinking that not too many traders will want to carry long risk over a 3-day weekend, but with the pros already out of NYC, most of this action is going to be retail and I don't think they think like that, they think, "Tuesday's have seen the Dow up 19/19 consecutively so I want to be long today for a Tuesday run".

In that case, we typically see the market freed up from the op-ex pin after 2 pm when most contracts are settled. That could be the time for a move to start and would give retail the urger to go long with limit orders over the weekend for the majority that work 9-5.

The SPY...


 1 min looks in line still, the Q's and IWM have slight intraday pullbacks, but not very strong.

I'm looking and hoping the market moves back to the range, if institutional money was operating today rather than driving to the Hamptons, it probably would and a head fake move below would be a great set up, but retail isn't going to do that, that is done to retail by smart money so that's an open question.

5 min shows the range that we look for with accumulation and that we look for as part of the "reversal process"-it's decent size, but it could be bigger".

Bottom line is that I will try to determine what is most likely, but any trades have to be worth while, not just gambling on a "most probable" hunch, we need real, hard evidence and a good set up. I'd rather miss the move than take an irresponsible trade that is based on greed and emotion than facts.

If you are interested in seeing a beautiful head fake move, check out IOC today, one of our shorts and I'm glad to see the HF move.

More on Dr. Lumber

It was just a few days ago I showed you the new Doctor in town, not Dr. Copper, but Doctor Lumber and showed you what has happened vs. the SPX.

I was forwarded this article this morning that deals with several issues that CNBC has been pushing like stuffed Teddy Bears at the Carnival, namely homebuilders and the "Recovery in housing".

There's some good information here I didn't cover, but the thrust of the article that was written yesterday (after we had already seen Doctor Lumber's warning). The article starts off and then the first bold print is in this statement...

"However, there is one eye-opening concern that does not support Chairman Bernanke's position about a housing recovery, and unfortunately points to less demand in the immediate future.  While many investors do not track lumber prices, the chart below demonstrates the sheer bear market that has befallen lumber futures prices."

Here's the rest of the article from BigTrends, perhaps some weekend reading and further proof that while it may not make the market swing intraday, when we look back, it will look very obvious and everyone will be a genius pointing to this data, but few are willing to consider it when it matters most. I hope you consider it.


Quick Market Update

I'll use the Q's as an example, the Yen looks to be making a head fake move right now higher, it has had a strong uptrend overnight, it doesn't matter the timeframe, the reason for head fake moves is the same and it applies to all timeframes.

Here's the other side of the view from the market, you saw the Yen, now I'll use the Q's as an example, this is short term trade only...

"A" Yesterday's negative in the QQQ was reason enough to close the AAPL calls and take a small gain, but 5% for a few hours is still a nice gain.

"B" QQQ is seeing some intraday accumulation with a new leading positive divergence just starting, this fits with the intraday charts of the Yen and USD/JPY as seen in the last post.


The 5 min chart of the QQQ shows horrible damage done/distribution as the QQQ makes a head fake move higher on the minutes day a Bernie first says what the market wants to hear and then under questioning contradicts his opening statement. Don't think it was a head fake? Well not in the typical sense of clear resistance traders would buy, but in the momentum chasing sense with no positives to back it up and the NDX hitting 12.5 year intraday highs, traders will buy that.

You can see what happened next, , now we have a relative positive divergence on the Q's, remember the divergences usually start with a relative (weakest), then grow stronger, then move to leading positive and we typically see a head fake move (this would be to the downside, under obvious support, a price pattern or moving average that would be obvious to traders- then we should get a bounce.

I've been asked what will the bounce need to do, how far will it need to go to accomplish its goal, these are not corrective bounces, these have a specific reason and goal. At first I thought it would need to be very strong to shake out new shorts, but the market is overwhelmingly bullish still so it's not so much about shaking out shorts as it is justifying to longs they were right to "Buy the Dip", so maybe some strong momentum, I don't think it needs to be as psychologically impressive as the longs/bulls are already pre-disposed to believing in buying the dip, they don't need any extra convincing, so just enough to make them say, "Ah, see, I was right, Buy the Dip still works".

This will help lock bulls in to this mentality on ever increasingly larger downside moves, they'll look at it as, "Last time we had an ugly day down, I nought it and it worked, so this even uglier day down is an even bigger opportunity".

This will lock them in to buying lower lows until they realize they've lost a 50% retracement of the move from 2009 lows, then they panic and sell en masse, by then their assumptions that all things stay the same will have done them in.

Bottom Line- I think there needs to be a move strong enough to give them gratification, but since they already believe they are doing the right thing and it will work out, they don't need as much evidence as it would take to shake shorts loose, the fact is there just aren't that many shorts out there so the psychological warfare doesn't need to be as extreme when the opponent is already buying what you are selling-literally.

Yen Looks Like Market sees Short Term Support-Bigger Picture Here Too

First lets go back and look at yesterday's Yen/SPX correlation, a lot of people didn't believe this was a valid correlation or made any difference, it's amazing how people need immediate intraday gratification and miss the big picture, the big opportunities, it's what I called, "Getting Lost in the Lines", missing the forest for the trees essentially.

Yesterday's correlation, perfect...
 Yen in orange/SPX in green on a 1 min chart of yesterday to 4  p.m., that's a nearly perfect 1.0 correlation.

Fast forward through this morning...
You can split hairs, but no other currency correlation is so high, this in part has to do with the "Carry trade" that is Yen based through multiple pairs going south and getting more expensive or even causing losses at leverage that can be 200:1. This is how institutional money ramps up leverage of their AUM to try to outperform, but leverage cuts both ways.

Now the reason I say the SPX/market could get near term intraday support and the bigger picture-this doesn't mean the "Far off picture", it's here, it's just the big picture we have been following, it's the real opportunity in this market that may be once in a lifetime.

 Yen 1 min intraday is starting to show an intraday negative signal after moving up on Nikkei weakness all night.

This would suggest intraday support/strength for the market.

Yen 5 min also shows the same signal, not big, but enough for intraday support.

Remember the Yen and SPX move opposite.

Yen 15 min, showing the right side of the rounding bottom, remember last week I said the rounding bottom was more than halfway complete? This is the right side as it moves up and punishes the carry traders.

****Yen 60 min is a perfect example of several of our concepts 1) A reversal is not an event, it's a process, note the positive divergence through the base. 2) Head fake moves occur in 80+% of all reversals on every timeframe. 3) Head fake moves are some of the best timing indicators we have for a reversal if we know the base is real from 3C accumulation. Remember right after I said the base was more than halfway finished, the very next day the Yen broke support for a day under the yellow trendline with 3C accumulation, that was the head fake move confirmed by 3C, right after that, they Yen started to move up on the right side of the rounding base.

 Yen 4 hour large leading positive divergence, we already knew from this chart that the Yen would head higher, this is why I wrote Currency Crisis Part 1 and 2 back in the middle of April, it was apparent way back then that we'd see a big change in the market and the Yen and $?USD would be at the center of that change. I wrote this LONG before the Yen correlation became as obvious as it is now, because I knew the Yen was the central currency in the Carry Trade.

The $USD, also addressed in the articles has broken out of a major base since then and made new highs!


This is the 1 min intraday $USD/JPY which was slammed overnight with the Nikkei, the index followed the $USD/JPY wiggle for wiggle.

Now the pair look to head higher intraday ONLY, confirming the Yen intraday signals and suggesting market support.

We'll keep an eye out for opportunities here.