Friday, July 12, 2013

AAPL Call Position Update

I'm glad I opened the position, it is up 9% as of the close, what swung me was the fact that a 5 min positive divergence would never be able to lift off to the upside, distribute and get ready to turn in an hour so that meant to me it has to reach in to Monday for AAPL.

As I have showed so many times before, however a divergence ends at the close, it almost always (90% of the time) picks up where it left off the next day, even over a weekend.

This still leaves me with a likely more difficult longer term scenario as to whether to close or hold the AAPL equity long. Bookmark this post if you like, but I can nearly guarantee the 10 and 15 min charts that were worse today than yesterday, will be worse by the time this call trade is over and that may swing me to take at least partial AAPL off the table.

For now here's the close in AAPL.
 This 10 min chart was in line and thus presented to issue as to whether to leave AAPL long equity position opened or closed or partially closed as there's a decent profit in the position entered 1% off the absolute lows (now up +7%). It's not just the 10 min either anymore, the 15 min joined the 10 min. today, any short term bounce is probable to make the negative in the two longer charts worse.

But for now, enjoy the gains. AAPL is an unique trade, it's already in a bear market and is making what I have suspected for well over a month to be a bear market rally, these are some of the strongest rallies in any kind of market.

 The 5 min chart not only has a brilliant 5 min positive, but the flat range is perfect as well as confirmation.

The 3 min sows the positive as well as the actual spark to launch at the second arrow.

I would just warn to not judge the open too quickly as the 1 min ended out of line, that makes the opening Monday likely to be a bit weaker than where we are now, but it should certainly jump,p back to good status and finish out what could be a +20-30% position easily.

VOLATILITY, VXX, UVXY & Some Leading Indicators

The Leading Indicators are incidental, I needed the layout to get the relative performance of VXX / UVXY VIX short term futures over the last 3 days so I just grabbed some Leading Indications while I was there.

Those first...
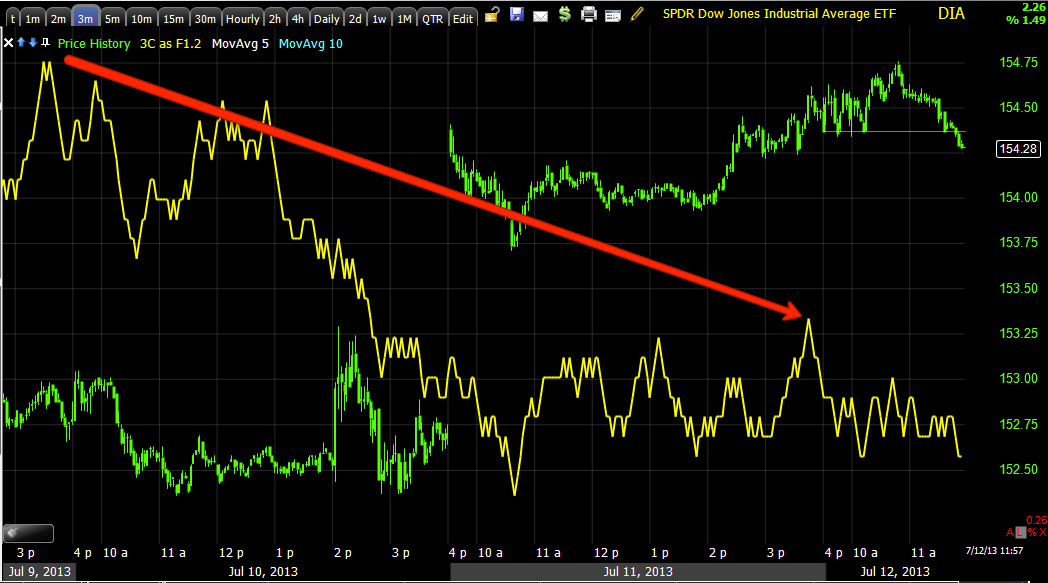
 This is just a "relative performance" chart of HYG/SPX, but there's a distinct change in character to the negative side for both.

 This is where the highest probabilities have always been , sometimes we focus too much on the little lines right ion front of us to see the big picture, this is a leading negative indication in Credit that is the highest probability on a daily chart of the market following credit lower.

My "guesstimate" is that the SPX will likely hit at least <$1525 before the first significant correction.

 As I always say about yields, "They are like a magnet for the market until the two reach reversion to the mean and short term that is in the white boxes, otherwise yields tend to pull equities toward them as already happened as yields were above equities last week.

This is the FXA or ETF for the $AUD, if you saw last night's "Carry Trade " post, then this chart of FXA will probably make some sense.

The main take-away from last night's post would be how suddenly the AUD/JPY went from accumulation (over 6 weeks) to very sudden distribution starting (as far as I noted) early Tuesday, although other sites say the carry trade ended after Bernie spoke, I have proof in last night's post that there was something Tuesday morning already at work, perhaps a leak?

Whatever it was, it was serious enough for them to change their minds VERY suddenly and sharply.

Here's an example...
 AUD 60 min with nearly 6 weeks of accumulation suddenly reversed this week

The 30 min chart shows less history, but more detail, the accumulation was up until approx. 7/8, then as you can see again, quickly shifted leading ZH to post, "The Carry Trade is Dead", that was just based on price, we saw indications about 2-days before.

 And the 15 min

The practical effect on price of the AUD/JPY was this...
Rounding bottom (accumulation) to flat out selling.

This is what I was really after-VXX/ UVXY... I've held off on calling out a new position not because of the probabilities, that's not a concern at all, the timing is.

The last 3-days the VIX short term futures have shown better relative performance than their correlation with the SPX, it's a bit difficult to see here, let me zoom in on today and perhaps you'll get a better sense.

 Today's better than expected relative performance, in these instances with volatility/protection, I believe these differences are a matter of real supply/demand issues. Either way, this is bullish for VXX /UVXY and not so much for the SPX.

 UVXY trend (2min) has been fine, it's tactical short term timing, today as you see added a significant upside move in 3C.

VXX 5 min- again the probabilities are not in doubt for me at all as the 5 min chows

The 15 min lends more credibility and I think this is a huge upside move based on 3C.

It's this intraday action like today's 2 min chart which has stayed my hand from calling this out as a position or add to, but we are now shaping up and not just here, but market wide.

I Will Open AAPL Call

The expiration I picked was 6/20 and strike $425 CALLS, this to me is like a day trade, it also is a nice hedge, I think the move is probable and worthwhile.

A Likely Move For AAPL

"If" this were the end of day I'd be considering buying next week's AAPL calls (weekly) for a short term (likely day trade) move, after that, depending on what happens with signals, I "may" consider closing some or all of the AAPL long even though I still love it as a longer term (meaning swing trade + - maybe a few weeks) counter trend trade.

The only difference between now and yesterday (between definitely leaving it open and considering closing at least part) is the degree to which the 10-15 min charts go negative, if they move enough then I think the probabilities to re-enter the AAPL equity long at more favorable prices while eliminating open market risk and opportunity cost starts to make more sense and changes the dynamics.

 AAPL 3 min positive, I'd almost consider buying that weekly call for a day trade here, if we were at the close with this exact scenario, I would.

AAPL 5 min, the reason I don't is I don't know what the AAPL divergence looks like by the close, if it still looks like a good chance of a short bounce.

This is setting up a scenario though where taking some off the table in the AAPL long position might make more sense.
 The 10 min chart will almost certainly only go more negative in to any quick bounce as it allows a chance to sell/short in to strength and more demand.

The 15 min chart is now also starting to take on negative tones where it wasn't just yesterday.

This in no way changes how I feel about AAPL's upside prospects and the long equity position, it just is more of a tactical matter, strategically I still feel confident AAPL has more, much more upside to go as poart of a bear market (for AAPL) counter trend bounce.

HYG / JUNK Chart Updates

This is one of the main things I've been waiting for within the intraday timeframes, Junk credit which trades nearly indistinguishable from HYG (price), but is not an arbitrage asset so has no real manipulative value, has been showing signs of distribution much earlier, I feel HYG has been held together on intraday charts as a function of SPY arbitrage (as we saw the market needed it Wednesday (over $1 differential for a flat SPX close). I believe Credit will lead a downside move or put a different way, have better/ earlier relative performance.


 HYG 1 min intraday saw a very small positive 1 min divergence at the same time I mentioned the market averages were showing an intraday positive. As far as that intraday positive for the averages, to me it hasn't really performed to expectations, perhaps that's just as of yet, but remember it is a 1 min divergence, the damage done to 2, 3 and 5 min intraday (some 10 min intraday) is the real story for me rather than an intraday divergence on a 1 min chart.

HYG 3 min is some of that damage I'm talking about.

HYG 10 min is a rather large move for intraday, this is in the institutional timeframe

Even a 15 min intraday leading negative divergence, it seems there's been quite a bit of strong underlying activity in HYG today.

REMEMBER THAT THE POINT OF LAST NIGHT'S POST WAS THE VERY SUDDEN DECISION TO ABANDON A FX TRADE THAT HAD BEEN ACCUMULATED FOR NEARLY 6 WEEKS, MUCH OF THE NEGATIVE DAMAGE HAPPENING IN THE LAST 2-DAYS ALONE, THIS IS THE AUD/JPY AND IT HAS BEEN (AS SEEN IN LAST NIGHT'S POST) CONNECTED AT THE HIP WITH THE SPX.

Something seems to have happened around Tuesday morning that changed minds and it's not an insignificant change.

 JNK-Junk credit that trades like HYG has shown 3C weakness earlier in the week, it has no arbitrage value so there would be no short term ulterior motive to support it.

JNK 15 min

DHY is lower volume, significantly lower so intraday charts are choppy, but the 10 min above is one of the first timeframes where trends are more visible, it seems here too there's been negative underlying sentiment.

"Credit leads, stocks follow"

HYG Fill $93

Again I could not get a fill at Aug. $91 so I finally did get a fill at Aug. $93

Charts coming.

*Also we are nearing the time when most option contracts that are expiring today are settled, the market tends to free up from the pin around this time and move more freely.

HYG Put Position

The HYG Put Position I thought I had entered yesterday apparently didn't fill, I noticed as I was watching HYG and then thought to add to that Put position (August $91 Puts) that yesterday had not been filled.

I will open an HYG August $91 put right now.

For arbitrage value this is bearish for the overall market and as a leading indicator it is the same.

I'll get charts up, I did post some earlier charts today HERE

Market Sentiment

Pretty simple...

"Bullish Sentiment on StockTwits is at its highest level in 2 months and now sits at 55% "

Intraday Charts

This looks to be FX oriented, it may be pin oriented too. The 3 min damage is done, it has migrated and that is what I was looking for, this seems to be intraday, it may set something up, I'll be looking, but still looking for a stronger edge.

 This is the DIA intraday 3 min damage I was talking about.

DIA 1 min looks like its going to bounce

IWM 2 min is the damage I was alluding to taking place, but as far as a bounce...

IWM 1 min looks also like it's going to bounce intraday

QQQ 3 min, again the longer intraday trends are moving like I've been waiting for.

But short term it looks like a bounce is coming intraday.

SPY 3 min has seen damage intraday

Again the 1 min looks ready to bounce.

This may be the cause...
AUD/JPY 1 min

Intraday Update

I'm still not ready to commit to anything yet although there's been a lot of near term improvement.

I was just looking at the AUD/JPY and 3C looks like an intraday bounce, I checked the averages and the same, intraday bounce. I wanted to get this out quickly, but I'll post charts.

Credit is seeing Distribution

This has been more of a short term (Lever), but one I've been watching for, HYG intraday distribution.

Yesterday and the day before I mentioned JUNK credit was already seeing this distribution, Junk credit trades almost exactly like HYG, but since it's not an arbitrage asset, it sometimes has a more accurate signal.

Now HYG is following the lead that was apparent in JNK a couple of days ago.

I'll take a look at Leading Indicators in a moment, but it looks like all of the short term timeframes I have been waiting for before entering anything too serious are now starting to come together pretty quickly this morning.

 HYG 1 min saw strong distribution as a lot of other assets at the same area this morning

HYG 2 min

HYG 3 min at the same location this morning.

HYG 10 min is a bigger and much more important timeframe.

Here's JNK
This started earlier- 2 min

JNK 3 min leading negative divegrence

JNK 10 min.

This is a significant signal

Market Update

I said yesterday I was waiting for the short term charts to come in line, they are starting to surprisingly on a Friday (Op-ex). I already showed you the Q's, I figured that was more AAPL related, but apparently not.

 DIA 1 min has been one of the worst performing the last couple of days as far as underlying trade.

DIA 2 min as we saw yesterday

DIA 3 min

Now finally the 5 min intraday is seeing migration


 SPY 1 min

SPY 2 min

SPY 3 min

SPY 5 min