Tuesday, February 25, 2014

Daily Wrap

Today was more evidence that there seems to be a concerted effort to keep the market within a range, to be more specific, to support the market to keep it in that range. Today's closing prices (all averages closed red by a fraction) were exactly in line with yesterday's Dominant Price/Volume relationship, Price Up/ Volume Down which is usually a short term overbought condition and the most bearish of the 4 relationships with the market usually closing lower the next day, but it remained pretty much in the range.

We saw very early today the USD/JPY test right down to $102 as the market opened, 10 minutes before that the Index futures that had sunk lower all night had been ramped up just enough to produce an open exactly at yesterday's close until the USD/JPY losses and test of $102 that caused a lower open.
USD/JPY (candlesticks) vs ES (purple), you can see clear intervention defending $102 and Index futures / ES.

Today's pattern was similar to yesterday, I suppose you could call it a pump and dump...
SPY 1 min chart of yesterday and today's pump and dump.

HYG was used as a lever of support again today and again TLT saw a flight to safety and Yields are severely disconnected acting as a magnet that is going eventually (I think shortly) pull the market down toward them.

 Longer term Leading Indications using TLT (light blue) vs the SPX (green), right now there's a flight to quality TLT has acted as a leading indicator which is now suggesting a move to the downside in equities.

 Yields also fell more today, they act like a magnet for the averages.

Here's the extent of the dislocation, it's quite severe.

I don't think the pump and dump is over yet, but we know what they are doing, the same thing we are doing and before it becomes obvious to the retail crowd they'll be done...
 This late day positive divegrence in the QQQ tells me they aren't done with this pump and dump pattern yet, but there's serious damage done so I don't think there's too much time left...


Damage...
 60 min SPY

60 min IWM

30 min QQQ

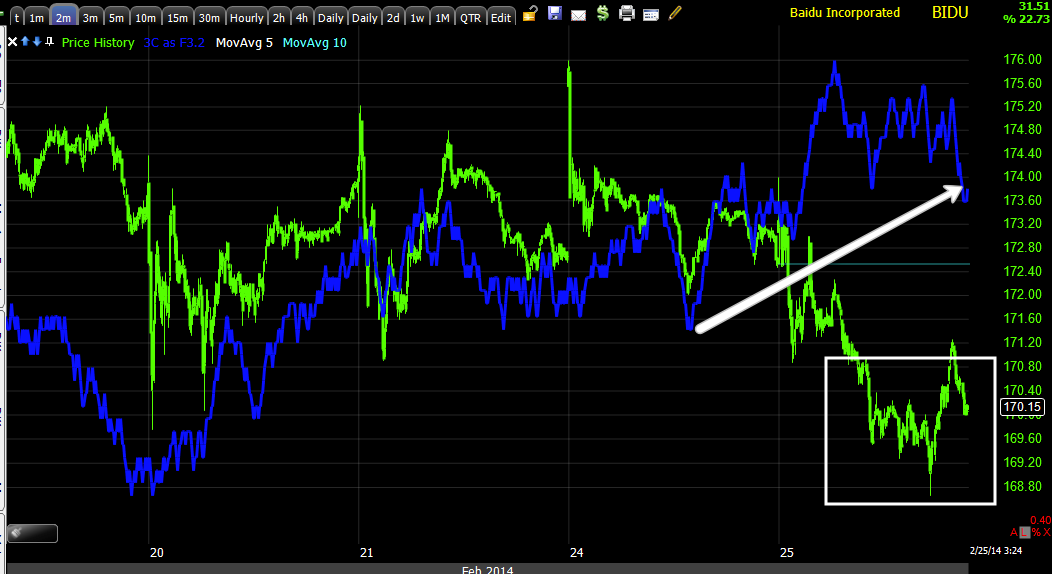
I say use it while you can, it looks pretty clear from the charts above and this morning's test of $102 that we aren't going to be up here too much longer (also note the near perfect rounding top.

The Dominant P/V relationship today was close Down / Volume down which has the least influence, but it is the hall mark of a bear market or the relationship most often seen during a bear market.

I'll check on futures later and see if anything has changed, at this point I think they'll try to pump and dump one more day from what I see which is what my opinion was earlier today, however after seeing how quickly USD/JPY fell to $102, I wouldn't be surprised if the market just takes over to the downside, that was a pretty violent move in premarket today.


Quick URRE Update

URRE, like UNG (almost as long as UNG) has been a long term favorite for a primary bull trend irrespective of the market. Like UNG it's still in a very long base.

Today URRE is up nearly 13%, that's about 17.7% over the last 2 days.

3C intraday is showing some negative divergences and that's 100% natural, of course there's going to be profit taking after a move of that size in a mere 2 days, but the intermediate charts that caused this move and long term charts are still in great shape, in my opinion this move is barely even the start of what's coming. I have no plans to try to trade around a pullback based on profit taking, I'll hold because I think URRE has huge upside potential.

A pullback may be useful for those interested in a possible long position there as a long term core long position, I'll cover the charts later and if and when we get a pullback for new or add to positions.

BIDU- Probably one of the Easiest Core Shorts

I have BIDU as a core short/trend position, it may have a little room to add, but not much. BIDU is also currently at a -1.12% loss because I waited patiently to enter and add to it at the right places. I think there's 1 more right place that might become available, but truth be told I'd take it right here as a percent or so is nothing in the bigger picture.

The charts should make it pretty self explanatory as to why I think BIDU is a core short position that is a no brainer.

 This is the daily 3C chart, to know where you are going you have to know where you are, the cycle in BIDU should be pretty clear. We have stage 1 accumulation/base, stage 2 mark up (green arrow) stage 3 distribution/top and stage 4 comes next, that's decline. The distribution signal is leading negative on a daily chart which is about as strong a signal as you get.

 The hourly chart also shows most of the cycle, it also makes the distribution VERY clear, this chart alone tells you why I'm a fan of a BIDU short position.

 On a 15 min chart we are looking for timing, the accumulation/head fake move of 1/27 - 2/5 (thereabouts) can be seen in white, the distribution end of that cycle can also be seen so that's stage 3 for this smaller cycle as well. Stage 3 on a daily primary trend, stage 3 on an hourly intermediate trend and stage 3 on a 15 min short term trend, that's a nice line up as one after another will move to stage 4 from the earlier to the daily. I really couldn't ask for a more textbook alignment of multiple trends for a primary trend trade.


 The 10 min chart shows the head fake/bear trap/short squeeze (the Jan 27- Feb 5/6th) and the sharp distribution ending that cycle.

On a 5 min chart we are leading negative.

Only on a very short intraday chart does it look like BIDU could give a slightly better entry, but again I'd have no problem taking it right here.

 The 1 min has a small positive intraday divergence, I'd guess that BIDU could bounce up to the recent range around $174, offering a little better entry.

The 3 min chart shows it too as well as the distribution of each bounce so you might set an alert for >$172-$173 and consider BIDU.

Simple Market Update in 4 charts

I've been looking around a lot the last 2-days and I could fill this post with dozens upon dozens of charts, but it's pretty easy to see what's going on.

You recall our range that started Jan 27th and accumulation in that range and then the next Monday the head fake move down we predicted the preceding Friday and being a head fake move, the continued accumulation in a small "W" base until Feb 6th, that was the accumulation to launch this rally that started Feb 7th, we predicted it long before it started with the boilerplate, "Wall Street doesn't set up any move without a reason", the reason here that we offered BEFORE the move started (not Monday morning quarterbacking) was to swing sentiment from bearish to bullish so they'd have something to sell short in to. To sell short you need to be able to sell and if everyone is bearish, who's going to buy? 

That was our expected reason for the move, but as I said BEFORE the move started, "It will have to be very strong to be convincing and even though I'm telling you what to expect ahead of time, it will likely be so strong that my inbox will be flooded with emails asking, "Are you sure, this seems awfully bullish?". 

The charts we have verify that this is what this move was about. In my view the last several days, at least the last two days, they have been trying hard to keep prices fairly stable as orders are filled near VWAP, they almost lost it this morning when USD/JPY decided to break lower and test $102. However there's no doubt in my mind that they are distributing in large size, the exact reason the entire thing was set up in the first place.

At this point the distribution is so sharp that when they can no longer hold this together on intraday charts or no longer need to hold it together, "Watch out below". I don't think we are right on the edge of that, I think we probably have at least another day, but I could be very wrong and when the market moves, it moves fast.

Here are the charts...

 intraday 1 min, we are getting these moves higher like the SPX yesterday and then they are failing, like the SPX yesterday, that's the distribution in to the prices whether a little higher or just stable in the area around VWAP.

The 2 min chart shows the price trend taking off on Feb 6th/7th and in line as they needed to push the market so it was convincing, that was easy to do early on as the short squeeze did all the heavy lifting, but I'd say all the shorts who are going to be squeezed are already out of the market, thus the flop in prices at the orange arrow, now they need to be actively involved in keeping prices up as I posted the last several days, VWAP is playing an important role as is USD/JPY and $102 support, but the distribution is clear once they got to the area where it was worth while.

 Looking at a 30 min chart makes the entire cycle easier to see, 1/27-2/5 we had accumulation with a head fake move that created a bear trap which created a short squeeze, confirmation on the early part of the trend where it was strong and very intense distribution and you can see the reversal process or that "U" shape in prices at the top as 3C leads negative on a long timeframes.

That's the story, that's the damage that's just waiting for these 1-5 min charts to fail and look out below when they do.

 A 60 min chart makes it just as clear, accumulation at the same period as mentioned and distribution which is already in bad shape.

As proof of their active role in trying to do what they can to keep the market from dropping until they are done, the usual suspect, HYG outperforming SPX, when they are looking for ways to ramp the market or support it, HYG is the first place to look.

Yields are down today so it's not all sugar coated.

That's where the market is at, pretty plain, pretty simple, it tells me I want to be finishing setting up my core shorts with the time we have left, how much is that time?

I'd say from leading indicators that it will probably at least move in to tomorrow morning, but that test of $102 this morning was very close to taking us over the edge, I'll have to check leading indicators before or around the close.

TRADE IDEA: FILLING OUT PCLN CORE SHORT POSITION

I have about 30% left to fill out to bring PCLN up to full position size (Short Equity Position, no leverage) so I'm going to go ahead and do that in addition to the put position which is meant as a shorter term momentum trade.

You may recall yesterday's post and the change in character of PCLN's price ROC, that very vertical move which I compared to AAPL's as well, it tends to be seen about 80+% of the time just as a stock is heading in to a top, here's yesterday's post showing both...

Here's a look at both through PCLN's various timeframes....

 This 1 min chart shows accumulation right about the middle of the chart and a small head fake move under the yellow trendline, not on a large scale, but enough to justify that gap up. Today's move has no such accumulation to justify or support the move, in fact you see a negative divergence in to the move.

 This is a closer intraday look, it's the same pattern from yesterday, early support and then distribution in to a lateral trend (yesterday saw much of the price trend centered around VWAP).

The 2 min chart also shows the same accumulation for the gap up move and no accumulation for today's move which tells me it's not likely to hold for long.

 On a larger scale, specifically the accumulation from Jan 27th to Feb 6th in the overall market is seen almost exactly the same in PCLN as you might expect as about 2/3rds of a stock's movement is dictated by the overall market, flowing with the tide; in this case it's pretty specific, at "A" it starts right around the 27th and the move up starts Feb 7th just like the broad market (the head fake move/bear trap that led to a short squeeze).

"B" would be the same time as the market's short squeeze and "C" would be the equivalent of the distribution in the overall market.

If you want to look at this from a fractal cycle perspective, "A" would be stage 1 base/accumulation, "B" would be stage 2 "Mark-up" and "C" would be stage 3 "Distribution" and the next stage of the 4 stages in a cycle is 4 which is decline.

On a larger scale, this is the 15 min chart, it also shows a positive divegrence between Jan 27th and Feb 6th and distribution in to higher prices, today's move specifically is in leading negative position on a 15 min chart so I have no problem with puts nor do I have any problem with filling out the core short.

Scaled out the 30 min chart is actually in leading negative position, but I scaled it up to the most recent move , again the 27th through Feb 6th , mark up and distribution,

You can see from the 60 min chart that 30 min would be in leading negative position overall despite it following this move.
 60 min overall primary underlying trend, even the accumulation of the 27th through the first week of Feb is not strong enough to show up here, meaning the distribution is quite substantial on a primary trend basis which is not surprising considering the first two charts from yesterday's post.

And the 4 hour chart needs no notes, you can see it pretty clearly for what it is, which is why I have no problem filling out the core position with the way intermediate charts look, it's more or less what I've been waiting for.

Trade Idea: Opening a few PCLN March $1350 Puts

This move today looks very weak, I'll have some charts up in a minute, but GOOG, NFLX, and PCLN all have these weak (3C) mini parabolic moves

Goog Update

GOOG is what I'd consider a potential core position, but I'd be active in managing it, meaning I think at some point it will have choppy lateral and counter trend moves.

The Trend Channel for it's most recent run broke, GOOG just happened to catch the market's Feb 7th short squeeze coming out of the head fake move.
 Here's the break in the Trend Channel and just after was the market's short squeeze rally. I still consider the back of the previous trend to be broken.

This was this morning's semi-parabolic move that was seen in several of the momentum names, the intraday 1 min is CLEARLY negative in to the move which is why I posted I didn't trust the move among other reasons such as it being parabolic and the overall market environment, I like to use moves such as these for building a position, entering shorts or puts.

 GOOG's 2 min chart shows the accumulation over about a day and a half that moved it higher and the distribution in to that move.

Longer term though GOOG has been seeing distribution so that's the direction of highest probabilities, making moves like this morning's, very useful in entering at the best price with lower risk. This is a leading negative divegrence on a 15 min chart.

I could show you the 30 min too, but we'll just skip right to the 60 min which was in line  for a bit (although in the much larger picture it is still in a long term leading negative position) and heavy distribution in to higher prices and just as important, in to demand.

Thus GOOG is on the core short list, I just think it will need more active management than some others.

UNG / DGAZ

Long time members know how much I like UNG as a long term long position, I almost always have a UNG long open because of that, but last Friday I made a difficult decision in deciding to close the entire UNG core long position. It turns out, that was the right call as UNG was down -5.67% yesterday.

 This was Friday's (2/21) UNG exit of the entire core position to protect gains at 30+%. I also have a DGAZ trading position open (3x short Natural Gas) on a UNG pullback play.

After yesterday's near 6% loss in UNG, it's not uncommon to have a correction or bounce, I think this may be an opportunity to enter DGAZ as a trading position or perhaps a UNG short or put, although I hate betting against UNG, but I do think it is just getting started on a larger pullback.

This is UNG's 1 min chart, there's a positive divegrence on the open which is not unusual after the beating it took yesterday and the price pattern is a small bear flag.

 This divergence stretches all the way out to the 5 min chart, there hasn't been enough time for this to become a very strong divegrence, but the time that there has been available for short term accumulation has been used well so it's this counter trend correction that provides the opportunity to enter DGAZ at lower prices (lower than yesterday's) or to enter a potential UNG short/Put.

 The stronger 15 min chart has a much bigger and longer term negative divegrence so this is where the probabilities ultimately are, no matter how much UNG might be able to gain off the 5 min positive above, it should still resolve to making a lower low as this 15 min chart is negative, stronger and that's where the probabilities are stronger.

 If that's not enough for you, then the resistance that is clearly shown on a 30 min chart and leading negative divegrence which is the reason I closed the long position near the highs Friday, should be enough to give you confidence in buying DGAZ weakness near term or shorting UNG strength.

 DGAZ's 60 min chart confirms UNG's 30 min above with a positive divegrence, this is where the longer term probabilities (on a swing or longer trade) are.

The 30 min confirms as well

 The 5 min is showing a negative divergence on the gap up open which confirms the positive divergence in UNG on the 5 min gap down open as the two trade opposite each other.

 There is a small 1 min  divergence that opened negative and has gone positive on the pullback, I'm not sure if this is just a small intraday divergence or if it will migrate to the 2 min chart below which shows no positives yet. If it starts to migrate to longer term intraday charts like 22 and 3 min, then we know that the time to enter DGAZ long or UNG short will be very soon, if it fails then we know it's likely that DGAZ will pull back some more and UNG will gain some more before they make for good entries which would actually be a better entry.

It will come down to this 2 min chart later, whether it starts going positive or remains negative. The trade should be available, the question now is just when and at what price level, but I imagine it can't be more than a day or two out at the most.

GOOG, NFLX & PCLN

All 3 have little parabolic moves up, I don't trust any of them, if you are building short positions in any of them it may be worth a look. I'll get some larger updates out on them once we are through a.m. trade

Trade Idea: VXX / UVXY

This is a reiteration, I prefer and have a UVXY trading portfolio position open which I prefer over options at the moment because I think the base is large enough that you don't need the leverage of options and I think you can capture more of the trend with an equity position, UVXY is the 2x leveraged version of VXX (Short term VIX futures). These make for good trading positions, I'd be careful about anything too far beyond that.

Here's a look at both which show good confirmation.

 Intraday it is in line, it seems to just be in a holding pattern (VIX trades opposite the market and the market is in essentially a holding pattern).

However VXX and UVXY both look to have built extensive rounding bases with good 3C positive divergences like this 5 min

 Or this 10 min VXX leading positive divegrence

Or a 15 min leading positive...

Even out to 1 hour. It seems significant protection has been accumulated while retail chases price.

I also prefer an equity position over options (unless we happen to get a good options set up with a deep pullback in to accumulation) as the time decay isn't the issue that it is with options, although I don't think we are too far from a pivot/reversal.

This is one of the trading positions aligned with market divergences, the others are SQQQ (3x short the QQQ) and SPXU (3x short the SPX).

Market Update

I wanted to give you a visual of what's going on. Yesterday you may recall I said it looked like there was early support to push the market higher, once it hit the level they were looking for price turned sideways and travelled along VWAP and that's where there was distribution, but distribution is not only selling with 3C, short selling is selling as well , it comes across the tape as a sale.

This morning you can see the support thrown in to halt the slide, this is the same "steering divergence " I have mentioned numerous times before and specifically very early this morning (around 2 a.m.).


 SPY yesterday seeing distribution as price meanders sideways and slightly lower, then yesterday's late day sell-off as the pros enter the market and apparently are a bit panicked at the prospect of the market makers/specialists losing control and seeing futures about to or actually breaking under VWAP.

You saw what happened overnight and this morning pre-market and on the open, above you can see another steering divergence, a small positive, but enough to halt the slide for now. The question I have is whether they'll throw enough support in to try to get the SPX to close green for the first time ON THE YEAR?

*The red trendline is yesterday's close.

QQQ seeing the same early support yesterday and then distribution/negative 3C divergence as price travels sideways along VWAP and this morning a relative positive divegrence as the Q's break under yesterday's close, just shortly before, about 10 minutes before the open, THE MARKET WAS SET TO OPEN EXACTLY AT YESTERDAY'S CLOSE UNTIL USD/JPY BROKE DOWN AND TESTED THE CRUCIAL $102 AREA.

 IWM with the same afternoon distribution and this morning's positive divegrence (not accumulation)  to halt the slide lower.

Just so you know, this is AAPL's 5 min chart, it still has a positive divegrence that normally would send it higher, but it seems to be struggling, I don't think it's building a larger divergence, I think it's trying to fire off what it has and not finding it so easy. This is why I didn't take the AAPL trade, it was trading against very strong probabilities. *I'll be watching for any signs that this divegrence is starting to fail, the 1-3 min charts don't look so hot.