Proof...
First, as I stated in a market post on Thursday, the symmetrical triangle is the most easily recognized of triangles in all of Technical Analysis, the ascending and descending triangles are there as well, but they are a bit more complicated, although not much; the point being- anyone with the slightest experience in Technical Analysis recognizes a symmetrical triangle and in this case they are taught by technical analysis for more than a century (so Wall St. knows what traders will pay attention to). Under market conditions, a symmetrical triangle is considered to be a bullish, continuation/consolidation pattern, meaning it's a rest before the next leg higher.
A brief history of Technical analysis and triangles.
I was in and using advanced technical analysis long before it was fashionable, when most traders were fundamental, P/E oriented and Technical Analysis was actually called, "Voodoo Analysis", the most common question from its detractors, "How do you expect to know where a stock is going based on a bunch of lines?"
Then cam the advent of the Internet and more importantly cheap online brokers. People wanted to manage their own accounts, but needed an easy way to make decisions-rather than pour over dozens of hours of financials (Fundamental Analysis), Technical Analysis started to look attractive simply out of laziness.
Before Technical Analysis became mainstream in the late 1990's, a symmetrical trianlge had at least a 65% chance of working-the probabilities weren't perfect, but they were with you. After Technical Analysis went mainstream, the chances of a symmetrical triangle nearly went down to 50/50- a coin toss. I didn't want to believe it because I had spent so much time studying Technical Analysis, but research concluded that price patterns like this had no better than a 50/50 shot, they provided no advantage and in some cases, they were more likely to fail.
Why? That's the easiest question to answer and the same thing that Wall St. uses to manipulate the market and Technical traders to this day, Wall St. knew exactly what the crowd was looking at, knew exactly how the crowd would react and used this against the crowd.
To my utter amazement, Technical Analysis is no further advanced in understanding that Wall St. understands Technical Analysis than they were 15 years ago! When I say, "I think something will happen because of Market Behavior", I'm talking about the obvious set ups Wall St. uses and retail Technical traders fall for everyday. This is why I go to pains to point out the head-fake moves and how, when and why they happen.
Thursday was the most obvious of set-ups...
*I know there's some reading below, but if you don't understand what happened, you will not understand what is happening and right now it is crucial to understadn what is happening-PLEASE READ ON
Just after 11 a.m, I posted this update specifically about the set up in the NASDAQ 100/QQQ
In that post I said...
"I've been looking at this congestion in the market, I found the pattern clearly in the Q's ...The pattern is a triangle, retail takes it as bullish, but they won't buy until it breaks out, there is a 1 min positive at least on the Q's so I'm thinking this will be a head fake breakout from the triangle...The DIA has something similar and this is why (among other reasons) I think this is likely a head fake move, we usually know they will be head fakes in advance due to current divergences before the move happens...All of our best trades and highest probability trades have set up the exact same way as the DIA below.... Because it is a symmetrical triangle following an uptrend, retail technical traders see this as a bullish continuation pattern, it's one of the most basic price patterns out there and often used as bait by Wall St. for head fake moves..."
Right after that post, minutes later I posted, "SPY has the Same" In this post I added,
"Here's the pattern and there's going to be no significant reversal without a head fake move (***I meant market reversal to the downside-head fake moves accompany over 80% of all reversals in every timeframe) As I am typing, the SPY is starting to break out of the triangle...(This was at 11:15 a.m. Thursday).
Here's what the SPY looked like on Thursday, May 16th.


Although we had already seen any strength, such as earlier in the week, HYG strength immediately sold and other assets as the hedge funds looked to get out on any opportunity, I did not think a head fake move setting up a reversal would fail so badly, so early. Shortly after the attempted breakout, the SPY failed and ended the day lower.
As I said above in opening comments, Friday's triangle was much less ambitious (smaller) and they had nearly every conceivable lever to push the SPY up on intraday manipulation in use.
I mentioned that TLT which had gapped up (market negative as traders seek the safety of treasuries) for the best 1-day move in 5 weeks on Thursday was already being short term distributed to knock it down for a second attempt for a breakout Friday (TLT down is market positive), here's the proof...

I posted on Wednesday TLT was under accumulation and would be up Thursday-it was a nice gap up move-the best 1-day move in 5 weeks for TLT on Thursday and put pressure on the market.
However, look at Thursday's 3C chart for TLT, shortly after the 11 a.m. SPX/SPY breakout had failed (by about 11:30 a.m.), there was a move immediately to distribute TLT to make sure the short term would send it lower Friday (which helps the market to move higher).
I didn't realize at the time, but this was clear manipulation to make sure Friday's breakout did not fail too (Thursday's failed because sellers are so aggressive, any move up they have been selling in to across a wide array of asset classes).

Even as TLT's price moved lower Friday, traders were accumulating the "Flight to Safety trade".
Intent on suckering in the longs who were already anxious to buy this common pattern they had already identified as I said they would on Thursday and as the Twitter-verse confirmed as one of our members sent this tweet as an example of what he had been seeing all day Friday,
""They were all expecting the breakout and were long, even citing the "break down" in TLT. Nobody is short at least on my feed."
Why were they expecting a breakout and already positioned long? Because the symmetrical triangle is the most basic price pattern that even a "newbie" technical trader would recognize.
Do you find it interesting that these triangles were set up two days in a row, the second day only being necessary because Thursday's had failed to accomplish what they wanted as sellers were to thick?
As mentioned above at the start of the post, Friday's triangle was much less ambitious (smaller)...

Note the MUCH smaller triangle Friday.
What happened? Well as I mentioned earlier in this post, EVERY conceivable lever was pulled to support the market/SPY, not only the 3 SPY arbitrage assets of HYG (up), TLT (down) and VXX (down) which looked like this for the remaining assets in the arbitrage manipulation Friday (you saw TLT above)...

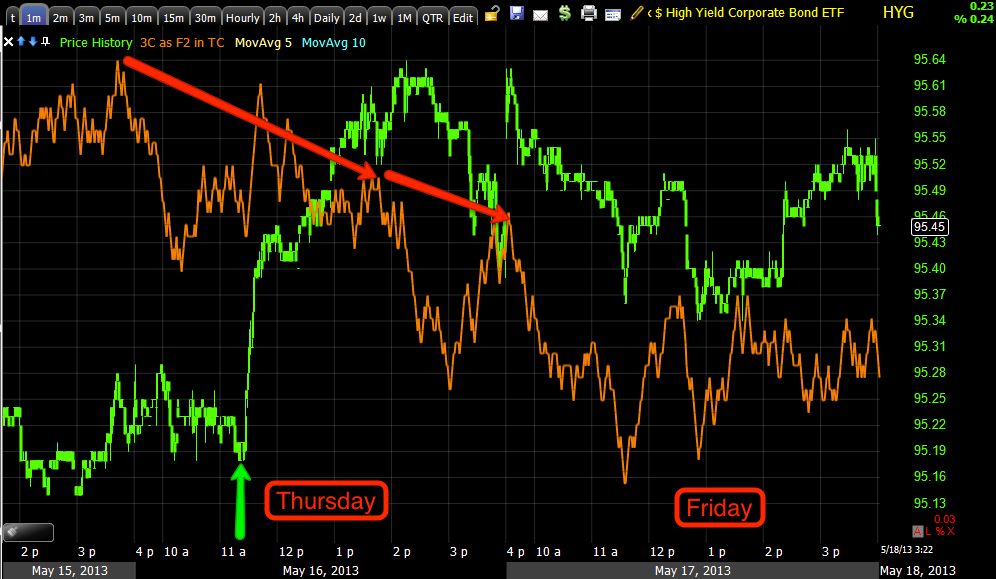
This positive divergence on a 5 min chart is why I knew HYG could move up again in support of the market.

As we can clearly see, HYG moved up as expected to support the SPY (via arbitrage), we also see that for the second time this week HYG was aggressively distributed on price strength as 3C makes VERY clear and as I predicted before HYG made even its first move up on Tuesday, I predicted HYG would see heavy sellers on ANY price strength. Again, note when the 3C negative divergence really got bad, around 11:30 after it was clear the SPY breakout from the triangle had failed for the same reason HYG was being sold in to any price strength, traders (professional) are fleeing from risk assets and flocking to Flight to Safety assets.
Again Thursday I said, "HYG still has some gas in the tank, it can still support the SPY"
The 3rd asset in SPY Arbitrage manipulation is VXX, VIX futures -short term). A move down supports the SPY on the upside.

Again, like TLT (Flight to safety), VXX (A Flight to Protection) was accumulated at lower prices aggressively on Friday.
The result of a clearly manufactured, "Bullish" price pattern (that barely works anymore and is most often used against technical traders who still believe in it as we saw from the Twitter post), the clearly manipulated TLT, HYG and VXX all in support of the market and the manipulation of the SPX/Yen correlation (via $USD/JPY) as well as other currencies like Euro and $AUD was this...

HOW DO WE KNOW THIS? Because even on breakouts to new highs in the SPX, the Dow, a break above $3000 in the NASDAQ 100; all failed to produce what Wall Street needs most and the very reason for these head -fake moves...
Volume (as their positions are much larger, they need demand to sell/sell short in to without sending the market crashing lower) and higher prices (which also help them set the bull trap that is one of the other main reasons we see head fake moves 80+% of the time and in every timeframe just before a significant reversal).
All of this makes sense, I expected it Thursday, but sellers foiled the attempt (obviously these weren't retail sellers as they were ready to buy-they were pros) on Thursday so a second attempt using every lever they could find was executed Friday.
WHAT DOESN'T MAKE SENSE IS THE $1666 CLOSE... I suppose if the market were to reverse to the downside early next week, the $1666 might be psychologically ominous as most traders are very superstitious.
At first I thought the $1666 close was curious, interesting, but not anything substantial until NANEX uncovered something.
The $1666 close was clearly manipulated as well to get right to that diabolical sounding close. Here's the true close of the SPX for Friday...

As you can see, once updated, we actually closed at $1667.47, nearly 1.5 points higher than $1666, but isn't higher better? I'd think so, but there was a VERY specific manipulation move in the last seconds of trading to get the market to $1666, all of the sudden, $1666 doesn't seem as inocent and random as it first did.
From a ZH article with NANEX chronicling events, here's a bit of what happened Friday at the close to get us to $1666
" in the last 5 minutes of trading the cash index ramped from 1,665 and easily crossed in and out of 1,666, with the final print pointing to a mid-1,667 close.
And then something happened: instead of a closing print of 1,667.50, over one point of the cash S&P suddenly was wiped out for no reason, in turn leading to the satisfactory 1,666 closing print or exactly 1,000 points higher than the "generational" lows of 2009. Yet, refreshing the settlement of the S&P500 an hour later, showed that the final closing price was, indeed, 1667.47."
So what happened?
We now know that the reason for the however brief close of the S&P at the demonic level was none other than the flash crash of Anadarko Petroleum, which as we noted in today's EOD post, lost $45 billion in market cap in 45 milliseconds (a collapse rate of $1 billion per millisecond), flash crashing from $90 all the way to an (allegedly illegal) stub quote of $0.01. It is this collapse in the entire market's capitalization of $45 billion that resulted in the difference between 1,667.5 and 1,666 for the S&P500 cash. One wonders which is worse: that the market unofficially at 1,666 and officially at 1,667.5, or that such flash crashes continue to be a daily inexplicable occurrence and which nobody has any control over. How long until the same algo that wiped out APC today, decides to shift away from simple stocks and goes for the SPY, or the QQQ, or the E-Mini contract for that matter, and wipes out $20 trillion in market cap in 45 milliseconds?"
However, after the manipulation shown above, one cannot help but wonder why someone controlling the market went to such extraordinary leangth to make sure the SPX closed at $1666 on Friday. SUDDENLY, FRIDAY'S $1666 CLOSE IS NO LONGER CURIOUS, BUT HARMLESS, IT CLEARLY WAS DONE FOR A PURPOSE.


