Wednesday, December 31, 2014

Daily Wrap and some 2014 Factoids

Would you believe that the shorts outperformed the S&P-500 through 2014? It's true, the Most Shorted Index (Most Shorted stocks) outperformed the S&P-500 with a gain of +12.67% on the year.

Some of our single name shorts have done extremely well, these are core short positions (trend) that are still open, HLF which we entered on the biggest day up HLF has ever had, more than +25% on the day in to 3C distribution for a current short sale gain of +41.39%.

NFLX which had 2 separate entries has gains of +28.21% and + 17.90%.

SCTY short is up +24.96%, FSLR short + 34.86% and our core short in FB is up +13.62%.

However I see our best opportunities right in front of us.

Treasuries or the long bond outperformed and nearly tripled the Dow's full year gain.

In a bearish sign, the Treasury curve flattened significantly through 2014 with the 2 year up 28 bps and the 30 year down over 120 basis points. The flattening of the Yield curve or inversion  has been an event that has preceded every US recession over the last 50 years so it's not a bullish event. Although many think the yield curve inversion is a prerequisite to a bear market citing the track record over the last 50 years, in Japan the flattening of the yield curve has been near useless in predicting recessions or bear markets, while it is there and happening, I wouldn't say it's a prerequisite, although we may not set a new precedent being it is flattened.

One of the things I thought made sense "Thinking like a criminal" and using Mass Psychological Analysis was for the Santa Claus rally that traders seem to think is their birth right, to suck longs in initially and then fail.

While there are several definitions of when a Santa Claus rally starts and ends, they are typically the week between Christmas and New years (starting the day after Christmas) or the day before Christmas for this year running until Friday, January 2nd. Either way, I thought an initial Santa rally or bullish market since we have had since the 17th in to the seasonal Santa rally and a failure, would set up a near perfect storm/bull trap.

By any definition of the Santa Rally, today's close puts all Santa Rally gains at a loss as was our theory.
Whether using the 23rd or 26th, the market has blown out any Santa Claus rally gains.

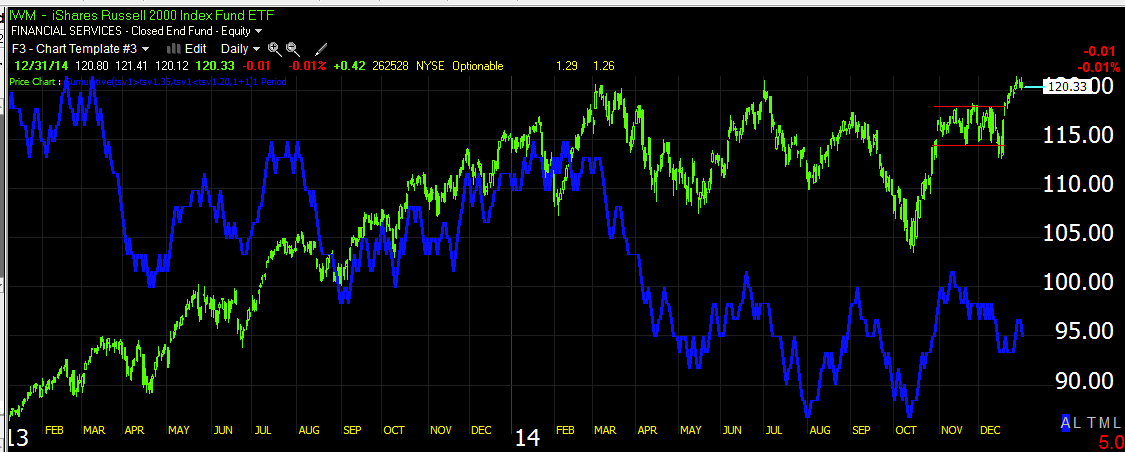
In fact, it has been a RED DECEMBER for all of the major averages with the exception of small caps which our forecast was based on ( a head fake move above the R2K's 6 week trading range).


Yesterday, throughout the day we kept getting evidence suggesting a short term move to the upside that was weak and wouldn't hold, but useful for entering short positions you might be interested in as posted Tuesday, QQQ Update & Trade Set-up.

In fact this morning by the time Early Indications was posted around 11 a.m., we could already see evidence of the move starting to fail leading to the last sentence of the post,This is starting to look like an excellent fade trade, fade the morning gains as they are way too parabolic."

While I wouldn't recommend this sort of trade for everyone and I am far too busy myself to watch over such a day trade, I know more than a few members took the fade trade and called it an early day.

I had also posted early in the A.M. Update that the bond market closing at 2 p.m. (an hour earlier than usual) and may have some effect, "What's important for today as has been the last several days and years is the USD/JPY, especially with bonds closing at 2 p.m. today rather than 3, which will mean USD/JPY will have more influence". 

While the Draghi news earlier in the day made the EUR/USD the pair to watch, it seems the bond market early closure did have an effect if you look at the major averages' performance after 2 p.m., although they were being led by EUR/USD, it seems to be more there than just that.

EUR/USD (candlesticks) vs ES (purple line) intraday.

While EUR/USD took a dive and in doing so caused the $USD to strengthen and held USD/JPY relatively in place through the day, I think signs of a reversal of that situation continue to build.
 EUR/USD working on an intraday 1 min positive divergence.

The Euro futures are also showing a similar divergence, this would weaken the $USD and with Yen strength, send the USD/JPY lower, I suspect as the half life of Draghi jawboning is quite short these days, the USD/JPY would once again be the correlation Index futures are pegged to.

 Here the USD/JPY shows an opposite leading negative divergence suggesting it is near making a move lower.

The 1 min $USDX has seen a strengthening 3C negative divergence as the day has wore on.

 And the Yen 1 min is seeing a positive divergence, both suggesting the USD/JPY see more downside.

 The $USDX 5 min chart is also leading negative as the Yen is positive.

And the 7 min Yen chart which looks like it was consolidating is seeing a stronger positive divergence developing while...

The $USDX 7 min sees a deeper negative divergence developing and it just gets worse in stronger/longer time frames from there.


While the Index futures closed ugly, they are seeing a small 1 min positive divergence, perhaps a small oversold bounce, perhaps it's nothing, but I'd use any strength to sell/short in to.
 The Index futures look similar to this 1 min ES with a small positive divergence, although I don't think it can go far if it goes anywhere and as I said, I'd use strength in price to sell/short in to.

The 5 min chart is in line with the Index futures to the downside and the 7 min chart which has been key to near term action...

Is leading negative or in line to the downside and the longer time frames/stronger just get worse from there.

As we generally see, 3C divergences in the averages tend to pick up where they left off at the cash close, all major averages are leading negative or in line to the downside, suggesting tomorrow see additional weakness, at least early in the day , and there's nothing on any charts in the longer 2, 3 or 5 min ranges that is positive so there's not much at all to even suggest a bounce other than the 1 min Index futures and that is a small signal for a long overnight session. You saw the charts, this market is in an ugly spot.

Just look at the daily close...

SPX Daily close

However, we don't want to take anything for granted, I believe 100% that Wall St. will never make the trade easy or obvious and will try to shake you out, engage the Buy the Dip crowd, etc. All of this can be used to our tactical advantage, but that means keeping an eye out for it and not just assuming the market is going to hand you an easy victory.

There is one thing that could lead to a short term correction on a 1-day oversold basis, that's the Dominant Price/Volume Relationship in which all 4 averages came in at Close Down/Volume Up, like a mini selling climax or capitulation event. Of the Dow components, a massive 28 stocks were in the category of the 4 categories. Of the NDX 100, 71, 919 of the Russell 2000 and 323 of the SPX 500, that's a Dominant relationship and most often results in a bounce the following day on a 1-day oversold basis.

In addition, all 9 of the S&P sectors closed green with Consumer Discretionary doing the best at a loss of -.40% and Utilities lagging at -1.81%.

Additionally, only 19 of the 238 Morningstar groups closed green, that normally would be taken as a massively 1-day oversold event with a green close the following day, however beyond that, it carries no traction.

Of leading indicators, the VXX and VIX slightly outperformed the SPX correlation. The SPX caught down to TLT's bearishness or said another way, the SPX caught down to yields negative short term dislocation, although on a longer term, the SPX has plenty of downside to go. The SPX also caught down to HYG's bearishness short term, although it is significantly dislocated on a longer term basis and still has a lot of downside before the SPX catches down.

Interestingly both our Pro Sentiment indicators outperformed the SPX's correlation, again suggesting a short term 1-day oversold event and corrective bounce.

While I don't have any positive divergences outside the 1 min Index futures which could easily be wiped out overnight, there are more than a few short term signs of a 1-day oversold event which "usually" results in a next day bounce, however many things change when fear picks up with volatility which go hand in hand.

I wouldn't make any assumptions beyond I'd certainly look to use any price strength to sell or short in to, I would not try to chase anything to the upside, the probabilities are just too skewed to the downside.

Under "normal " circumstances, I'd put the probability of a 1-day oversold bounce tomorrow very high, but these are not normal circumstances with the degree of negative divergences we have. We'll watch for anything that can be used to out advantage and after I get back tonight I'll check the futures to see if anything has changed near term probabilities.

Have a safe and happy New Year.


Happy New Year!


Market Looks Horrible- Downside Move Should Be Imminent

I'm not talking about the -.75% QQQ loss today, I'm talking about the fulfillment of the December 12th forecast in which we were looking for the IWM to make a breakout/head fake move or false breakout above the 6 week range around $118, which would then set a bull trap and give the market extra momentum on the real move that all of this was meant to set up, a sharp move lower in which the IWM essentially has put in its head fake move at the end of a stage 3 top coming from the October cycle rally.

I can't put every average and every timeframe up and I can't say definitively we won't have more jiggles like this morning's move to the upside, but I'd use those to enter positions on price strength.

Here's a sampling of some of the charts that are just at the point in which they are SCREAMING, the kinds of divergences I never ignore and while they are on multiple timeframes (full house), it's the longer term ones that are especially dangerous.

I have marked a few past divergences just for reference, the current ones should be easily identifiable and their size should tell you the same thing I have been showing for some time.

First the actual trigger, at least as of the 12/12 forecast.
 The 4 stages since the October lows which was a bottom we forecast to be a monster rally, this at a time when some bearish sentiment indicators were at record extremes.

In fact the very forecast and challenge to members was the following on October 15th, in the Daily Wrap

"I suspect we will see a sharp upside move taking out shorts and breaking above obvious resistance like 200-day moving averages and top trendlines as well as the August lows, remember these moves HAVE to be convincing, it doesn't mean there's a real change in character so if and when the time comes to start shorting in to that strength, it's a gift, although you can bookmark this post, I promise you , you will not feel it is safe to short in to strength as the market moves higher on a bounce like you do now, the moves are that convincing, which is all the better for entering new or adding to existing shorts."

This was written before the first sign of a move higher, after a decline that had everyone bearish and calling a top; this was the stage 1 base which we saw accumulation for and therefore could forecast a sharp move higher that would be so strong, I felt I needed to anchor expectations before the move started with a challenge to book mark the post as everyone was so bearish, it was inconceivable at the time that such a strong move could take place.

The rally is stage 2 "Mark-up", the area of what turned out to be a 6 week IWM range that didn't move more than -.38% over the 6 trading weeks was the stage 3 top and as we always look for just before a reversal whether up or down, the head fake move above the stage 3 top or in this case the IWM's 6 week range at "HF", next comes stage 4 "Decline". Once the IWM breaks below $118, the bull trap is locked and it should create insane downside momentum.

I tried to mix up the timeframes a bit so you get a sample of all of them.

IWM 2 min trend since the December 12th forecast for a move ABOVE the IWM's range that is a head fake or false breakout leading to stage 4 decline.

This is the same area with a 15 min IWM chart, the leading negative divergence/distribution is clear as day.

 And as to how severe the move could be, this is a daily IWM chart with a huge leading negative divgerence.

Some of you have seen my post of the 1929 Dow 3C chart vs the current Dow 3C chart, the current one is much, much worse.

 QQQ 3 min again the trend before the December lows and forecast and the trend since, a new leading negative low in 3C.

 QQQ 15 min since the accumulation of the October low, the distribution at stage 3 and the head fake move which creates a look like an "Igloo with a chimney", the Igloo being the stage 3 top, the chimney being the head fake move just before a downside reversal.

3C has made a series of new leading negative lows well below the October lows level.

 QQQ 4 hour, a very strong underlying timeframe with confirmation to the far left, even though smaller divergences may have been active, they don't show up here unless they are strong enough.

Again, a new leading negative low in 3C.

 SPY 3 min trend since the December 12th forecast...

 SPY 10 min with distribution in to the December lows, accumulation at the lows for our forecast of a move higher and sharp distribution in to the highs.

SPY 30 min chart speaks for itself.

Again, I'd use any short term price strength as a tactical entry in to positions I like (short) such as the SQQQ/QQQ short in to today's early strength.

I Think This Is It

I'm already fully loaded for bear so to speak, but if you are looking at the charts and seeing the same thing I am, I believe we are right on the eve of the break below $IWM $118 which should lead to a move lower eventually making a lower low than the October lows.

The charts look horrible and I really don't like chasing anything, but I think if I had room to add to any of my short positions, I'd probably be doing it if I hadn't already in to this morning's strength.

I'll have charts up shortly, but I'm telling you, they look horrible and I'd use ANY bit of price strength to enter shorts art a better price, although this area overall is a great area with much lower risk.

Charts are coming.

My personal core short positions are in SQQQ, SRTY and FAZ (3x short QQQ covering Tech, 3x short Russell 2000 covering small caps and 3x short Financials covering, uh... well Financials.

TLT/TBT Position Management

I hate to do this, but if an edge becomes dull or there's something I don't understand, I can't justify putting a gain at a risk so I'm going to close/cover the TBT (2x short TLT 20+ year Bond Fund) short, which was entered as a way to create a higher liquidity 2x leveraged long of TLT, since there's not much available in the 2x long TLT with any liquidity, I created the position by shorting the inverse, TBT, which effectively gave me a 2x leverage long TLT position.

Near term charts still look pretty strong in both TLT and 30 year Treasury futures and long term charts look strong, I don't quite understand what's going on in the middle, but I'm not taking the chance so I'll be closing TBT short as soon as this is posted.

The current position's P/L is at about an 11.5% gain.

Here are a few of the reasons why and some of the longer term charts that suggest that whatever is going on in these mid-term timeframes, the longer term TLT (20+ year Bonds fund) and 30 year Treasury futures , is still bullish, but perhaps some kind of deep pullback before they make additional gains as 2014 has been a great year for bonds with the bond shorts getting crushed.

 As I said, the short term charts still look like there's a probability of more near term upside, however, this 30 year Treasury future (ZB) on a 7 min chart is showing a negative divegrence which may just be part of a natural consolidation, but I'd rather re-enter after the consolidation than give up the hard fought for gains.

 The ZB 15 min chart also shows the negative divergence and this is a pretty serious timeframe.

 However when you get to the longer term trend charts like this 30 min, ZB's chart is still leading positive.

My best guess is some sort of pullback, probably fairly deep which is accumulated, in which case I'd re-enter at lower prices and lower risk and then a continuation of the longer term trend which looks stable.

The TLT (20+ year Treasury/Bond Fund)...
 As I said, near term it still looks pretty good like this 2 min chart in line with the upside, but like ZB...

at 10 mins. around the mid-term timeframes, there's an unexplainable negative divergence and of decent size.

And like ZB's positive 30 min chart, TLT's 60 min chart is positive and in line with the trend, so I suspect a pullback, but I'll not give up the gains waiting to see what happens, I'll look to re-enter when the edge is sharper.

5 and 10 year Treasury futures look identical.

FX & Index Futures

As I posted earlier, it is obvious that the USD/JPY move higher that ramped Index futures higher this morning as well as the major averages, was a result of the Draghi article of consolidating the EU in to a monetary union and although unspoken, perhaps reworking the ECB's charter prohibiting financing of any individual nation's sovereign debt. I'm not sure of the legalities, whether a monetary union or the "Structural reforms" Draghi has been pushing for which would see sovereign nations that are EU members cede more of their sovereignty, but it couldn't come at a worse time for Draghi as nationalism is being stoked in most of the PIIGS, the very countries that need to be in a monetary union for Draghi to work any QE magic- take the 3x failed presidential elections in Greece recently and the resulting snap elections that will see the anti-austerity party Syriza right in to more power, not to mention the IMF suspending Greek funding talks until a new government is in place. The basic structure here is the ECB is financed through the IMF, channelled through Greece in the form of bailouts which are really nothing more than paying their obligations, debts and interest to other European banks, the process is complicated, but this is the flow through that finances the ECB and with recent IMF suspension of bailout talks over the failed elections, this creates an additional problem for Draghi and any dreams of QE.

In any case, the ramp was due to the EUR/USD falling on the Draghi news as currencies often do when dilution via printing comes up. This was the EUR/USD this morning on the Draghi news...
While it fell, the weakening EUR strengthened the $USD which resulted in a stronger $USD. Note the positive divergence intraday starting to form as the EUR/USD looks as if it may have found a toe hold here.

 I warned yesterday if the $USD's downtrend transitioned to lateral, it wouldn't be hard for the $USD to ramp and the USD/JPY which all of the Index future trading algos are correlated to.

Note the current negative 3C divegrence in the $USDX and high volume at the new high, suggestive of churning (bearish) with a 3C negative divergence in the area.

The strengthening Dollar caused a weaker Yen...
Yen 1 min chart dropping lower which bottomed at 11 a.m.

This caused the USD/JPY to jump, the carry pair that the algos are correlated to or correlate the Index futures to. I mentioned earlier today around the open that there was some issue as to whether the algos that usually are active around the European close would catch the fact that the FTSE would be closing at 12:30 local rather than 11:30 and the Euronext cash closing 35 minutes later.
 The USD/JPY ramped in parabolic style with several of the Index futures, however note the 3C negative divergence, now along the lines of the one seen Monday leading to the overnight losses in to yesterday.

And the correlation with the Index futures...
 Opps, the USD/JPY in candlesticks seems to have ZERO correlation with ES/SPX futures (purple) as they don't seem to care what the USD/JPY is doing and moved lower instead.

Even Russel 2000 futures that initially ramped with USD/JPY have given up the correlation...
TF ramps just after the 9:30 cash open with USD/JPY and then FAILS.

In fact it seems for the SPX futures at least, they are tracking EUR/USD a lot more closely.
EUR/USD vs ES (purple).

So follow this, EUR/USD drops sending $USD higher and Yen lower, USD/JPY moves higher taking Index futures with it initially and the algos seem to be re-calibrated to the most influential pair right now that started all of this, EUR/USD.

However all 3 currencies are important, $USD. Yen and Euro.
 This is ES on a 5 min chart (purple) with USD/JPY, if you consider the bigger picture posted yesterday and this morning, the SPX futures have some catching down to do to the USD/JPY correlation, short term you can't see it, but move out to a 60 min chart and there's an air bubble for support of SPX futures...

Here it is on a 60 min chart, note when ES prices (purple) we lower at the previous high to the left, USD/JPY was right in the area, but now USD/JPY is significantly dislocated and there's an air bubble for support, meaning ES and other Index futures could see a pop of that bubble and a move lower toward the most traditional correlation of USD/JPY.

As for individual currency futures, you saw the 1 min $USD already seeing a negative divegrence, the Euro in an area where it may have gained a toe hold and put together a positive divegrence as Draghi's jawboning has a very limited half life, typically less than a day now. A falling dollar, rising Yen or rising Euro would all be market negatives.

 The 5 min $USDX which we suspected would turn lateral from yesterday's initial move lower did turn lateral at the green arrows, but the 5 min 3C chart of the $USD shows a large relative negative divergence suggesting the $USD doesn't hold much longer and we didn't expect this to be a very long lasting move yesterday as there was no support beyond 1 min charts, but there were divergences suggesting USD/JPY move lower in the stronger/longer charts, such as this one.

The Yen put in a positive divergence on a 7 min chart and in my view has been doing nothing but consolidating in this area , also as suspected.

Remember after the 7 min charts which were the neutral turning point between short term and long term, the $USD looks a lot worse, the Yen a lot better.

As for the Euro...out at the 60 min chart it looks like its trying to put together a larger base, likely to move at a later date, but still working toward that.
60 min Euro positive divegrence.


Index futures...
 ES 1 min looks to be trying to hold a consolidation in the area, but struggling.

The same for TF after distribution at the a.m. highs.

And NQ is in line with the downside move, 3C trend/price confirmation.


As for the longer charts, the stronger divegrences and highest probabilities...
 TF 7 min leading negative, I don't think it will be long before the final part of our 12/12 forecast completes, everything up until now has been a means to an end, in other words as I often warn, price is deceptive.

ES 15 min in line with the downtrend since distribution at the highs and a move lower.

ES showing the entire cycle since our forecast on 12/12 with accumulation 12/15 and 12/16 and the move higher we forecast in to distribution as was forecast, leading to the next pivot DOWN.

 At the strongest charts, here NQ 60 min also shows the cycle we forecast with the white area around date being 12/12.

And the TF 4 hour chart with exceptionally strong distribution.

We also have daily, weekly and monthly charts negative, these are by far the highest probabilities for the next move and a strong one at that.