Friday, April 27, 2012

GLD Follow up

 Longer term there may be some base building in GLD, GDX and GDXJ's long term 60 min charts look good and there's some correlation between the miners and GLD directionally. I closed the GDXJ calls yesterday at a profit expecting a pullback, they have moved a bit higher today, but still look like a pullback, so this is a short term Put position on a pullback move in GLD.

 The 30 min chart's trend is pretty bullish, but the recent negative divergence looks like a pullback move is coming and with a negative divergence out to 30 min., it could be a decent size pullback.

 The 15 min chart is confirming the 30 min with a leading negative divergence.

 The 5 min chart looks even worse as it should as the shorter timeframe's weakness bleeds in to the longer timeframe like the 15/30 min. charts above.

The 1 min looks especially strong in the leading negative, so this looks like an opportunity, probably not worthwhile in a straight short position so I chose to use some leverage with puts.

The fact GDX/J also looks ready to pullback is also encouraging for this quick trade.

GLD Trade-May $162 Puts

TAKING A POSITION IN GLD

I'm going to use some May Puts for a quick trade in GLD, I'll probably use $160+ strike, this is for a short term trade only. I'll follow up in a minute. As has been my recent habit, my speculative and leveraged positions are a bit smaller than usual. So I consider this a speculative trade.

DIA Example

I like what I'm seeing in the DIA, it looks like the SPY is starting to join the DIA's continuing leading negative 15 min divergence, this tends to be one of the clearest signals, but it needs some time to develop.

 Here's the bullish looking triangle in the DIA that broke out earlier today. Th fact we are seeing some bullish looking patterns in averages such as the Dow which have made the most significant moves higher, seems to me like there's a focus on creating a bull trap now that the shorts have been taken care of. The declining volume of the triangle is what traders would look for to confirm the consolidation, but the breakout volume was quite weak. If the DIA and market in general can hold up a bit longer, it will give  much cleaner signal an allow time to round out some of your trades.

 DIA 1 min has been extremely negative, especially yesterday and today, there's a slight positive divergence, although 3C is in a deeply leading negative position. This is encouraging that there's a decent chance for the Dow/market to at least hold it's ground while the 15 min chart keeps moving down.

Since I first pointed this chart out just an hour or so ago, it has moved down even deeper, this is the ideal signal.

AAPL Update

 AAPL in the target zone, I would like to add here, but only on higher prices or a clear break.

 AAPL 60 min need no commentary.

 The 30 min trend is negative as well, these are the longer term trends that we expect from AAPL

 The 15 min chart went positive before earnings, with tech and the NASDAQ 100, it's still holding up so I think there's still a chance to add to AAPL at higher prices, especially if the market can hold here, even if only in a consolidation.

 Here's what took place on AAPL's move higher as expected.

 Very short term intraday charts have some positive divergences suggesting 1 more move higher in AAPL-this is a 3 min.

And the 1 min.

Patience has been the key with AAPL, shorts who entered on the break below support at 4/23-4/24 are likely not too happy right now, this is why we wait for the trade to come to us. So as hard as it can be, patience with AAPL and any other trade as well as letting it come to you are really key. The earlier shorts were right on AAPL's longer term trend change coming, but they likely couldn't withstand the draw down. The break of support and shakeout after have been a long standing trend in the market, if you play by the old rules of trading you get burnt. If you are patient, which is not always easy, you get the good positions. Look at our entry in BIDU, we waited for the head fake move, waited some more, shorted at a great place and the position is in the money.

IOC Follow up

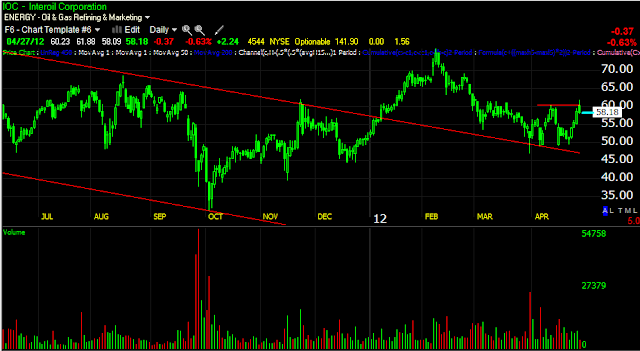
IOC is a short trade from January, it's looking decent here for a new position or an add to.

 IOC was in a clean downtrend, it used the 2012 rally to breakout of the down trend, but I never though this was a real move of strength, more likely a shakeout. We had some short positions in the red box, the white box just shows large volume at support, a typical reversal signal. The ultimate move in IOC would be a break back below the channel support, in which case IOC should head down to the lower channel pretty fast.

 IOC staged a breakout above support and failed.

 The MoneyStream Daily chart shows weakness in to the move up.

 Here's today's attempted breakout, there was a nice negative divergence at the attempt.

 You can see recent deterioration and a negative divergence at today' attempted breakout, it looks like a quick head fake move.

 The 15 min chart, especially at today's move, which looks very bearish in price alone.

 The 30 min going negative at today's attempt to break above local resistance.

And the 60 min chart falling apart fast.

There could be a little more upside, maybe another head fake move, but the risk here looks reasonable with a stop in the $62.50 area (although the wider the better until it breaks back below the channel support.

Some evidence of 15 min charts turning

When the 15 min charts turn very quickly, there's a strong underlying move underway as these don't usually turn fast in a day. The DIA is showing evidence of that starting, although as mentioned it's been in the danger zone for a while.

Ideally the DIA would chop around a bit, maybe above the triangle in which it broke out from today while the 15 min chart falls fast. It is leading negative in the general position, there have been no higher highs today as it has a flat top and now it's starting to move down quickly.

Risk Assets Update

The market was getting ugly with the intraday momentum and now we are seeing the failure. Does Wall Street step in on more time to support it? It seems to me it's less effective and less worth the expense as most of the assets/trades we have been watching have already done what they set out to do, but you never know. I'm sure some of you are questioning, as am I, "is this the start of the break?" It's difficult to say because we've been in the danger zone for a while, but as I just posted, I have no problem adding to some shorts here like I did with PCLN minutes ago.

 CONTEXT continues to deteriorate from a supportive position early in the week to a negative position now which is getting worse, the underlying derivatives and assets in CONTEXT are likely the headwinds I mentioned.

 Commodities are moving in line, but they are negative, not as willing to price higher.

 HY credit was the cheap way to play the bounce, it started selling off yesterday and continues today, this is common at the end of a bounce.

 Yields are HUGELY negative, the market tends to revert to where yields are so this is one very bearish signal.

 A longer term look, before on previous bounces they simply started selling off earlier than the market, this time they didn't even participate.

 There's a little pressure from $AUD as it rounds over intraday.

 There's also a little pressure from the Euro as it didn't move higher with the SPX and seems to have topped first.

 In the mid term the Euro was supportive in the white box, now both have met at the mean.

 Here'a what gave the DIA that lift and the market with it, a dip in the $USD.

 High Yield Corp Credit has stayed with the SPX for longer than usual, but it was also making an upside shakeout of the shorts, this is the first time in the last week or so that Corp. Credit has given a clear negative -sell-off signal.

 You can actually trace the downtrend channel in Corp. Credit and see that it broke above the upper channel in a shakeout of shorts, it looks like that move is ending and HY Corp. Credit will make the next lower low.


Sector rotation is poor today, Financial, Energy, Tech are all weaker, only Industrials and Discretionary are in rotation with defensive sectors looking like they are ready to roll back in.

Adding to PCLN

Earlier I started an equity short in the model portfolio in PCLN, I like the price here to add, still it won't be too big as I'm tech heavy.

The loss of momentum

What I was trying to convey in the last update just out, was the look of the market as if it were an uphill battle, here are some interesting charts as that uphill battle lost more and more momentum.

 The spike in volume correlates pretty closely with that break above the DIA triangle mentioned in the last post, but look at the price candles where volume spiked, all long upper wicks which is upside resistance and they are bearish candles. This has more of a churning feel to it.

 DIA volume on a move above the triangle noted, again very long upper wicks as higher prices are rejected in the individual candles, very gappy moves.

 The Q's crossed the major first resistance area here, same ugly candles.

The IWM, again the long upper wicks on the candles and continued small bodied candles at what seems to be resistance, although it could just be a lot of selling.

Market Update

Once again, like yesterday afternoon, the market is losing momentum is what looks like a desperate mov to the upside. This doesn't look at all like an organic risk on environment, but rather like a struggle to move higher as if it were on a timetable with some head winds, I'll look at the risk assets to see what those headwinds are. As the candles get smaller and smaller intraday, it looks like there's been some more support anted up specifically in ES. After the risk assets we'll take a look at AAPL, but the momentum stocks like PCLN are using this time well to reach the maximum emotional levels we have talked about (fear for short, greed for longs). This is why the market moves in such extremes (other than the volatility associated with tops), the moves in the market are no longer about a discounting mechanism, trying to find fair value for a stock, but purely emotional manipulation, head fakes, bear and bull traps, etc. I wonder if there are any fundamental value investors out there anymore? If so, I wonder what their portfolios look like.

ES was losing momentum to the upside, 3C wasn't showing any support, rather leading negative, then there appears to be a move to lend support. It is only noticeable in ES.

The order I chose is first target areas, then midterm charts intraday charts to reduce noise, then the effect on the 15 min and finally what the intraday 1 min chart looks like.

 For the DIA, it has hit several levels needed to cast the April 10th move in doubt, the only place really it has left is a new high which would be good for bringing longs in, although from looking at the flow of domestic equity funds, it seems even dumb money is not buying the ponzi anymore. Note volume in all of these chart falling off.

 The 5 min here continues to look bad, the opening gap was a pretty decent sell area, we are at resistance in that same area with a bullish looking ascending triangle, it will be interesting to see if this triangle is a bull trap, the leading negative divergence continues as DIA reaches the opening levels. The price percentage gain in most of the averages is taking on a churning feel, although volume would need to increase dramatically, which could happen if we saw what appeared to be a strong breakout from today's triangle.


 The 15 min chart is a clear mess, at the worst level for any bounce over the last 3 months, but note the volatility of this bounce and how much further it has travelled compared to the previous ones, again a function of increased volatility and desperation to get that (what I firmly believe will be) one last shakeout move and bull trap.


 Intraday, the DIA looks to be one of the worst negative divergences, similar to yesterday in the DIA/IWM.

 IWM price levels and this is why I have thought the IWM is less important as the price levels are pretty far to get a real shakeout. The IWM is such a mess I don't think bulls would find any credibility in any move other than a new high. What is telling about the IWM is it should be the leader of a risk one move and outperform all of the other averages. Volume is also falling off here.

 IWM 5 min probably needs no commentary.

 The 30 min is in a leading negative position

 Like yesterday, the 1 min IWM/DIA are looking the worst. Do you see what I mean about the look of desperation in the move today, very parabolic moves up, but the candles are very small, no real strength in price when you view the actual individual candles, just a very thin looking market.

 QQQ I think need to at least break above the red trendline, AAPL is not helpful today. There's also a gap area in yellow that would be helpful. Volume is falling off.

 QQQ 5 min, much like yesterday in the IWM/DIA, look at how wobbly the price trend is filled with bearish candles, this looks a lot like those dog tail moves I mentioned in IBM that all failed with big gaps to the downside.


 QQQ 15 min lagged for most of the bounce since April 10th until we identified this 15 min positive divergence before AAPL earnings, it is still in line, so I'm guessing they aren't putting too much pressure on the Q's right now, at least until they break above the basic support line all of the other averages have crossed days ago.

 QQQ 1 min losing momentum in the 1 min chart.

 SPY, the $140 level was an accomplishment, the gap just above would seem likely as all gaps have been filled lately, volume is leaking off. If the SPY could fill the gap, it's not a stretch that it could make a new high. Imagine that, from a new low on April 10th to a new high the same month, that's volatility.

 SPY 5 min needs no commentary, note the struggle in momentum in the yellow box I mentioned as head winds.

 SPY 15 min

SPY intraday 1 min losing intraday momentum