Wednesday, July 22, 2015

Daily Wrap

It's days like today and op-ex pins, the dulls days for the most part or just dull days in general that are the most time intensive as far as work load because they don't have screaming divergences that are easy to see so they require a lot more work to figure out or confirm what we already know or suspect; in this case a dull, risky bounce that's probably not worth trading is probable.

This irrates me to no end because it's a lot of work for a much less meaningful move. For example I went through futures today (100+ charts) and basically found out exactly what I forecasted in yesterday's Futures Update.

Let me give you some examples (keeping in mind there are 100+ charts I go through so you'll have to take my word as to the trend as I don't think posting 9 different charts for each individual asset is anything you or I want to do or read)...

From yesterday's Futures Update:


 "The 1 min Euro Futures is the only chart that shows an intraday negative divergence in to its biggest move in 6 weeks to the upside (EUR/USD up), so this looks like an overnight/maybe tomorrow correction in the EUR/USD, it makes sense to assume the same for USD/JPY which again sets the market up for some excellent positioning in to some price strength ,  but severe underlying damage."
This is a 7 min chart of the Euro futures leading positive, absolutely no damage done to the divergence today and is pointing toward more price action in the EUR/USD such as we saw today.

Note the white hash mark on yesterday's Euro 7 min futures chart and the 1 min (newest divergence) already giving us signs it would be pulling back which would only make the Euro/Yen futures' charts stronger.   The point I was making overall was that a pullback in Euro futures and Yen futures was likely going to come down to the white hash mark, creating a stronger base for Euro/Yen to move up and EUR/USD and USD/JPY to move down, thus bringing the market lower.

Now take a look at the same 7 min chart of Euro/Yen Futures today.

 The same 7 min Euro futures with the white hash mark in the same area which Euro futures DID pullback to just as forecasted yesterday. Using divergence in the Euro I extrapolated the same for Yen - USD/JPY so now Yen 7 min Futures..

Again, the exact same pullback expected as of yesterday's analysis as both were heading higher and only showing small, initial divergence that played out so far today.

The Yen/Euro futures are positive through all of the fastest and intermediate timeframes, but what I'm really interested in beyond short term intraday or one day movement is what the highest probability is as you have seen, USD/JPY has been the motor driving the Index futures through this most recent bounce since about July 10th.

 USD/JPY (candlesticks) vs ES (purple) since the start of the bounce, note the correlation. Thus if Yen and Euro futures are putting in stronger local positive divergences on charts such as the 7 min, the short term effect is to support the market, the longer term effect is to send the market lower as Yen and Euro futures rise and $USD drop.

We knew all of this yesterday which is why I put a guesstimation of where Yen/Euro futures would pullback to today, thus supporting the market to some degree as we saw right before the cash open today.

USD/JPY in candlesticks vs ES in purple taking off after a flat overnight session just before and at the cash open with the USD/JPY's short term move  strengthening the longer term decline in the carry pair, while giving the market some very near term support in the meantime which is EXACTLY what we talked about yesterday.

However while yesterday's futures update gave us a god idea the market would try to bounce in the very near term with USD/JPY short term support, the thing that really matters is what is the pair most likely to do, what is the strongest divergence? I don't "HAVE" to go through 100 charts for that information, I just like to be as thorough as possible. U can find that probability on the charts that have the strongest underlying trend.

 $USDX 30 min leading negative

Yen futures 30 misleading positive. This means the carry pair supporting the market since July 10th's most probable direction is down and the market with it. I didn't need to go through all of the charts for a pretty good idea of what would happen as a more lateral, longer base in the Yen would be a stronger move down in the USD/JPy, but I do it anyway to get the highest probabilities and most detail. Today I simply confirmed EXACTLY what I expected yesterday which means a high probability of a short term bounce followed by an even stronger probability of a deep decline.

So, it's the same amount or more work for a very small move that I can make a pretty good estimation of.

In terms of actual Index futures charts confirming the EXACT same, which was already expected yesterday before the close, I simply look at the highest probability Index futures. While the intraday 1-7 min have short term positive divergence in them, something we expected yesterday and knew this morning before the open, the highest probability is simple...

 TF 7 min positive, nothing we didn't already know, a bounce in the average that has had the worst relative performance and therefore is the  most likely to bounce

 As for probabilities, ES 30 min negative-by far the highest probability, but again we already knew this , it had been developing through the bounce and more recently.

Dow-30 Futures 60 min leading negative.

I guess what I'm getting at is for the least meaningful move, a highly predictable move and a very dull market, it's virtually more work than determining the highest probability trade.

I still think a bounce is likely, but it 's far from the probabilities of the larger picture, in fact so far at this point I wouldn't even consider it a trade because of the risk involved, yet it's just as much if not more work.

The problems in the market's relative performance persist, they just flip-flopped today from the R2K being the worst relative performer to the best, but again that was something we saw and expected yesterday. It's the larger picture of the divergence in relative performance that is more telling for the big picture along the same lines s the dislocation between the Industrials and Transports.

Ironically for such a dull day, I had about 3x more emails than usual. Perhaps that's why I put so much effort in to a seemingly meaningless, predictable move. I'm not complaining, it's my job and I don't want something getting by me that I should have seen, I guess I'm just venting that a short term, minor market move or attempted move takes so much more effort than the big picture,  but it;s these small moves that allow us to best time and set up the big picture positions, for instance the one asset I haven't put any short calls out o is the IWM and the reason is simple, until now, it hasn't offered us a discount, a high probability/LOW RISK entry.

As I pointed out yesterday, the bounce in the IWM essentially crested last Tuesday, not giving us a low risk entry.

Since 7/10 when the bounce got underway, the IWM only had a +0.29% gain as of yesterday's close. The market gave us an overall negative signal after that which is where we want to enter new IWM/SRTY or put positions, but it didn't give the upside set up which was what yesterday's analysis was all about and today, we are looking much more likely to get that positioning.

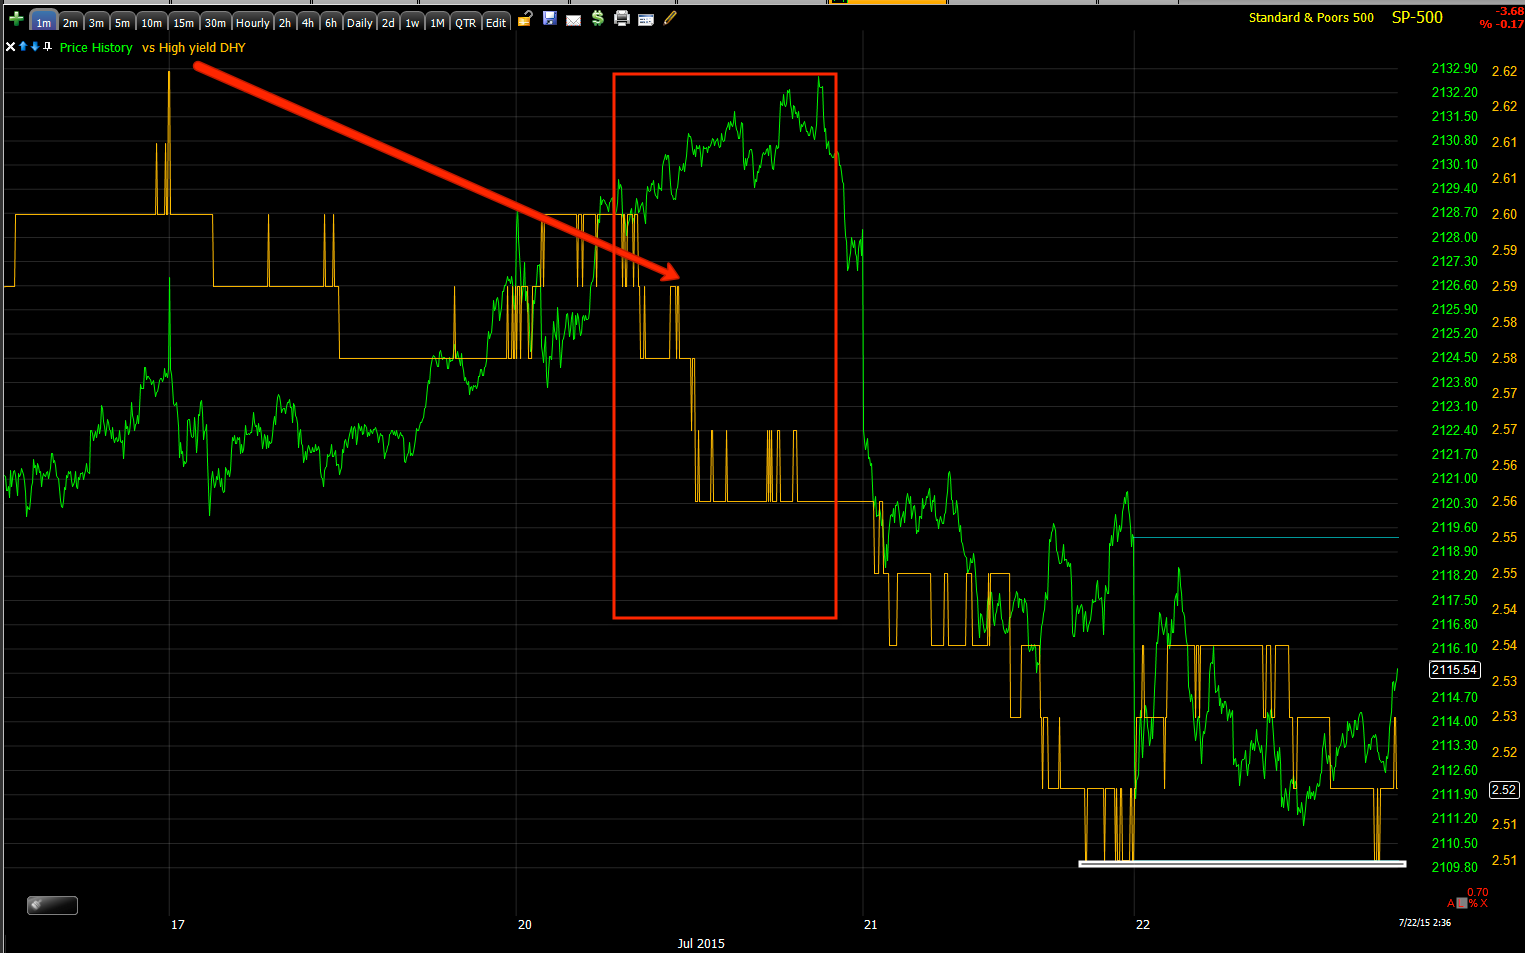
I showed you several levers pulled today, while retail may be buying the dip as my trusted real world sentiment sources tell me, it likely wouldn't happen without some support mechanism in the market and it's not pro traders, they are running the other way. HYG was activated today...
 HYG 3 min intraday mild positive divergence, enough to keep HYG from making a lower intraday low today and likely forming a small base.

However, no where near the degree it was activated just before the bounce as you can see in white on a much stronger 15 min chart.

As I mentioned, VIX/VXX were slammed today to support the market.
 VIX intraday vs the SPX in green. Remember I invert the SPX's prices so you can see the normal (approx.) 0.8 correlation with the SPX, VIX was hit much harder intraday today-just compare to yesterday.

And the same for short term VIX futures. 


Without these levers of short term market manipulation, I'm not sure the Buy the Dip crowd would have been interested in a market that would have been making more severe new lower lows.

Finally the 3rd lever, which a site hat I have some respect for was calling out earlier today as being the same Bond buying (yield declining) move that preceded yesterday's market decline. I showed pretty quickly that as usual, price can be deceiving and while I don't blame them for not being able to see what we see, I dd want to show you an additional lever being pulled in an asset that may be more complicated than first assumed and that's Treasuries/yields-today's post showing the move up in Treasuries and down in yields was likely not sustainable moving forward very near term-Market Update look for TLT in the post.


TLT 20+ year Treasuries (moving up means yields moving down and pulling the market toward them). Note the negative short term divergence in TLT, making it less likely yields would hold lower ground in the very near term, thus another lever activated.

Actually with HYG, TLT and VXX all activated, that's the typical SPY Arbitrage, or short term market support. This isn't a result of institutional support for the market, it's a result of smoke and mirrors.

Even Capital Context's SPY Arbitrage model couldn't pick it up today and that's because they are based on price only, so far as I know, no one else sees the data we see that leads price, in other words, everyone else is working off price only, we are working from the most probable move in price before it occurs, which would tend to support the near term bounce theory led by the IWM we were looking at all day yesterday.

Perhaps the easiest way to give you an update on the market can be accomplished with 2 charts, but part of what I hope to achieve is to give you the tools and concepts that I have learned so you can apply them to your own trading. I got quite a few emails today from members who took QQQ put gains and were very happy. While the appreciation for what I do is VERY appreciated, I suspect a lot of these trades that you are making on your own through the information we provide is due to your understanding of the concepts and that's ultimately what I want to achieve-to give you the tools to apply them as you see fit to your own trading style as there's no one right way to trade, but rather the way that's right for you.

In any case, I could summarize all of the above with2 simple charts of the SPY...

 The very short term 3 min positive SPY divergence pointing to a short term bounce and...

The longer term 30 min leading negative divergence telling us we are moving to stage 4 and when we break the SPX 200 dma, things will change and fast to the downside.

Breadth continues to fall apart in to an increasingly illiquid market full of retail longs, in other words, the primary trend bull trap is set.
I try to show you breadth charts on a regular basis as these are the hard math of the market, there's no weighting, no interpretation, just cold, hard math. While most breadth indicators were frozen in place today, here are two new ones showing more of the same.

 The Percentage of NYSE Stocks making New Highs less New lows on a Cumulative basis,

Note the recent sharp turn downward in the green indicator vs. the SPX.

And the Percentage of ALL NYSE Stocks Trading 2 Standard Deviations BELOW their 200-Day Moving Average. This percentage was around 2% just several months ago, now it's climbing rapidly and near 20%, nearly 10x more stocks are 2 SD's below their 200-day, meaning more stocks are declining faster and further.

I want to revisit the Treasury trade ideas, liquidity is drying up badly there and while that could be spectacular for a short squeeze, it could also cause a huge stampede for the exits while the exit shrinks because of reduced liquidity in treasuries. We'll take a closer look tomorrow.

While USO hit a new intraday low today, there's something that looks a lot like a head fake, although I don't see the volume, the charts look good.

 USO 1 min

USO 2 min

USO 5 min.

In addition as mentioned yesterday, there were a couple of longer term Oil Futures timeframes positive, today we added a couple more so it should be interesting as I suspect something is going on here that is looking interesting.

I had a few emails about VXX/UVXY today, I left those positions in place and I suspect the questions were regarding the VIX smack down, however, I'm not concerned at all with the positions for what they are suppose to be, a trade for the next downside swing.

 VXX 1 min in line intraday.

VXX 5 min leading positive with no damage.

And the beautiful chart, VXX 15 min with a beautiful rounding bottom and sharp leading positive divgerence.

The inverse of VXX is XIV, rather than trading against the market it trades with it so for confirmation we should have an opposite 3C signal...

And there it is, XIV 15 min leading negative divergence.

As for futures tonight, I'm not very impressed with the 1 min charts although the NASDAQ futures do have a slight leading position. As you probably know it's the 5 min charts that matter the most for new positions and they have been out of whack since this morning.

However "Out of whack" is not the same thing as impressive.

While I think the highest probability near term is a bounce, I would be lying if I said I thought it was a high probability/low risk bounce and I'd be misleading to say the 54 min charts are impressive.

This ES 5 min chart gives you an idea, out of whack, but not quite impressive and not the kind of divergence I'd buy even for a short term overnight trade considering how fast these charts can move.

Additionally as I went through futures tonight, I found the Yen and Euro charts to be improving as I showed above while the $USDX is in line. This will change and the $USDX should go negative short term as it has on the 15, 30 and 60 min charts. Meanwhile any improvement in Euro/Yen futures doesn't bode well for the future of the market and I'm not talking about weeks away. I have suspected we see a bounce (today and yesterday's analysis) as a gap fill or perhaps an op-ex pin, but I don't see this going much further than that, if we can get that.

Everything I see still begs the questions, "How would you trade this" and my answer is, I wouldn't, I'd be patient, if we can get a bounce worthwhile, I'd short/sell in to it with no doubt.

Have a great night, I hope I'm not giving you information overload on minutia, but I don't want to be the guy that missed that which the crowd missed, it's my job to find that which the crowd missed.

Have a great night.


Leading Indicators

Leading Indicators look pretty much as I expected, although I was again a little surprised that to pull off a bounce (which is nothing unusual even for stage 4 decline as there are about as many up-days in a full-blown bear market as there are down days) they are pulling out all of the tricks to some small degree, the last one I just posted while I was going through Leading Indicators was the typical end of day Whack-a-VIX which we usually see when a market is borderline closing red/green, it gives that extra little boost to try to make it green.

I'll just put them in the usual order...

 This is the SPX:RUT ratio, which is based on the concept that the R2K should lead any rally. If you recall the days of the Great Bernanke's congressional testimony, when referencing the market he never used the household Dow Industrials or even the S&P-500 as a point of reference for his QE/Wealth effect which is some central bank distortion of "Tickle Down Economics". In any case, her correctly recognized that the R2K should lead any risk on event and that's why he always referenced the little known R2K (not a household name among non-traders) as his audience was the retail that were buying the bubble he was blowing.

In any case, the indicator is slightly positive as it should be wit the R2K outperforming relative to the other averages on the day.

Pro Sentiment predictably is not buying in to this as they sold in to the bounce off July 10th.

Here's a wider view of the same indication through the bounce.

And here's the same since the SPX's May head fake when the indicator first went negative and remained so until the base for the July 10th bounce.


 HYG is more or less in line, I showed the earlier 1 min positive divergence, but so far it's not leading the market.

 As for HYG through the bounce cycle until now, you can see where it fell off leading the market to the downside,

 This is the VIX slam I mentioned this afternoon, SPX prices are inverted so VIX should be at the same level, but it was apparently slammed lower which helps support the market.

 The same occurred in VXX as well for the same reason.

 As for 30 year yields, I addressed them earlier today, they are more or less in line intraday.


 On the scale of the recent bounce, this is what yields look like, again a much more negative longer term perspective.


 HY credit is in line intraday, but again putting the indication in context is important.

HY credit since this bounce began leading lower.

They are trying to hold the market together here for a bounce, whether gap fill or op-ex I don't know, but we saw this yesterday as well.

VIX-SmackDown Being Used as Well

I mentioned a couple of levers to support a near term/short term bounce including USD/JPY, HYG and as I'm going through Leading Indicators, they are whacking the VIX as well.

While this could be traded for a very short term bounce, you know my feeling about this and it not being a high probability or most of all a low risk area.

Market Update

As I said early on today, it's likely going to be a very dull day.

That said, virtually nothing has changed since and the base for a bounce/gap fill is still under construction with some slight improvement here and there. I'm getting ready to go through Futures and Leading Indicators so I'll add those in as well, but I'm really wondering if this was simply meant to be a gap fill as the market has been ruthless about gaps for the last several years unfortunately and/or an op-ex pin that's a bit higher being tomorrow is Thursday.

In any case, a quick look...

 The intraday TICK has improved a bit so I'm guessing we are getting closer to our bounce which really was something we started looking for yesterday.

 The 1 min SPY has improved a bit intraday.

 As well as the 2 min. If you recall, there's a positive divergence out to 5 min in the SPY, but if you remember I also showed the same chart in context of the wider trend and it's very ugly. I believe those were two of the charts I posted yesterday and asked, "How would you trade this?".

 The High Yield corp. Credit chart which has been declining and has been in line has a 1 min slight positive divergence so in addition to the USD/JPY bounce indications (market support) in yesterday's futures, it looks like there's some HYG lever pulling as well which tells us that this is a pretty darn weak market if they need that much lever pulling to get a bounce off.

As a reminder, the entire bounce cycle on a 10 min QQQ chart, deeply leading negative so I guess once again the question can be asked, "How would you trade this?"

I'll let you know what the other charts look like, but I don't expect any big surprises.


Trade Idea: USO /Oil

I was looking at the futures yesterday as I do everyday and a couple of oil charts stood out, they were toward the longer timeframes, but looked like there had been some additional improvement as I have recently believed that USO was seeing a double Bottom for a bounce, I still am not convinced this is the long term bottom I have been looking for, actually I'm not even close to convinced, but it would seem to me with the $USD coming down (even with some upside support for the market today in USD/JPY, it still should see a strong drop, I suspect that gives oil a nice boost considering they trade opposite each other.
The double bottom (small) with a head fake that I suspect in USO (daily chart).

The EIA oil inventory report confirmed API's data yesterday and came in at a build of +2.5 mm bbl vs previous of -4.3mn bbl, however there's very strong demand for gasoline as refineries are running at 95.5% of capacity which is more than a 6% increase for the same time last year and also shown in the -1.7 mn bbl decline in gasoline inventories vs last week at 0.1mn bbl build. It looks like stronger gasoline demand, unusually strong may make up for the build in oil inventories.

This was this morning's 3C chart reaction to the EIA and just after.
 USO 1 min 3C chart after the EIA report this morning at 10:30.

And the 5 min chart.

I kind of like the idea of something along the lines of a slightly leveraged long like a leveraged ETF, just watch the volume, a stop can be placed just below recent lows (I'd prefer a little room, but this looks fairly low risk).

In any case, we have an 8/21 $17 call idea out here at a partial/half size, I think I may just bring that up to full, but on a new position, something with a bit of leverage, but not too crazy would allow for some decent risk management here.


Market Update

I get the sense that today, from my perspective is going to be fairly dull. A counter trend bounce or a decent bounce such as the one since the 10th is worth trading in that particular environment, you may recall we had IWM calls and let go of them last week on Tuesday for a nice gain and despite what the rest of the market did, as of Friday, those calls weren't worth a penny more than Tuesday. I'm a big believer in not taking the , "Well lets see what happens" route. The IWM was showing good divergences and negative at that so in my view, taking the gains off the table Tuesday was the right thing to do if probabilities weren't pointing to further gains. Holding beyond Tuesday (IWM) would have been pure open risk with almost no god reason to hold so "Lets see what happens" was not a good idea.

As far as the bounce, which I think market-wise may have been best summed up by yesterday's futures post and more specifically, Market Update: IWM Can Still Bounce (excerpts):

"The charts since that dump look like this so the IWM can still bounce, although a few more of those and the bounce will be a lot lower....When I say the IWM can still bounce, personally this is not a trade I would try to be catching (bounce), it sets up the trade I would try to be catching, (SRTY dd to/IWM short in to some price strength)."
And so today, while we wait for a base to set up for a bounce, yes it can be traded, would I consider it a high probability/low risk trade (bounce)? NO. Does that mean probabilities are pretty high that most of today will be rather boring until/unless we get that bounce and then have an opportunity to short in to it? Yes.

Boredom is the killer of portfolios, patience is the builder of them so I'm just throwing that out there for your consideration. This does not mean that I might not run across something that looks interesting in the meantime, I'm just trying to anchor expectations a bit as I see it now.

I still don't see any action or lever pulling in HYG, which is a short term lever of market support/manipulation.
I think the pros are starting to fear the reduced liquidity more and more which is something I was going to mention any way.

Be careful with the assets you decide to trade, make sure there's enough liquidity. I've had some nice winning trades that I simply could not get out of without taking a wide bid/ask spread from specialists/market makers because there was no liquidity other than the last line of liquidity, but you're trapped taking the market price and the bid ask spread can be so wide in times of increased market volatility that a winning position can turn to a losing position just because of the wide spread as an effect of low liquidity, so be mindful of that.

As for the market, the bounce case was made yesterday in our Futures Update and specifically on the currency side of things, USD/JPY and EUR/USD.

 The "Dump" mentioned above is the USD/JPY as you see above from yesterday, today as we suspected on VERY minimal evidence yesterday in the Futures Update post, it looked like USD/JPY support would be nearby for the expected bounce which the IWM had been giving the best signals for.

This is a 3 min chart of the USD/JPY in candlesticks and Es/ SPX Futures in purple, not the sport and leading at that in USD/JPY, however I think this is because the market hasn't put in a reasonable base for even a quick gap fill bounce quite yet outside of the IWM which is today's leader in relative performance probably for the first time I can remember in a week or so.

As far as taking market related (market correlated) action, the only thing I really need to know right now is that the 5 min charts, unlike the NASDAQ futures' 5 min chart as of yesterday, are not leading negative.
 This is the NQ 5 min chart which was deeply leading negative yesterday, price moved in the direction of the divergence and right now it has a small positive which is less of a concern, really I'm looking for the negative divergence on the 5 min chart for new/additional positions unless you are interested in trying to trade a probable bounce, which as I said, I don not see as a high probability/low risk trade.

You might be wondering what all of the indicators on the bottom of the chart are. I decided to start using some additional indicators, one in which I developed a trading system around before realizing that you can't beat HFT systems at their own game and you need to be more of a detective, but it's still useful. The top is a Stochastics/RSI which can be useful for near term indications, the lower is Stochastics which is what I designed the automated trading system around and backtested it.

 I don't know if you see what I see, but this is a very long Stochastics period/setting and it takes some getting use to understanding how big the cycle you are in is likely to be and which timeframe is most appropriate, This is the 60 min chart of NQ/NDX futures.

However rather than use the indicator as normal as an overbought/oversold indicator, I use it the exact opposite of Technical Analysis and as I said, I use much longer periods that reduce the noise. The trading system (which this isn't, it's just an additional tool),only went long when Stochastics were pinned in overbought territory such as they are between the two white arrows and conversely only went short when Stoch. was pinned below 20 in the oversold territory, the exact opposite of how the indicator is generally used.

You can see this was a different time for me when I was more interested in trend following and knew a lot less about how the market works, how it's manipulated. However far beyond the indicator, if you take anything away from this, it's don't ever be shy about thinking for yourself and ignoring the textbooks, that's what gets a lot of traders in trouble, they rely on indicators and sop thinking, stop growing with the market and innovating.

As for the rest of the market update, Treasuries have been bid today, this sends yields lower and as a leading indicator, this is a bearish signal for the market. 

 30 year yields in red vs the SPX in green. This happened yesterday around 3:30, just before the market took a nose dive, you can't see it at the orange arrow because the bond market closes at 3 p.m., but Treasury futures still trade and they moved higher, sending yields lower and it appears to some that this was a warning of the move down to come although Yields are much more massively dislocated to the downside than what you see just here, I've posted numerous charts the last 4-5 trading days showing the transition. In any case, Yields are dropping again today on a bid in bonds and that would seem to indicate the same thing will happen today as it did yesterday.

The problem I see right now are bonds, at least very near term.
True, TLT (20+ year bond fund) is higher this morning, but look at the intraday negative divergence, thus the negative short term intraday signal in yields is likely to vanish, the short term one any way.

I see the same thing in Treasury futures...
30 year Treasury futures intraday 1 min negative divergence.

Thus the yields dislocation lower that some are looking at as they did yesterday, will probably be wiped out intraday as a signal. The much larger trend though is still in place. The bottom line is the market can and likely still is putting together a platform for the bounce we were talking about yesterday.

The TICK today has been fairly ugly...
Custom cumulative TICK Indicator today.

However when we take this in to consideration, a flattish base-like structure and then look at the intraday 3C charts...

 We still have intraday positive activity such as the 1 min SPY, it's not overwhelmingly strong which is why I wouldn't consider trading it right now, but it could set up a trade for sure as we covered yesterday-short in to any bounce.

 This is the 5 min IWM and it still looks the best as having had the worst relative performance through the bounce cycle starting 7/10.

Although as I said, it's not of concern as far as a move to the upside and I'd definitely want to short in to it if it can get off the ground. This higher probability 10 min chart of the entire bounce cycle shows a very strong leading negative divergence and no bounce is going to change this chart. So as I asked yesterday, given the information you have, what would you do?

I'd look for a bounce, I would not participate in it, then I'd look for the trade set up for shorts or puts depending on how far it can go and where the best opportunities are.

Until then, I suspect today will be a bit dull unless we find some other assets that are looking very interesting, likely outside of market related assets including most stocks for the moment.