Wednesday, June 12, 2013

Yesterday's AMZN, VXX and XLF P/L & Today's AMZN P/L

The AMZN, VXX and XLF positions were closed yesterday, I just didn't have time to get the P/L out.

The AMZN put closed today I knew I was going to have to take the loss on, you know my opinion of the market and I don't think this one was going to get much of a better fill considering decay before the 22nd.


The P/L came out to a +42.21% gain


This is today's AMZN put I knew I'd have to take the loss now, at the $2.11 fill the P/L came to -80%


At the fill of $.47, the XLF P/L was +42%


At the fill of $1.25, VXX's P/L came to +47%

Daily Wrap - HEAD FAKE IS IN ?

For the most part I don't think I have to regurgitate what everyone already knows about the market today, we're interested in what the crowd missed.

Talk about volatility, how about that overnight ramp and gap up? In the "Pre-Market Update", I said, 

"My gut feeling is this does not hold, just because of what I see on the 1 and 5 min charts and general market behavior, if that be the case, we may end up here on a close any way, it would be one VERY volatile day."

The next two posts I added to my view that this gap up was noise, it was noise for a reason, I don't know why, but noise that wasn't going to hold as I showed over the next 2 posts and 6 minutes.

"ES Getting Worse" & "Compare ES Charts"

It's pretty incredible that a move that took all night to produce a significant gap up on no news, no market correlation whatsoever, failed so miserably and so quickly, as I said a few times today, "It almost seems like a test run".
This is the gap up is the SPY, it didn't even hang around, it failed immediately even though it took 12 hours to produce.

I don't know how many times in the last several days I have said, "We are expecting a short term move down, but that doesn't mean it won't be strong or impressive". Today I would say could clearly pass for at least the start of that move, perhaps the entire move. This is all still psychological, the stronger the move down, the more shorts that will chase the market, the more shorts we have, the better a bear trap / short squeeze to the upside works.

Today looked like this in the context of expectations...
I think everyone knows what the Technical Set up or trap has been since the triangle, if you are a newer member or not quite sure about what technical traders see here and how they react and how Wall St. is taking advantage of that, then shoot me an email.

Note the volatility in the triangle area as well as the increased volume. The Yellow arrows are the bait for retail traders, they are a test of resistance that has failed which means the SPY is a short in their view of Technical Analysis (I agree by the way, it's just more a matter of when and where or details as they can make the difference between a successful position and a losing position that was right).

The Technical concept of "Price Confirmation" means that probabilities are not good enough for most retail traders, they want an actual lower low or price confirmation which causes them to chase moves often leaving very little room for corrections and wide stops (higher risk). The red arrows are the price confirmation, as I said last Monday when describing what I thought would happen, I laid out the scenario which has happened and said, "Wall Street will give them the moves they need to enter the trades", for Wall St. these moves and set ups are useless if no one participates.

In last night's  daily wrap, "Insane Volatility" I showed you a a number of assets that projected how bad the big picture truly is and a number of short term assets that looked like, well as I put it in the case of several Leading Indicators, " I have to wonder whether this perhaps reflects the expectation of a quick move down like AAPL breaking below its triangle and a quick upside reversal, that may be the message HY credit is sending us."

Obviously we got the move we expected in AAPL yesterday , as I have said all along about this move, "I can't say how long or strong it will be, but it should be the shortest of the 3 trends (this being the first from where we were as of yesterday's close". I also said, In my opinion, the bear trap / Short Squeeze works best if the reversal process is more of an event than a process", (the opposite of what we normally expect and see).

There are already some interesting developments that suggest this "reversal event" may in fact be what we will see (This is why I wanted to get most positions for the next move either started or in place before the close today).

For example, take a look at the fairly extreme movements in Index futures, not only in today's regular hours, but in after hours...

 ES (SPX E-mini Futures) 1 min, the same chart that told me the highest probability of the gap up would be that it fails and that was posted in pre-market before the gap up even made it's highs on the open.

The white arrow (positive divergence is what occurred during regular hours today, the yellow arrow represents a rounding (perhaps) reversal "process", although tight and the white square on the time scale shows where regular hours ended and the leading positive divergence in ES that has continued to build tonight.

 Here we see the same in 1 min NQ (NASDAQ 100 futures) and to the ;eft we can see the premarket negative divergence that told me the gap up would most likely fail as it did, the after hours divergence tonight is impressive thus far.

Finally this is the 3C 1 min chart of TF (Russell 2000 futures) with a tight range like the others that seems to be toward the bottom of a rounding bottom and a leading positive divergence.

This is the ES 5 min 3C chart...
I don't show this to illustrate the 5 min leading positive divergence which is what I expected as I made clear since last Monday on a move down (a psychological game used against retail), but rather I show it to illustrate the scale and proportion of a tight, but still a "U" shaped reversal process. This could indeed be the kind of move in the morning that is most effective in producing a panicked short squeeze and it still has a "process" to it, the leading positive divergences above show the process is under way in 3C and this shows how it is underway in the "U" shaped bottom, although tight.

I can't guarantee or even show you anything right now that shows a high probability of the USD/JPY moving higher, it may come as the Japanese session unfolds tonight, but assuming the correlation is still holding, the pair would need to move higher in support of the market.
This today's intraday SPY/Yen correlation, it's pretty tight, near 1.0 most of the day except the close, note the Yen falls the last hour or so and the SPY fails to move higher, if I'm thinking like a Wall Street Crook and I have every intention of causing a short squeeze, I want all my bears in place and a close at the lows looks a lot more bearish than an afternoon ramp.

What I can show you is the same thing as yesterday, former Carry Trade pairs like the EUR/JPY and AUD/JPY that were there with the only one left, the USD/JPY, seem to be ready to offer help to lift the market in the short squeeze move we have been expecting to come out of this.

AUD/JPY with a leading positive divergence, if it moves higher, it supports risk and the market moving higher just like the EUR/JPY and USD/JPY which is now the main driver of the markets.

Is this what they have in mind? You know I have believed so based solely on market behavior and the way Wall St. manipulates Technical traders, it was only after I told you exactly what I thought would happen last Monday and Tuesday that I started getting 3C confirmation, that's how predictable the market can be only because that's how predictable technical traders (retail) are.

This CONTEXT model for ES suggests that's exactly what they have in mind.

The ES model is 30 minutes delayed, but as of 8:10 p.m. it had a positive 24 ES point differential between the model and ES, that's huge.

What is CONTEXT? " The CONTEXT framework attempts to distill the world’s ‘risk’ asset-classes (interest-rates and curves, credit risk, FX carry, commodities, and precious metals) into a single-measure that can be judged against the US equity market in order to comprehend potential mis-pricings (or technical flows and liquidity impacts). Institutional and algorithmic clients tend to use CONTEXT as a confirmation tool for positioning against (or with) a trend. CONTEXT provides a 24-hour-a-day real-time indicator of the world’s risk appetite and whether US equities are over- or under-pricing that risk."

In other words, CONTEXT is looking at the pricing of other risk assets that move when a risk on move is expected and models where ES should be compared to those assets, meaning smart money's positioning in Credit, Treasuries, commodities, etc is all expecting a move higher right now, it's only the manipulated market that is out of sync and typically CONTEXT is a leading indicator, it's telling us other risk assets traded by smart money are positioned to expect a significant move higher and ES/the market should move higher as well.

This is exactly what I have expected, up until this point, everything from the triangle to the failed attempts to overcome resistance to the moves down after to suck in shorts are all part of a grand scheme to effect a strong short squeeze and send the market higher.

Although we are not there yet, my expectation is that after a short squeeze we will create the exact opposite, a bull trap and when that triggers, the market breaks and doesn't come back.

If I were to do a complete "Market Breadth " post right now, you would see some of, scratch that, you would see the most extreme failure in market breadth that I think has ever been recorded, it's nearly a miracle the market is still alive and kicking. Breadth indicators are not interpreted, they are solid, real numbers and there's not getting around them, there's no ambiguity. Perhaps I'll get a breadth post out before we go down, I think it's worth seeing as it is historic, it just takes me hours to put it together. In last night's post, I showed you the bigger picture with several charts showing how disconnected Leading Indicators are from the SPX, also historic, you should take a look at them again when we get a short squeeze as the idea is to change sentiment so the upside move would have to be so strong that you yourself would doubt whether being short is wise, if you feel like that, you should bookmark this post from last night and look at these indicators again.

Speaking of Leading Indicators... Other than the Equity Index charts above with huge leading positive divergences, the move in AAPL today predicted yesterday and the huge disconnect between CONTEXT and ES, there are some other indications worth noting today...

 Commodities are not doing well because of the global economy, but the last day and a half there's a difference and it's not the economy improving, they seem to be leading the SPX as they expect a risk on move along the lines of a short squeeze.

Here's commodities vs the $USD so you know it's not that causing the move.

I pointed this out last night and the day before, High Yield credit (and not a very liquid one) has found support, it's behaving much better than the SPX, in fact it almost closed unchanged today, this is one of those CONTEXT assets that is clearly set up by smart money and it looks as if it is expecting something big because the low liquidity in this version usually makes it the first mover in any kind of fearful market.

 Perhaps one of the more interesting of quite a few interesting charts tonight is out sentiment indicator, as you  can see vs. the SPX (green) it has called bottoms before the SPX and tops, today it acted noteworthy.

Here's an intraday look at risk sentiment, right around the time we were getting positive divergences today, risk sentiment went way up vs the SPX, again telling us something.

This is why I wanted to be in position today for the move. 

How about Yields, the equity magnet,  they are calling the SPX higher.

As noted, they have been out of action for a while, but suddenly the former favorite leading indicator among currencies, the $AUD is looking as if it is expecting and ready to help with a big upside move in the SPX.

As pointed out yesterday, the Euro as well.

Beyond that, much of the evidence you saw in real time today, such as the 5 min SPY divergence which I said yesterday will have to turn positive as the 5 min negative is the chart that has defined the market's move down, it just so happens....

The positive divergence I said we needed yesterday popped up today, only after first showing a clear negative on the gap up this morning on the open.

Or the AAPL post from yesterday predicting the head fake move we'd need to see and how it played out today, the positive divergence tells us it's almost certainly a head fake as that means the move down below support was accumulated by smart money.

Or the price action and divergences in HYG credit of late...

There's just so much there, no matter how bad the move looked today, I try to always base trades off unambiguous data, not emotion, it was hard to enter many of those today, but that's what the data is pointing to.

If the Index futures are indeed building a rounding bottom overnight, then they are no different than any other asset at any other time, they should see a head fake move below the range that is pretty much established.

I'll check in on them before I turn in and if there's anything interesting I'll be sure to update you.

AAPL Update

AAPL was one of the key assets I believed would be part of a timing signal and specifically today.

This is the first AAPL post yesterday, "AAPL Update - Trade Ideas" other than this part about timing and what to expect,

"This brings us right back to the triangle, I'd say it is VERY likely that there's a head fake move that breaks below the triangle which would be in line with out shorter term trend expectations for the market, this is the head fake move we see before 80+% of reversals, it will allow Wall Street to accumulate stops and more importantly will use the new shorts as fuel to power an upside move on a short squeeze.

It is my belief that not only will an AAPL downside head fake move below the triangle match up with our current market expectations, but the reversal to the upside in AAPL will occur at the same time the market bear trap/ short squeeze occurs and AAPL's nearly 20% weight will help lift the NASDAQ 100."

The other important part of that post was the anticipated target for AAPL, I generally don't like guessing at targets, but AAPL has been hit so hard, it's difficult not to believe it can pull off at least a 50% retracement which would put AAPL somewhere around the $550 neighborhood, about a 120 point move and thus probably worth an equity position if you prefer not get involved with options.

The second post yesterday was more about AAPL being a sign post for the broader market, "AAPL a Bellwether?"  . Probably the most important part in this post would be,

"I would say with the trendlines moving to the next day the break in AAPL would be just under $435, this doesn't mean it hits $435 and just reverses to the upside, no, it could be quite an ugly breakdown, but the head fake move (we will have to confirm the break is a head fake, but I have strong reason to believe it will be)  is almost always the very last thing to occur before a reversal (to the upside with a breakout above the triangle in AAPL and coordinated with the market), this goes for virtually any timeframe you trade.."

The charts for AAPL today...
 Daily AAPL trend from the all-time high to the Primary down trend shedding over 300 points and about -45%. I have a 50-day moving average which is a crowd favorite, ironically this very clear triangle's resistance area sat at the exact same level as the triangle's lower support I had posted about yesterday.

So a break under support of probably the most common pattern in Technical Analysis would also coincide with a break under the most common moving average in Technical Analysis.


And traders care, here's the 50-day with a closer view, AAPL sees volume up on a break-through the 50-day, it sees volume just about double on the next break below the 50-day, the previous 4 days it acts as support for AAPL and today it is at the exact same area we are looking for a break below today as explained in several posts yesterday. Strangely though,  other than the volume at the actual intraday break, volume is quite light today all things considered.

On a 5 min intraday basis, here's AAPL breaking below the triangle's support, right around the $435 area as I guessed yesterday and volume swells on that bar.

The most important part of a head fake move is being able to confirm it's a head fake move and not just a break of support. First because of some of AAPL's longer term charts the probability of a head fake move was high before it even occurred, the fact that a symmetrical triangle was the mechanism everyone would be watching was kind of fishy too and as was pointed out to me, the 50-day moving average being at the same exact spot was just too much, I'd have said 90% chance of a head fake move yesterday.

Today we see the 10 min chart above actually moving opposite price as AAPL breaks below support, I'd says that's a pretty strong indication of a head fake move.

I also think it's a pretty strong indication of where the market is as head fake moves are often the last thing that happens before a reversal and we did have that strange overnight ramp which was not correlated to anything, not to news, not to the Nikkei, not to the USD/JPY, it almost seemed like dress rehearsal to see how hard it would be to ramp the market overnight to a gap up opening because today's sure didn't seem to serve any purpose.

Edit Re: VXX

Earlier I failed to mention you can use XIV to go short VXX with no leverage, you just buy XIV and it gives you 1:1 short exposure to VXX.

UVXY is VXX's 2x leveraged long, the  2x leveraged short for XIV is SVXY.

So I prefer VXX Puts in this case, but if you wanted the same position without options, you'd either go long XIV or SVXY depending on whether you want leverage or not, these volatility ETFs can really move.

Opening AMZN July $265 Calls Position

This is what I was waiting for...
This turn up in 3C is what tells us whether a move is a high probability head fake move or not, it seems it is.


Update: USD/JPY is Leading Even Further

I think we are very near or at an inflection point, the FX pair is leading higher and looks ready to go, the TICK has changed character, there are numerous Bellwethers that look fantastic.


GS Position

I'm VERY surprised by the signals from GS, they look quite strong, since I already have XLF calls open it makes GS hard to justify, I will however try a half speculative position in July $160 calls.


Going to Enter VXX July 22 PUTS

The equity trade is either short VXX or for leverage, SVXY long.

VXX PUTS Are Starting to Look Tempting

The ETF equity position to play VXX short other than shorting VXX would be the leveraged short, SVXY, 3x leverage, the opposite of UVXY.

Not moving quite yet, but I'm keeping a close eye on it.

USD/JPY Update

Remember that the USD/JPY is pretty much the main risk driver in the market, if the pair moves up, the market follows it, if it moves down, the market follows it.

Here's what it looks like right now.

 The pair has a positive divergence, a move higher should take the market jigher, fir this to happen the Yen needs to weaken and/or the $USD needs to strengthen.

Here's the Yen Futures...

We have a leading negative divergence so it looks like the Yen will weaken.

And the $USD, this positive divergence just makes the pair move higher.


XLK is Coming Along Too

XLK is the Tech Sector, obviously not for me with AAPL exposure, but if it keeps building like this it will  be a very nice looking, high probability, low risk position, especially if you trade equity, maybe a leveraged long ETF like TECL.

 XLK 1 min is jumping off the chart, it has the prerequisite head fake move in place with a stronger 3C move at the area.

Here's the 3 min chart so it's migrating (the divergence) which means it is getting stronger.

One has to wonder what the overnight run up was all about, perhaps a trial run for a short squeeze gap up?

Very Close To Opening AMZN July $265 Call

AMZN is looking very good in a couple of timeframes, but it could look better in some of the ones in between the 1 and 5 min charts I'm going to show you.

 Longer view of 1 min AMZN 3C chart, leading positive.

Closer view of the 1 min leading positive, as AMZN broke below support (this would be the head fake move), it looks as if the 3C chart is getting ready to move higher, if that happens I'll probably have to at least start a position there.

The 5  min chart went negative, traded in line with the move down and is now moving to positive.

I'd like to see the 2 & 3 min charts become more clear, the 1 min chart is what I'd call, "Jumping off the chart", but the more timeframes the better.

Market Update-Equity Indexes

I don't think I need to point out the divergences.

 ES 1 min

NQ 1 min

TF 1 min

GS

Believe it or not, for a quick trade (prefer options), Goldman (GS) looks pretty good. I already have XLF so it's not for me. A move below $161.75 would be interesting.

Here are a couple of charts.

 2 min

3 min

Out to the 10 min, 5 min is just as positive as the 3 min.

Closing AMZN June $265 Put at Loss

There's not much left there, I don't think it will come back, but I may open a Call, still watching.

Bringing AAPL and IWM Calls Up to Intended Size

In the case of AAPL, a move below $433.68 would likely be an excellent place to start or add to the position, it would represent an intraday head fake move. I'll try to set an alert for it so if it happens I can confirm for you ASAP.

The break today below the triangle would be the larger head fake move, but as I remind often, head fake moves are found on every timeframe just before a significant reversal, AAPL turning up intraday would be a significant reversal.

The same would apply to the IWM, not sure if we get it in that case.

USO

In my view, USO would make for a decent short in this area, I mentioned it earlier as well. I personally would not use options, but something like SCO (2x short Crude). I can't say how long the position may last, but I just feel better with a little less leverage here.

Bringing XLF July $19 Call position up to Intended Size

These still are not core positions in which I typically will have a non-leveraged equity position meant for the longer haul, the kind I'd like to open in to some strength next. Being these are leveraged, not core holdings, but rather trades, they are speculative to me, however these are less speculative than the last few this week which were meant for a very fast move.

I'm trying to get quality positions with some time and in the money, therefore these are near the upper range of what I'd allow for spec. option positions, I try to stay around 5% of portfolio value before any margin.

NFLX Add To

I already have an NFLX June $215 position open, I'll leave that in place and add a small (this is about half the size of a speculative position because of the already open position) July $210 call. I'm trying to add some time in case there's a longer trend than I expect, basically leaving some options open, no pun intended.

I think NFLX is probably even a decent equity long, I would think a move >$248 is possible.

Market Update/ Example

I'm using the IWM just because it was the chart I had open, not because I like it better than any other average, but with AAPL and XLF already, the IWM seemed a better choice than the Tech heavy QQQ and certainly AAPL heavy and the Financial heavy SPY.

 IWM 1 min as I started opening positions, screaming or jumping off the chart.

IWM 5 min, but still a possibility of a pullback and maybe better prices so partial positions.

Here's a close up of the current 1 min, it put in an intraday negative to pullback as I suspected.

As I add now, I'll likely be adding closer to my intended full size.

Also Opening IWM July $96 Call

Again, this is still partial for the time being. For the equity/ETF version, IWM is no leverage, UWM =2x long leverage and URTY=3x long leverage.

Adding the same Partial Spec Position in AAPL July $425 Calls

Again, I'm leaving room to add to these as I suspect we'll get one more pullback and stronger divergences, but I don't want to take the chance, this is not greed, this is based on VERY strong 3C charts, what I needed to see. If anything I'm being conservative.

I think AAPL could retrace up to 50% of the decline from $700+ so it is probably a workable long equity position as well if you prefer no leverage.

Be careful about having long QQQ, long Tech with AAPL as well.

Starting Position in XLF July 19 Monthly Call

The equity, leveraged ETF for this would be UYG for 2x leverage and FAS for 3x long leverage.

Change is HERE

The market Averages are leading positive very strong now on the 1=-3 min charts, this could be the start of the reversal, this is the 3C charts jumping off the page, even if only intraday so far.

I don't know if the charts will pullback and create a larger divergence, but I'm going to start opening some long call or leveraged ETF positions, they will be in the speculative range, about 1/3rd of a normal full size core position, I will only add partial positions right now, I'll wait and see if the divergence is longer lasting to add to more.

I'll call them out before adding

Market Update

Charts are moving quickly as I'd expect at this point of the market, but if we are to get a fast trap / short squeeze, then it will move even faster.

It takes some time to capture and upload these charts so they can change a bit, but this gives you a general idea of where we are and what we still need.

As far as giving bears confirmation and the chance to get in to the market as yesterday they didn't have the best opportunity, this morning's gap up which had absolutely nothing behind it other than pure manipulation, no news, no data, no correlations, it seemed to be there for one thing only, to give shorts a second chance to short at a higher level as they may have missed out yesterday. That makes the SPY look like this.
 In yellow we have the failed tests of resistance, this would be one of the most basic set ups you would find in a 25 page "Getting Started in Technical Analysis" pamphlet from 1998, that'a how obvious this pattern is and I haven't seen a true one work for well over 5 years at any important place- Do you get my drift?

The yellow arrows are the failed tests of resistance, but traders want price confirmation (a break of support or lower low before they'll pile in, the red arrows are the confirmation days.

Now the progress of the major averages, I'm not going to mislead you, it's slow going, but these things can change very fast, even before I finish posting this update.

 SPY break under the triangle 2 min chart, you can see accumulation and distribution areas

5 min chart is what defined the downside move expected in the market so until this chart is repaired, I'd say we will not see a short squeeze, this is the Maginot line.

SPY 15 min overall is in good shape, but it still can't do much until the faster timeframes align.

DIA 2 min, there's some progress, it isn't jumping off the chart yet.

DIA 3 min has some more progress, better looking, but not enough on its own.

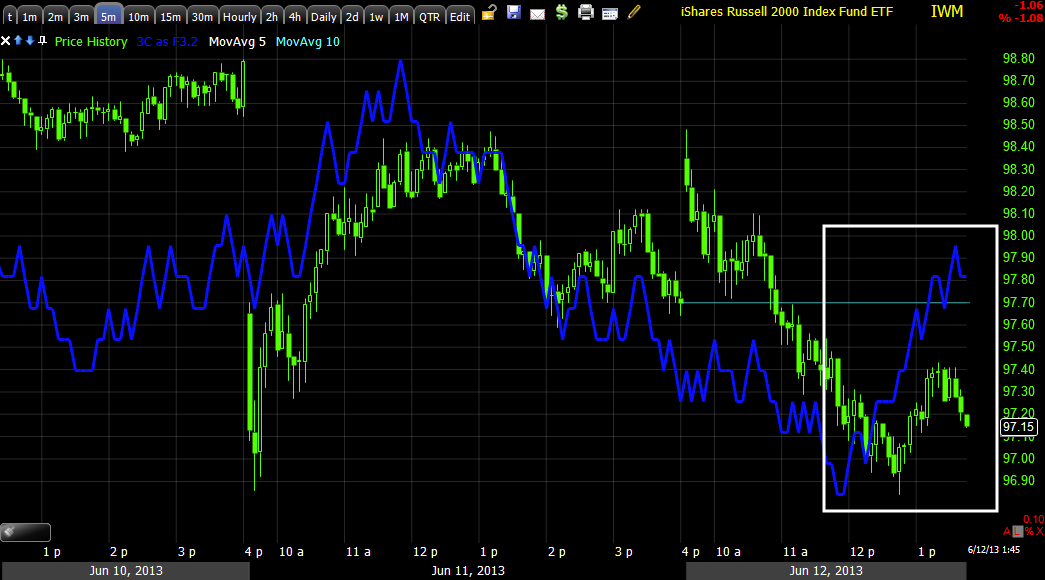
 IWM 1 min shows where there seems to be an apparent range os accumulation/positive divergences, I highlighted it on the price scale.

 The same with the IWM 2 min chart.

And the larger IWM 15 min chart, it's in good shape, but again, the short timeframes need to align, migrate through to the 5 min charts, repair them and scream or jump off the chart.

QQQ 2 min, again I highlighted the apparent accumulation range where positive divergences are, if you look close on all of these charts you'll see a clear negative divergence on the open this morning, a strange move that had ZERO support.

 QQQ 5 min , again the range in highlighted, glad I didn't enter new longs yesterday on emotion, it never works, it's only hard facts that give you an edge.

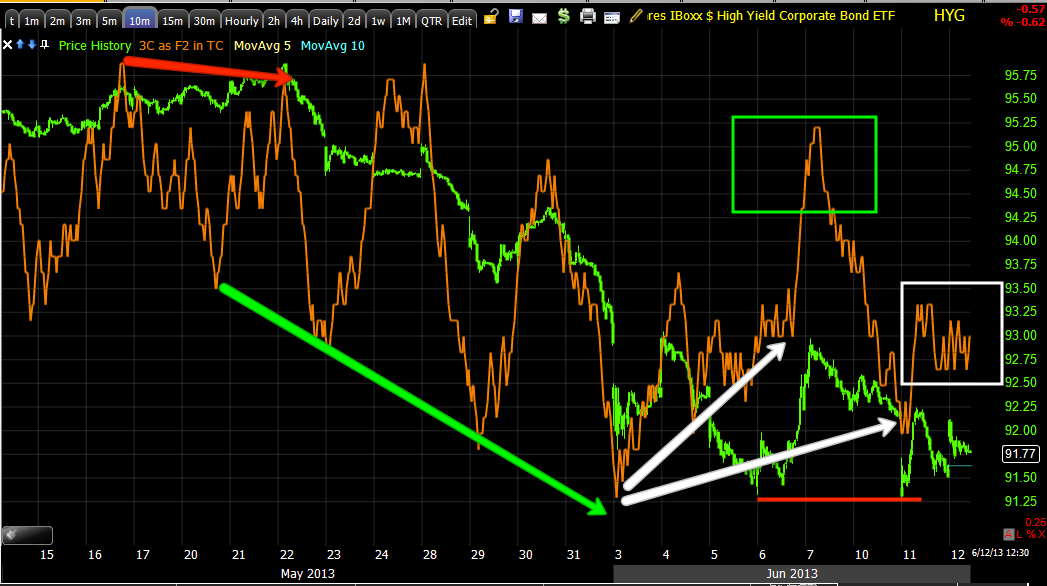
 HYG is interesting, it is an institutional risk asset, HYG "Should" be leading any market move to the downside, but as mentioned yesterday, something changed in HYG.

This is HYG in green vs the SPX, the difference in trend speaks for itself as a move down in the SPX, if it was real, would see HYG leading it, instead its leading on the upside.


 HYG & the support level I thought was key yesterday, the 2 min chart and positive areas at support.

HYG 2 min -note in green there is no distribution/negative divergence on the turns to the downside, it's as if they are keeping the shares.

 HYG 5 min with the same story.

HYG 10 min, same story.

HYG 15 min, same story. This is VERY significant.

 Note how much sharper the SPX is today vs its normal correlation with the Yen, it's almost as if someone wants to create the impression of a very bearish market, more so that other assets would account for.

 HYG (green) vs SPY (red), again note HYG holding up better than the SPY, Credit leads, just back up the chart and you'll see that on the downside moves and former upside moves so this is significant.

 TF 1 min (R2K futures) with a large relative positive divergence

 NQ 1 min (NASDAQ 100 futures) with a larfge relative positive divergence-interesting this formed overnight/

ES 1 min starting to lead positive (SPX futures)

 USD/JPY 1 min going positive-good for the market

EUR/JPY attempting to help

AUD/JPY attempting to help

 $USDX 1 min

Yen 1 min