Friday, September 23, 2011

More on CME

I just realized in addition to hiking margin requirement on gold, silver and copper, they also hiked requirements on the 30 year bond. Considering this hike didn't hit until after hours and the PM markets sold off on the open, something obviously isn't right in the world of fair markets.

In the last post I surmised that the leak, which is confirmed out of CME, probably happened overnight, but yesterday after the close I posted this, showing distribution that I assumed was profit taking in TLT, a 20+ year bond ETF.

Then today it looked like this.

Large scale distribution in TLT. And they always say Bond Traders are the most well informed!

CME and the Gold Margin Hike/Model Portfolio

Usually I'd be suspicious of the margin hike as CME as put out some really hard to justify hikes, particularly in Silver when Blythe Masters was waging her war to keep their inherited silver short in place and to the extent that the CME went after silver, it was ruthless. However the CME claims they hike margin rates when volatility gets out of control, not prices, this one time they may have been justified.

However, I do think there were circumstances that were causing this volatility. We are nearing month's end and quarter's end. Paulson and Co. have got to be down 50% or so on the year and redemptions will be flying in fast and furious. Out of their 5 man holdings, as I showed in a previous post, GLD was the only profitable position and a big position it was.

 Clearly volatility spiked in GLD in August-present with the ATR running around $1.75 on average and spiking to $4.70, so the margin hike in my view was justified.

Looking at a LN channel for the year, you can see massive volatility above the channel, it is my guess and we will find out soon enough, that Paulson's fund was taking advantage of highs in GLD to sell their position for the upcoming redemptions.

However, there was clear short term accumulation yesterday and the market dropped right off the open. There are "confirmed" reports that there was a CME leak of the upcoming margin hike, most likely overnight. The downside was accentuated by margin calls. SLV got hit a lot harder -5.14 vs -9.44 because it is a relatively thinner market and was included in the margin hike.

This is one of the reasons I rarely trade in the PM's especially now that the CME has consolidated power over traders because of the Dodd-Frank legislation that made OTC trading in PM's no longer legal so at any time, even if it is not justified by volatility and it is a matter of Washington trying to help JP Morgan not go belly up on a silver short, they can blast in to the market and throw a monkey wrench that few, even smart money, can see coming.

Im not sure I agree with the silver margin hike, look at the volatility as of two days ago.

 The red box was the 5 consecutive CME hikes in silver-volatility was trending up, but not spiking.

Copper was justifiable in my view.

Yesterday's trade in GLD was meant to be a short term trade, not a long term call to buy, we were looking at maybe a day or two. The larger trend in GLD shows someone was definitely a seller.

However, the 15 min charts were showing this move was getting overdone or oversold and it appeared that  smart money was stepping in for a dead cat bounce.
 Daily chart and a lot of selling causing the volatility.

15 min chart showing it was overdone, CME with their hike certainly didn't help out volatility today.

For those who want to accumulate a position in gold, there's a long term average that is has the highest probability and least risk, this is for long term holders of gold though, I have mentioned this many times and have thought we have been closing in on this opportunity over the last several months as gold's 3 chart over the long term has deteriorated.
The 150 day moving average historically has been the place to buy, but lately you only get 1 or 2 chances a year. We are closing in on that level now.

And here are the long term problems in GLD I have been warning about for months.
This chart is backed up as to not represent the recent volatility so you can see there were problems there before September.
Daily GLD chart.

In any case, gold will be worth watching for  swing traders and longer term traders and investors as it approaches the 150 day m.a.

As for my purchase in a 2x leveraged gold ETF yesterday, the loss on the position was about 8% and below my 2% loss of portfolio value.

This week the model portfolio still ranks #29 out of 16,211 at a monthly return of +74.28% vs the S&P at -5.65%. The weekly rank is 183 still in the top 1% and with a gain of 11.62%, again using no options. Maybe  should include an options portfolio? Considering the top performing hedge fund for the 2nd qtr of 2011, Corriente Advisors, did 17.7% with all kinds of assets at their disposal, I'm pretty darn happy with the rank and % return.  The average return for the top 25 hedge funds in Q2 was 8.33%, the model portfolio did better then that this week alone! Furthermore, to participate in one of these funds, you have to be a qualified investor, which means you have to have earned an individual income of $200,000 a year or a joint income of $300,000 in each of the last 2 years or have a net worth of $1 million dollars.

Then you pay 1.5-3% of your money under management to fees plus a performance fee of at least 20% and for the best funds up to 50%.

Have a great weekend, I'll probably have several posts up. Suggestions for part 4 of Understanding 3C?

Still think you can't beat the market?

And the Final Word on Gold and Silver's Plummet Today

A leak from the CME on an impending margin rate hike.

"Update: Yep - it was a leak of a margin hike as just confirmed."


And that's Wall Street for ya.

I have a feeling my gut feeling is right

I think we see more accumulation in the trading range. Certain charts are now going positive on the 30/60 min timeframes as well. It only makes sense if they are accumulating aggressively it is for a decent move and they can't accumulate a big position in 1-2 days.

Did the German Finance Minister Help Push Precious Metals Down Today?

I commented on his statements earlier in the news post, here's ZH's take, using one of those great Bloomberg Terminals.

I don't think the Paulson and Co. rumor can be excluded either, it is kind of a double whammy. As a matter of fact, this very scenario of Paulson selling GLD to meet redemptions was raised here at WOWS on Monday, August 8th, BE CAREFUL WITH GLD

HERES AN EXCERPT:

"The real ticking time bomb for GLD potentially is John Paulson's fund, his top 5 holdings include/included: BAC, C, AU, APC and GLD! It seems as if he has taken huge losses and likely closed the entire BAC position, the C position I believe is still very much alive. 


C is another short we have looked at and is down over 45% from the Jan/2011 highs. BAC he took a bigger bath on which is down about 56% from the January highs, even if he managed to offload most of the position or all of it, he still took a 40+% loss on it. Cramer Called BAC a "Screaming Buy" in early January, almost as bad as his buy Lehman call. THIS IS WHY I DON'T TRUST CNBC. Cramer's allegiance is to his Wall Street buddies and his call created the last rally in BAC before it topped and sold off, giving some Wall Street firms a chance to sell into the rally. Paulson's AU position is down 14% for the year and APC is about break-even. Should Paulson's fund need to raise cash/liquidity, which it likely will with redemptions, his only way of doing so in his profitable GLD position.


If Paulson liquidates his GLD holding's, GLD could be in for a nasty fall."

A look at some of the positions

Here are some of the positions from yesterday I used.
 BAC 5 mn, we saw a move up, but the 5 min chart is not confirming, these are some of the clues I'm looking for.

 However, BC 10 min is still showing a strong round of accumulation, this action thus far confirms my gut feeling I mentioned about a larger base being accumulated.

 FAS-Financials Bull 3x the 1 min chart s showing a negative divergence on higher prices-remember, this is a 1 min chart, it's not a reason to panic.

 TQQQ UltraPro long the QQQ shows a slight relative negative divergence, very slight. However look at our 3C depth accumulation zone, we are still very much in the area of strong accumulation, yet the bars in the trough are getting a bit deeper, I'll come back to this. This is no where near a distribution zone, just look at the bars to the left.

 TYH Technology Bull 3X- a 1 min negative divergence

 The 15 min chart which represents the longer trend and where accumulation accrues is still VERY positive.

 UDOW UltraPro Long Dow-30 5 min negative divergence and the bars in the accumulation zone are deeper.

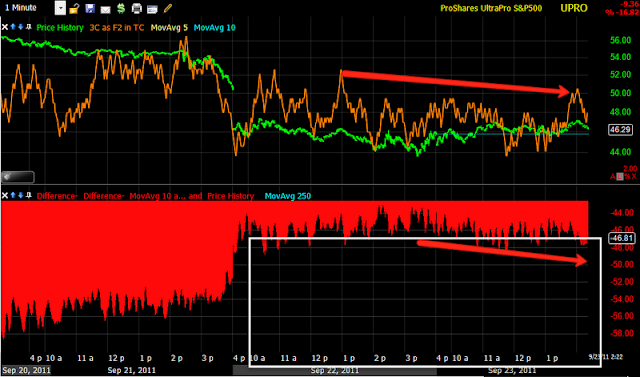
 UPRO Ultrapro long S&P-500- a 1 min negative divergence

 However the longer term 15 min chart shows how strong this area of accumulation is in how shallow the trough is.

 URTY Ultrapro long the R2k 2 min negative divergence

 URTY 5 min negative divergence, very slight, but these are the hints.

The 15 min bigger picture in URTY. This appears to be a very strong accumulation zone.

When I explained my gut feeling in the last post, I probably didn't use the best example, which had a big 1 day move up, followed by a new low that was also accumulated and then the move up. This I think is a better representation of my gut feeling. Think back to the days when market makers and specialists were an important part of the market before HFT came along. Part of what a market maker did was fill large institutional orders in the stocks they made a market in. The institution might say, we want 30 million shares of XYZ at an average cost of $112. The market maker would start accumulating the position, it would show up on the short term 1/5 min charts first, then that accumulation would accrue on the longer 10-15 min harts if it was strong enough. However, when the price of XYZ went to $112.75, the market maker who wants to retain the institutional business was now out of the target accumulation zone, so they would maybe have accumulated 15 million shares of the 30 million share order, what they would do is start to overwhelm the book on the supply side by selling some of those 10 million shares, maybe 1 million would do it, depending on the depth of the order book. 1 million share may be enough to knock XYZ down to $111 where the market maker could start accumulating again and by the time prices reached the average of $112 the market maker would have accumulated the full 30 million share position and if they were good, below the institutions average cost, then they got more business. If not, then another market maker got future business. So  think it will look more like the above chart.

Market Update...

It looks like the TICK chart divergence was right on as for intraday timing.
 DIA 1 min has been strong most of the day, the 1 min charts are part of the analysis equation, but the 5 min will be more important.

 DIA 5 min is lagging, first we have to see if it moves in to confirmation or if it moves lower, this will be important for the intraday/1 day trend.

 The 10 min chart suggests a good dose of accumulation taking place, it certainly could lead to more, especially considering the 3C depth charts showing this as some of the strongest over a day we have seen in over a year.

 The 15 min chart is leading positive, also a strong indication of a larger base.

 IWM 1 min has shown some positive movements since 1 pm but is still lagging, whether it confirms or not will be important.

 The 5 min chart is lagging badly, this is part of why I suspect what I wrote about in the last post.

 10 min is leading positive and strong-this represents a longer term trend then just intraday moves.

 The 15 min chart has continued to add to the leading positive divergence/accumulation.

 QQQ 1 min is also lagging

 The 5 min is leading, but shown a little weakness recently.

 Same with the 10 min, although this is still a significant positive,.

 The 15 min chart has added to the leading positive divergence-this is important to the idea of a bigger base moving forward.

 SPY 1 min has shown recent strength coming out of a very lagging area.

 The 5 min is hitting new highs, this will have to be watched for short term distribution.

And the 15 min is positive and about in line otherwise.

Gut Feeling...

 I have a gut feeling and I mentioned this yesterday that we may be building a bigger base then it seems. Look back at this chart of the DIA, we had a reversal down with accumulation of about a day, then shot up for a day, made a slightly lower low in price and continued accumulating. In longer duration trading ranges under accumulation this is what we typically see, accumulation near the lows, a move up, which is too high for WS to accumulate so they send it back lower, often on a head fake move like this one which broke resistance. This opens the door to a flood of retail orders and allows them to accumulate in the wide open as the "other side of the trade", no suspicions are aroused and then we get a move that is much longer and usually higher then the first accumulation period could have provided for. The bigger the base, the bigger the move up.

The SPY is in a bear flag right now, but short and margin interest which are still very high, have dropped from the extreme 2+ year highs of a few weeks ago. When all is said and done, a second period of accumulation should be able to easily move in to the bear flag. From there, my thoughts have been that we would see a new low before any substantial upside, however we'll let the charts tell us what to do.

I'll be looking for confirmation of this and if this is the case, then i would like to take profits on any decent run we get today or at least partial profits, likely enough to guarantee a break even trade on a move lower.

This is still a gut feeling, but one that has been fostering since yesterday. I'll update you as we go along and tell you if the scenario looks likely. For risk reasons I would prefer not to carry as big of a long as I currently have right now any way in to the weekend, especially with a government shut down looming. It may be enough to get Moody's on board the S&P downgrade rating of the US as the politicians are doing exactly what S&P downgraded the US for.

On GLD/SLV

You may see some intraday upside from these levels.
 GLD 1 min

 GLD 5 min

SPY 1 min

For long term holders and accumulators of GLD, this may very well be a spot to add.

GLD/SLV and Paulson and Co.

"This modest dollar weakness is doing very little for PMs - even as Copper and Oil rebound from their week-lows. We suspect the continuing selloff in Gold and Silver is due to the ever louder liquidation/redemption rumors at you-know-who."


You know who would be Paulson and co. This was a theory that we speculated about about a month or so ago.


I'm closing GLD related positions as a rumor is just as dangerous a the real thing and Paulson is down about 50% on his fund with the only profitable position being GLD. If they are getting massive redemptions, then that's going to be the only way to fill them.


As I showed on SLV, the 10 min negative suggested a drop, not a belly flop, so these rumors are becoming reality, not going to fight the tape here and now.

TICK Chart

The underlying conditions in the NYSE TICK chart are looking a bit better

SLV Hammered Today

Several weeks back I had decided to leave the PM's alone because they just weren't giving good signals, especially SLV. Recently SLV took up a new correlation, it was practically USO's shadow, not today.

 USO in green, SLV in red on a 60 min chart.

 Today's 12+% drop in SLV

 10 min 3C seems to have picked up on it, although like I said, the signals are weak, this should have been a 15 min leading negative on this kind of fall.

Remember the days of Blythe Masters silver manipulation? And then the unpredictability of the margin hikes. There have been a lot of questions around GLD/SLV, legal ones, like where's the underlying metals, are they leased or owned, are they accounted for, etc.  It's too bad, it seems there's so much underlying manipulation and confusion, especially in silver, they have really ruined a good trading vehicle.

Euro Pullback may give some answers

 SPY 1 min negative divergence-pullback.

 This is largely coming from the Euro pullback-FXE 1 min

 5 min chart of FX EUR/USD

A pullback should answer some questions, if the 5 min charts move higher, then we are seeing a bigger base being accumulated that would lead to a bigger upside move as I explained in the BAC post.

Lets not forget this chart.
The lowest trough we have seen since the announcement of QE2 in 2010. In other words, a very strong example of acumulation