Monday, June 10, 2013

UNG Update

I want to show you UNG today, which for newer members is an ETF for Natural Gas. I can honestly tell you that we were long UNG before anyone started talking about the surge in natural gas, in fact UNG has been a core long position, one of only a few and an asset that I expect to be a long term long position.

If I had to pick one long stock for a 401k that I couldn't touch for a year, UNG would probably be it, I believe it will undergo a long term secular trend change from bearish to bullish. Some of our members have already made over +50% in UNG and that's with no leverage and in an asset that is still firmly within a large base, in other words it hasn't even broken out yet to enter stage 2 mark-up where it can start a trend higher.

The key to our uncovering UNG probably a good 6 to 8 months before anyone started talking about Natural Gas was the same thing that got us long in FB after that disastrous IPO, for a huge winning long trade in FB when EVERYONE considered FB the "Most Hated Stock". What was the giveaway that we should be paying attention? Very simple, a subtle change in character of the stock's behavior. "Changes in character precede changes in trends"

There seems to me to be some obvious charm offensive led somewhat ironically, by politicians on Capitol Hill or should I say, "Capital Hill"? Did you know some of the most successful traders in the market are Congressional Staffers? Yep, they have the skinny before anyone except perhaps the "Professional Networks" that they likely feed inside information to, the same kind that is tearing apart the once "Could do now wrong", Stevie Cohen's S.A.C. which BlackRock (their largest investor) recently put in a redemption for all accounts.

I had no idea what would move UNG, I just saw a big base was building and then things started coming out such as the new EPA standard for any new Power Plant's emissions which make anything other than nuclear and Natural gas impossible, no clean coal technology will pass the new standards for new Power Plants. Then during Bernie's Congressional testimony, a Congressman asked Bernie about our Energy policy and if Bernie believed that Natural Gas was a great as the Congressman thought it was. What you have to understand is Bernie is about the last person to know anything about Energy policy and the question was totally off base from the subject matter, however the Congressman had his time to ask a question during one of the most watched events in finance and decided to throw a "Shout Out" to Natural Gas, he wasn't asking a question, he was getting free advertising time.

In addition, Natural gas is seeing more demand, not only as a fuel for trucks and busses (I saw a fleet of UPS/Nat Gas delivery trucks in DC, but soon many think NG cars will be the norm. Also there's a strong push to export NG to countries that will pay multiples of what NG is sold for in the US. On top of all this new demand, the Rig count to produce NG is at an 18 year low.

Recently I moved out of a significant portion of the core long position in UNG as I expected a pullback and wanted to add the shares back at a lower cost basis.

Here's what I said just last Friday in response to a member's question about UNG:

"I'd like to see this chart improve more (lead and move out to longer timeframes). With the last 2-days' range, I'd say before it even makes a move to the upside, it will at least break under the range and shakeout stops, even if for only an hour or two (these moves typically are proportionate to the base area)."

Here's the UNG chart since last Friday and this email...
Above you can see the range/support created last week by the "last two days" I mentioned and today the break under that range that saw increased volume as stops were hit.

So far the 10 min 3C chart for UNG looks good, as I said in the email above, I'd like to see this chart continue to develop with larger divergences moving in to other timeframes or at least strengthen the ones there.

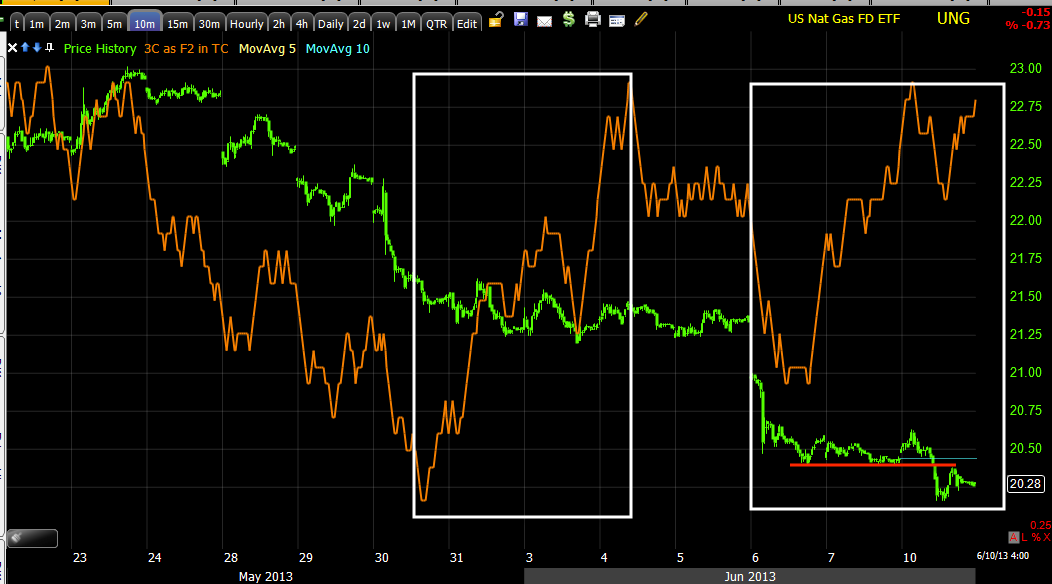
Head fake moves, which this appears to be as I suspected we'd see last week, often occur right before a reversal so I'll be keeping a close eye on UNG to consider adding back the full position size that was scaled back to protect gains.

I'm also interested in two Natural Gas players, CHK which Carl Icahn is involved with and LNG which has the terminals, license and partnerships to begin exporting Nat. Gas to countries that currently pay 2-3 times more than NG in the U.S.

To me LNG looks a bit over-extended and is probably a better candidate to consider as they move closer to the potential start of exporting and as price pulls back a bit.

CHK on the other hand seems to have undergone a decline, a base and looks to be close to a breakout, very similar to UNG itself in that context, right down to the price pattern. I think if we keep an eye on CHK, we can get in at a better price, whether you prefer a company or an ETF is up to you, I kind of think I might consider half and half as 1 position.

Here are the CHK charts.
 The daily chart shows a stage 4 decline followed by what looks like capitulation on volume, note the big head fake move in yellow, that was a 6+% move followed the next day by a -14+% decline, that's volatility as a trend is undergoing the late stages of change.

My custom DeMark inspired Buy/Sell indicator gave several signals, all very close, recently there's a sell signal that hasn't seen much downside.

Here's the 5 day version, so I'm thinking a decent pullback to the <$20 area would be an ideal area to consider a position.

From the 3C chart I think in the near term it's possible if not probable to see a head fake move above the white trendline, you can see obvious distribution on the most recent run up, but in the near term a head fake move would do a lot toward sending CHK to the <$20 level real fast, "From failed moves come fast moves", just look at the head fake move above I mentioned.

The 10 min chart has a positive divergence that has moved closer to in line so over the next couple of weeks, I'd look for CHK around the $23 area, maybe we can hitch-hike a ride down to the $20-ish area and look for a long position somewhere in the area.


Situation Update- Seems to be Resolving

This is one of the fun or stomach turning things about a market like this one where it is in the cycle process, things move very fast, surprises pop up out of thin air as emotions are lifted to the point of being "Frazzled" and there's a lot to learn about human nature and thus the markets or the markets and thus human nature, they are one in the same, the thing is you see all of this in a compressed timeframe.; what might take a month to see and learn under normal market conditions, you may see in a day.

I hate putting out posts like the last 3, but my job is not to tell you what I think will happen, it's to show you  what is happening and go from there. My opinion is irrelevant, it's the market's opinion that matters and that's what we are trying to dig up every day.

I would be remiss if I didn't  warn you of a situation that was developing (even if I thought it was just noise).

Here's what's happening so far as this "seems" to bee resolving to some degree, as for  why, I honestly don't know, but there's usually a reason.

 This is what the SPY daily chart looks like now, resistance was briefly overcome and then failed which is even better psychologically for this set up than resistance being tested, but never overcome like  last Tuesday. Ideally the deeper the close at this point, the better, a bearish engulfing candle would be ideal.

However, I don't have the depth of the book, I don't know where the stops are, how well the bears are swallowing the hook so there may be reasons for what went on that we can't understand.

What matters most are the 5 min charts as they are where the highest probabilities are for this bear trap continuing to develop.

The USD/JPY (which the market typically moves with) was the initial source of my concern as it was leading positive on a 1 min chart, it has come down since then, it's still not really bearish, but better than continuing to move in to more positive territory.

We should remember this is only a 1 min chart which is typically only intraday movement, but whenever a new divergence or trend starts, it usually starts with the 1 min chart and works it's way through the longer charts as it strengthens so any change has to be watched.

The Yen is now starting to lead positive which is probably why the USD/JPY's positive divergence started to deteriorate.

 The IWM 3 min chart is about as far as the intraday positive went, as I said, new trends, even intraday will start on the 1 min charts, so...

The IWM 1 min chart has obviously degraded since my concerns were first posted.

The QQQ 3 min positive, very small, but there is about how far the divergence moved, again...

 The move to in line from positive is a step down.

SPY 3 min positive is as far as it went...

The 5 min is really where the highest probabilities and cleanest trend are, it is clearly negative with no question.

The 1 min chart has also started falling apart here so it seems whatever that was, for whatever reason, it is now resolving.

Full Market Update

This should give perspective to the EUR/JPY 1 min and some of the other averages confirming in the short timeframe, I'd say similar to a closing ramp.

First in Context for ES and in the SPY arbitrage, there are very few signs right now for much of anything, there doesn't seem to be any manipulation of any kind.
 As you can see, the CONTEXT / ES model is pretty flat, I'd call this a non-issue.

The same with the SPY Arbitrage, I don't think there's any manipulation to any great degree here.

Looking at VXX, which is VIX short term futures, which trade opposite the SPX/Market, their 2 min intraday chart looks ready to take off.

 However since this capture, there has been a slight 1 min intraday negative, again, like the USD/JPY chart, suggesting near term upside in to the afternoon, some of which we are seeing now with the SPX back above yesterday's close.

The longer 3 min chart has seen migration of the divergence which is good and is leading positive also suggesting it is about ready to take off as well, since capturing this chart, it too has shown a smaller intraday negative divergence that fits with the others described earlier.

The 5 min chart has migration of the divergence making it more reliable as a signal, yet this chart remains positive, in fact even more so than at time of capture. This suggests to me that as the EUR/USD update showed, the move to the upside intraday is just that, as this more important timeframe remains positive.

 The original set up or bear trap (discussed in more detail in last night's post) shows the expected, but failed breakout to the upside, it never materialized, sending traders to the short side, the first test of resistance and failure would get retail traders going short, especially as price moved lower the next day.

 Today's move actually worked out better than I expected, it did break above resistance and then failed giving traders even more confidence that there's no demand, since we had a move like that today there's no reason the market shouldn't head lower this last hour, that's why I'm puzzled over the 1 min positive I have been positing about.

 The SPY 5 min is where the highest probabilities are for the short term move and they are solidly negative.

The 15 min is solidly positive which confirms my expectations of a move down to bring in the shorts and then slam the door shut on them by initiating a short squeeze, ultimately sending the market much higher, but again this is just another set up for an even bigger move to the downside as explained last night.

One of the things that confirmed this for me today is the accumulation of HYG which is HY Credit and one of Institutional money's first choices to express a long position.

Here the 1 min HYG chart shows accumulation in to a flat environment

The 2 min chart has migration and a nice leading positive divergence, no matter how ugly the SPY's downside could get, it's clear smart money is preparing for a nice move to the upside.

 The HYG 5 min chart...

A close up of the same chart, again smart money is preparing for a significant move higher, via a short squeeze.

The 10 min chart shows the first positive divergence in this trend.

 As does the HYG 15 min chart, just like the SPY 15 min.

Longer term HYG is in no place to sustain any kind of upside move, as I said earlier, it's just a means to another set up and a means to a downside end of large proportions.

 As far as risk sentiment goes, FCT shows risk off as I'd expect.

HIO shows the same.

As do commodities.

This is the QQQ 1 min positive that fits with the USD/JPY 1 min positive, even though it is well within a much larger negative divergence.

 QQQ 3 min leading negative is the main divergence and highest probability on this chart, but the intraday chart still shows the high probability of an intraday move higher.

I just don't understand why it would be needed at this point.

Here's the IWM 2 min leading positive over all with a smaller intraday positive.

Perhaps I'm making a mountain out of a mole hill, but I don't like surprises so I have to keep track of all of this.

I bring this to your attention just so you know where we are in case I have to put out some charts that seem way out of place, I doubt it, but I don't want you in the dark.

I'm going to do some more checking, it seems some of these intraday positives are starting to break down so perhaps this has been a move to peg the averages in place for a few hours for whatever reason.

Quick Update- Intraday Bounce

From what I see in the USD/JPY 1 min chart, it looks like it is setting up fro an intraday (1 min timeframe) bounce, this isn't very significant, but it is strange to find it here.

There are several averages like the Q's and IWM that agree on the 1 min intraday bounce soon, like now. However there are more signals and signs of the move down we are expecting so I'd say be on the lookout for that move, in the next update I'll show you why it shouldn't matter, but also why it's a strange place for it.


Also a strange time, right before the BOJ meeting.

FX Update- keeping an Eye on This one

With the BOJ meeting coming up, I expect that will eventually be a short term positive catalyst, at least that's the assumption, that Kuroda will give the market more guidance and confidence on their QE program, however with almost all central Bank policy announcements, there's an initial knee-jerk reaction, and then the market typically reverses as it settles in.

I'll post the market update next which is very interesting, I just want to make sure there are no surprises as there are a few signals in Currency that have me watching close.

First the main risk driver, the USD/JPY.
 This single chart is the source of my concern, not overwhelming, but something out of the norm and I watch all of these things as close as I can.

For the market to move down (and I'll show you why it would and why that move would be contained in the next market update after this), the USD/JPY has to move down and this 1 min chart (the weakest, but also the closest to actually making a move, is showing a leading positive divergence, since the market moves typically with the FX pair, that divergence is signaling a short term intraday move to the upside, but it doesn't need it. This is why I'm curious about this signal.

 The more important USD/JPY 5 min chart shows the negative divergence I'm expecting based on the market charts, this is the short term move down to suck in bears I've been expecting, however somethings in the market have already happened today that would bring the bears in, again in the next update.

 Looking at the single currency futures for a hint, this is the USD 1 min, it's pretty much in line and not telling us much.

The 5 min is negative as I'd expect.

The 15 min is negative as I'd expect, this should help bring the pair down and the market with it.

The Yen 1 min has a small negative divergence right now, not very big and the $USD is in line so again this 1 min timeframe isn't saying much and it is where I have the concern over the USD/JPY 1 min.

 Yen 5 min has a large positive divergence, this brings the USD/JPY down which is what I'm expecting short term.

And the Yen 15 min chart is also positive at about the right size for the move I'm expecting, so everything seems pretty good except that 1 min chart leaves me with some questions.


VXX / UVXY

VXX and UVXY look like they're ready to get moving, which means the market should be moving the other direction.

Here's a look at VXX, again, there are no positives in longer timeframes so again, the move is capped, I'm not sure how far or how deep, but it is a move designed just to pull the bears in.

 VXX2 min is leading positive, it looks ready to break to the upside, remember it trades opposite the market.

3 min VXX is leading positive as well.

5 mins is about as far as it goes so there should be a good pop to the upside, but again it's capped, there's a reason for this move, to pull in bears, beyond that, there's nothing to really fear as far as our expectations go.