Friday, August 16, 2013

Market Bounce?

+60 ES points in the model vs ES, I believe last time it was something like a 45 point discrepancy and ES moved something like 43 of the 45 points.

This is really for entertainment value only, I'm not submitting it as analysis.

GOOG and MCP Charts

I'm going to just post the charts, a member suggested that I put up some charts for those of you using 3C and let you look at them over the weekend and see what you come up with and I'll post maybe Sunday as to what I saw.

However keep in mind I believe MCP has its own legs and can move more without the aide of the market, sectors or manipulation.

Symbols and timeframes can be found at the top of the charts.


MCP & GOOG Calls

There are quite a few I like, most were on the list I provided earlier, I was really on the edge of adding GDX puts, but decided to spread out a bit more in to some different area.

I'm going to go with a MCP Sept. $6 Call and GOOG Sept. $860 Call. I don't want to go too crazy as there are quite a few positions now (again mostly all on that list) that are just looking better.

The $USD is showing some 3C underling strength work back in, some of the numerous assets from Treasuries to VIX futures have made some moves (many since about 2 p.m. as expected that are kind of falling back in to line).

The SPY is making up quite a bit of ground quickly and the Dow has some great signals, but I chose these two not because of any of the reasons above, I chose them because they look to have their own legs, their own divergences. These will be speculative, although it will be a bit hard with GOOG calls because of the cost.


The Positions I like and May Open/Add to

GOOG Sept. $860 calls, this will be 1 contract, maybe 2 if I bite.

URRE I like but don't want to add anymore to the existing long equity position and

MCP I'd consider maybe a partial position in a $6 call

These 3 really stand out among hundreds of other stocks.


DIA Still has the Best Intraday chart

If I HAD to play a market average for a quick bounce, it would be DIA, it still clearly has the best looking short term charts, but it still isn't enough to convince me to take that risk.

XLE (Energy) / ERY 3X Energy Bear

I'd much rather wait for a pullback in ERY, I think we get one, but if I'm considering an equity short (XLE) or ERY long, the truth is I think is perspective of the bigger picture, a few percent here and there isn't the most important thing when viewing these charts.


XLE The Energy Sector (not just oil, all energy and services)
 The intraday 2 min trend has given perfect signals, it's currently in line with price action.

The 5 min trend clearly turned leading negative, I don't recall exactly when we got in to Energy short, but I'm glad we have exposure and I'd like to add to it at the appropriate area, I'm doing my very best not to jump the gun and give in to emotion over logic and hard data.


The 15 min chart is an extremely important timeframe, we see a lot "in line" trends in green, a positive in white, I like charts like this because they are very dependable, when something goes wrong or right, like this leading negative divergence, I know 3C has tracked the asset well and something is really going on in underlying trade.
 
 Remember XLF's 4 hour chart, it's big trouble.

ERY (3x Bear Energy) ETF
 The 3 min chart suggests a pullback so I'd perfer to try to wait for that, although as a brand new position I wouldn't have any problems with phasing in to this position, maybe 1/3rd to half here and add the rest at better prices, this gives you coverage and allows you to add at better prices, but this phased in entry MUST be a part of your risk management before you enter the first shares, it cannot be dollar cost averaging which is used to get out of losing positions. Here we are expecting a pullback followed by strength and making a conscious and responsible decision understanding that ahead of time, one is responsible, one is "HOPE"
 The 15 min chart from near perfect confirmation to an obvious accumulation zone in a perfect price pattern for it, a "W" like price pattern.

ERY 30 min chart looks fantastic

Remember how negative the XLE 4 hour chart was, look at the ERY 2 hour, it not only confirms XLE , but gives you some idea of what we expect on the upside.

XLE/Energy

I'm thinking about a USO short, I looked at XLE (Energy Sector) and it looks horrible, ERY (3x Energy Bear) is a position we have open, I'd be open to adding to it or even starting a new position.

It's up a bit today and I'd rather not chase it, but I'll try to get at least a few charts showing you what I'm looking at.


Currency Update

As far as "Something" to act as an engine for this market because it can no longer do it for itself, the SPY Arbitrage gave out as VXX gained ground and HYG lost it, even what TLT lost is not enough to make up for 2 of 3.

As for the FX carry, the USD lost strength and the Yen is gaining it, so there is no artificial driver in place right now.

 USD/JPY intraday has gone negative and lost upside momentum

Here's the negative in the $USD alone since the 9:30 open

This is the Yen alone since 9:30, you can see why the pair is not able to gain much lift.

Market Update

These have to be some of the toughest intraday market updates I've had to do, as far as longer term positions, core positions, it's now one of the easiest updates to do, the problem for many people is "If" you didn't set up these short positions when we had price strength and I know it's very hard to short a stock when it's trading at intraday highs and the averages are making all time new highs, then the problem right now is it's really not the best idea to try to play catch up, either you were building the positions and are ready or I think showing patience until we get to another high probability low risk area, and right now the only real difference is low risk, probabilities of market downside are high, but as I often try to explain, a high probability market outcome and a high probability trade that features low risk, an excellent entry point, etc. ARE NOT THE SAME THING AT ALL.

After most options positions are settled around 2-2:30 today, the market may make some very fast moves and changes to underlying trade, but the issue I see right now is the same issue we have had Wednesday afternoon, yesterday and now today, either the market averages are not showing great confirmation between them and/or the signals are not far enough along and aren't strong enough and that's especially true when compared to the downside probabilities. There are very few positions that are in decent shorting position here, YOU'D ESSENTIALLY BE CHASING THE MARKET AND THAT'S THE LAST THING WE WANT TO DO.


I can't say for sure if this is the hedge fund herd (as they do tend to move in a herd-like fashion, all buying or selling the same thing-no one cares about underperforming the market, but they'll lose their job if they underperform the herd so they are content averaging whatever the herd is averaging even if it's less than the benchmark SPX.

Or it may be that there will be signals, we just aren't there yet. This is an extreme market and a very unique one.

The DIA is actually one of the  better looking averages speaking on a relative basis.

The 1 min chart is leading here.

The 2 min chart is as well

Even the 5 min chart, but these are either not strong enough, or don't carry far enough in to effecting the 10to 15 min charts to some degree.

The 15 min DIA chart had been leading negative and it didn't take price very long to follow that divergence and the divergence is still calling for more downside.

If we look at this 2 hour, much more serious chart and deeper divergence, imagine if price were to move toward this leading negative, this is the risk if you are considering any market long positions for a bounce and the reason why I compare it to picking up nickels in front of a steam roller. IT May become worth the risk, I DON'T SEE IT NOW.

 The IWM doesn't look good at all, I can't find anything except some intraday positives on 1 min Futures.

You can see how the intraday 3C divergence led the IWM lower

 And the danger can be summed up even in the near term with this 60 min leading negative, price will follow this divergence like you saw above with the DIA and as extreme as the divergence is, it could happen literally any moment, I'm shocked it hasn't already months ago.

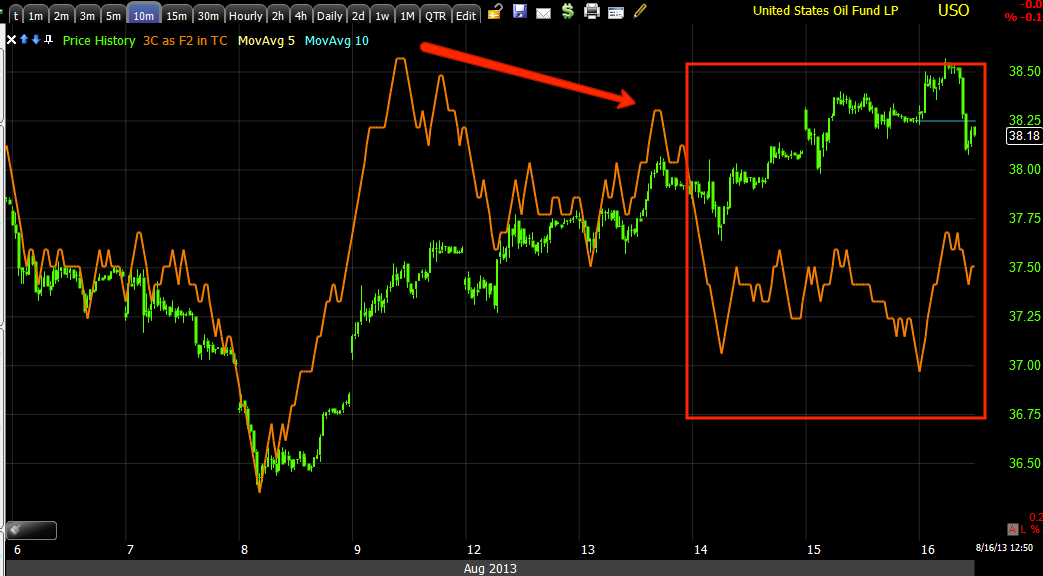
 QQQ 10 min has a relative positive divegrence, but...
This is the 1 min intraday that has pulled price right along with it, there may be a positive starting to form and now is the right time, but that's the truth of the situation right now.

And the risk...

I show "A" on this hourly chart because we have often seen negative divergences this size turn the market down, at "B" we have never seen such strong divegrences, this looks like the kind of 10 or 15 min divergence that is extreme that turns the market down so to give you perspective of how dangerous this market is.

 SPY 1 min is positive, it actually seems to be building more as I just checked again as we move out of the options pin, but...

Right now the 3 min chart and price action are perfectly in line.

The longer term 30 min so you can understand that price can fall on this longer chart just as fast as it did on the DSIA 10 min neg. divergence.

Things are moving so I'll be checking them and letting you know, I expect we'll see some very fast moves in underlying trade and price until the close.


Watchlist of Positions

Some of these I already have an open position, some I'd like to add to, some are new, but I'm presenting them all as potential (mostly short term possible trades, there are a couple that are longer term).

I wanted to get all of these in one place and before the 2 pm mark on op-ex day seemed like the best time to do it, so now you have a list of what I'm looking at and why, other than the positions that are already open, I don't feel especially comfortable opening or adding to any of these yet, but the point in this can change very quickly during the last 2 hours of the day and I don't want you to be blindsided by a sudden position announcement, at least you can come to this post as reference.

*Even though there are open positions in some of these, for the same of time and less confusion, I'm going to be treating them all as new positions as for many of you they likely would be.

The reason I'm not jumping at any of these now is the same as the market averages, strong confirmation. Honestly I don't know if the locals will put the kind of money in to even short term trades that usually gives us strong confirmation at this stage of the market, they may not be willing to risk much on any upside moves (some of these are downside candidates too.

Upside candidates, either Calls, leveraged long ETFs if available or equity longs.

*Obviously if we get signals that are strong enough to complete and enter any of these positions, there will likely be other positions in Sectors like XLF, XLK the market averages, etc.

MCP
 2 min strong leading positive

15 min with a possible head fake move which is excellent timing and on an important longer term chart. *This is likely yo be a longer term long if it is taken so I think long equity works fine.

GOOG
 2 min strong leading positive, has looked good for a couple of days now.

5 min leading positive divergence. This is meant to be a shorter term trade, I'd prefer using call options.

FSLR This is similar to MCP, I believe it has legs ot its own and doesn't need to draft the market like most of the other issues, for that reason I think this could be either an options or long equity position.
 1 min leading positive out of what is likely seen as a bullish triangle consolidation.

 FSLR 5 min leading positive

FSLR 30 min demonstrates the difference between a position like this vs GOOG long, GOOG is more of a short term (market bounce) while FSLR has more support on its own.

URRE also has legs of its own so I like it either as a long equity or options (call) position
 2 min leading positive, but a larger flat-ish range that is often used to accumulate.

5 min leading positive, larger than the first divergence before the first run and a nice looking rounding bottom process.

 URRE 10 min leading positive

URRE 30 min leading positive, obviously you can see the difference between a position like this and a likely bounce position.


Short Trade, Put Candidates either with options, leveraged ETFs in some case or short equity positions.

USO
 1 min leading negative at a possible head fake.

3 min leading negative

10 min leading negative

60 min leading negative.

This is one of the short position ideas that is longer term in nature and could certainly run in to the market's big picture trend. Puts could be used, I might prefer a leveraged short ETF to try to take advantage of a likely longer trend.


GLD - for now this would be a short term position, I prefer puts or a leveraged short ETF, but be careful with volume in such ETFS.
 1 min leading negative at a flat range.

2 min the same

5 min leading negative

GLD 10 min leading negative

SLV 1 min

3 min

5 min

GDX 2 min leading negative

5 min

10 min, I like this one a lot.

I'll let you know if any new entries come up.