Wednesday, June 8, 2011

DUST/NUGT Trading System

As always, I bring you the signals for the "Miners trading system".

If you recall the original system did very well, currently backtested over a 6 month period with the most recent trade, it' returned +74.60% on an equity line over the past 6 months. The second version of the system which I changed a bit to reduce the false trading signals has returned as of today 94.83% over the last 6 months.

The first system has earlier signals, but nearly double the losing trades. The winning ratio is 54% with a gain/loss ratio of 2.3x.

The second system has fewer failed trades, with a winning ratio of 65% and a gain to loss ratio of 2.0 (actually a little lower as the losing trades tend to run around -3.78% vs the first systems losing trades at 2.87%-I believe this is because the first system reacts a little faster, but also has more false signals because of that). The equity line for the second system is returning 94.83% over the 6 month test period with the latest trade-Incredible!

So here's your choice. The first system which triggered a long trade in DUST at $43.68 on June 3rd (vs the second system triggering on June 6th at $43.54) is now giving a signal to buy NUGT tomorrow morning on the open. The second system is still long NUGT as of tonight.

Both systems are outperforming some of the best hedge funds out there so there's probably not a wrong answer to the question, it's just a matter of preference and I've given you as much detail about both systems to make that choice.

So if you choose to take the first system's signal from tonight, you'd close out the DUST trade and buy NUGT on the open.

If you want to stick with the second system, then the signal is to stay long DUST at least for tomorrow.

The only other input I can offer is the 3C charts of both.

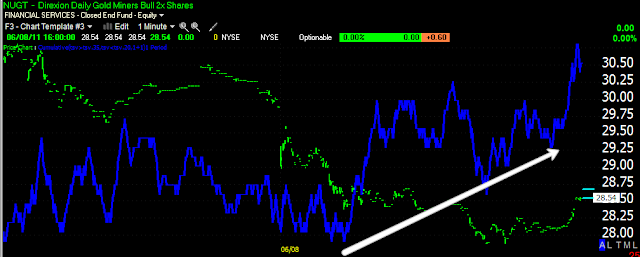
 NUGT 1 min 3C positive divergence

 NUGT 5 min 3C positive divergence

 DUST 1 min end of day negative divergence

DUST 5 min negative divergence.

Please remember that 1-5 min divergences are important, but distribution and accumulation can carry on past these timeframes.

Also remember that to take advantage of compounding, the trades in both should be treated as a separate portfolio, with gains from the last trade invested into the next trade.

Best of Luck!

Not Crazy About DUST's EOD trade

MARKET UPDATE

 The DIA 1 min has looked the best among 3C 1 min charts today

 The QQQ and SPY have looked the best among the 5 min charts today.


Perhaps more importantly, with volume the way it is heading now, it appears the DIA/SPY will put in a close down, volume up, which is most often associated with a reversal in terms of price/volume relationships.

I'll bring those to you after the close.

UCBI

For those of you that love that Cat and Dogs and what's not to love about a 100% 1 day move in a stock like WEST on June 1st and several others since, then you might want to keep an eye on UCBI-a financial.

This is a true C&D trade so it's speculative. That means risk management is a priority.

 Thus far it just took out the downtrend line on a slight rise in volume, but as I mentioned yesterday, it's the little things that you need to really pay attention to.

Here's the daily downtrend line taken out, there's one more hurdle at the $2.18 level which it is headed for pretty quickly right now.

A potential stop could be placed below the downtrend line.

FAZ

From the June 1st FAZ post

If you went that route, FAZ has returned 29% in about a month.

You saw the earlier XLF post. Here's a look at the inverse (short financials) FAZ.

 FAZ 1 min 3C struggling a little bit since 2 p.m.-around the same time the Beige book came out.

FAZ 5 min -looks eerily like the inverse of XLF.

 XLF 3C 1 min.

XLF 3C 5 min.
FSIN post on May 3rd was a follow up to the original idea in which we were looking for a dead cat bounce to $7.20.

 Here was the May 3rd follow up post, when we FSIN crossed 47.20-our target area for a short position. Since then, over the last 7 days, FSIN has declined nearly -22%.

However, if you missed the trade, I'd keep an eye out for any bit of strength in FSIN. This is the weekly chart and a massive top. There's a lot more potential downside in this trade so you really didn't miss the bus.

Based on the top pattern and measuring implications, FSIN could be trading near $1

As for our backtested trade system in the miners, it's produced a gain now over the last 3 days of nearly 13%!
Again, you didn't miss the boat. This is a trading system (long/short), there will be other signals.

From The Beige Book

Highlights  from The Beige Book prepared for the June FOMC meeting


"June 21-22 FOMC meeting added to the view that the economy is experiencing a temporary slowing."


Not to be sarcastic, but do thy have a crystal ball?


" Manufacturing activity is still up in ten of twelve Districts but slowing in some areas."


We've all seen the recent manufacturing data, the trajectory is headed for recession with all data series showing a sharp drop which if continued, would put the next round of manufacturing below 50 (decline).


"Inflation remains generally subdued outside of food and energy."


The two things every American uses every day. Beyond that....
Despite a 1 month dip, manufacturers have a long way to go to price stability. Compare this chart with the Fed's extraordinary accommodative economic policies.


" In general, selling prices increased only modestly, except for food and energy prices, which continued to escalate."


As for commentary, the next quote should sum this one up...


"Elevated food and energy prices, as well as unfavorable weather in some parts of the country, were said to be weighing on consumers' propensity to spend. "


Beyond that, the word "Japan" was used 25 times, "inflation" once.


I think we all knew that the tragedy in Japan was going to have downstream effects on manufacturing, it would just take a few months. It's here now and not likely to abate soon.

This is interesting-Financials...

 XLF 3C 1 min

XLF 3C 5 min.

The S&P isn't going anywhere without financials and if the market is going somewhere, it'll need the energy complex as well.

Market Update

 Most of the market has looked like this today, I can't say it's a huge surprise stops were run, the question is "where to now?"

So far the DIA is the only one showing anything positive. The Q's have a slight positive bias to them, the SPY is just in line, so we'll find out shortly if this was a fishing expedition for stops or we are simply consolidating right now for a move down.

The Beige Book came out at 2 p.m., I haven't had a chance to see what it has to say. I'll let you know if any of the averages start to show anything interesting.

USO is consolidating right where it should be, there's some minor improvement in the consolidation, but still a ways off from confirmation.

USO first target

We are more or less at the first USO target, the breakout area from earlier this morning.

 As you can see, 3C hasn't improved at all, it's actually hitting lows on the day.

 As for trade management, this trend channel is pretty tight and would take you out with a profit, it won't allow for consolidation which is likely around this area.

The 10-min trend channel is wider, it should allow for consolidation and still would take you out of the trade at break even.

AND USO JUST BROKE DOWN

If you faded the USO move at the last post, you can probably move your stop to the $40.15 level and have a nearly risk free trade.

Surreal

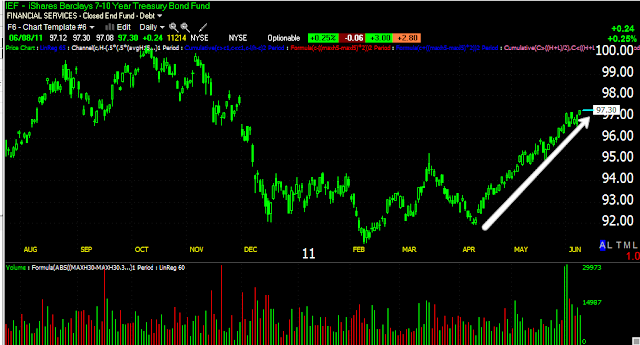
The Republicans are advocating a short term technical default, at least a fair portion of them, yet the Treasury has no problem selling its 10 year bonds, even in an environment in which the debt ceiling has been breached and there appears to be no resolution in site.

Today's 10 year auction just came in pretty amazingly strong. The yield was just below 3%, but more impressively, the bid to cover (the total number of bids received compared to those accepted) came in at a ratio of 3.23! Indirect Bidders (foreign governments mostly) took over half of the auction, that hasn't happened in 3 months!

What am I missing here? The US isn't sure it can make the interest payments, the only way it does so now is by dipping into government pensions, the debt ceiling is blown through, there's not apparent progress on a resolution to that problem and Republicans are floating a technical default, yet the 10 years are flying off the shelf?

7-10 year bond fund.

USO-Short

I know a lot of you are looking to fade the move in USO or take profits.

We didn't quite test the high, but there's also been no improvement. As for those who want to fade the move, I think the risk at this particular area is pretty minimal as a stop can be set a fraction of a percent higher then today's highs. TSV is also moving down and is now in the negative.

USO Update

 USO 1 min starting a leading negative divergence in the latest conolidation.

I'd really like to see USO test the highs,  that would give a much better picture of the situation, but I'm pretty close to considering a countertrend short.

SPY

The SPY and others look like they are trying to set up a short term base to rally from. The SPY will need to take out $129.50 if it wants to get anywhere.

USO Update

As I mentioned, USO broke out of a bullish consolidation pattern. Here are the current charts...

 USO is below confirmation, a bit higher readings in 3C and we'd have a pretty strong reason to be long USO for at least a short trade.

When I change the zoom to look only at the current move up, thus far it's in near perfect confirmation, but the previous chart has cast some suspicion on the move so it will need to be watched for improvement or a possible head fake move here.

I don't think it was any big surprise how the OPEC meeting went down. I had written about it a week ago. Iran controls the revolving presidency and is also the second biggest producer in the cartel. The Gulf States including Saudi Arabia, which threatened unilateral action yesterday (albeit they probably are lacking the teeth), are supportive of increasing quotas, IRAN of course was on the other side of the equation.

The Dollar

The Dollar is on the move again, I would say it may be exerting some downward pressure on Crude , but crude just broke out of the triangle I mentioned. We'll watch it for a false breakout.

In the meantime, here's what the dollar is looking like.
Up about .50% on a leading positive divergence.

Trading System-Long DUST

We got our signal Friday, bought Monday and thus far DUST is doing awesome, well beyond the backtested average winning trade.

If you want to try to enhance gains (because a signal will always have you 1 -day behind), you might consider a trailing stop of some kind, or you can just stick with the system as i which is returning probably close to 90% on an equity line right now over the last six months. That's about 400% better then some of the top hedge funds!

A Great Link

On of our members just sent this link that has the inventories report as well as many other key reports ad timely. It's an awesome find so book mark this one.

http://bloomberg.econoday.com/

USO Update-DOE

I can't believe how long it took to find the DOE report, if anyone has the direct link to the report on the DOE site, please forward it to me so I don't have to spend so much time looking for it in the future.

Crude inventories came in at a huge miss-down 4.9 million barrels on expectations of a 300k draw


On the other side of the coin, Gasoline inventories were up far greater then expected at 2.2 million barrels, I'm not sure what consensus was, but whatever it was, this was a big upside surprise.

Oil didn't see the typical 10:30 DOE parabolic move up or down and just continued trading in a range. I'm not sure what to make of this at this point.


As you can see, USO is consolidating in a triangle, the implication of the price pattern is a move higher. There's been a little improvement in 3C, but it's far away from confirming.

As I said, I'm not sure what to make of this, but I'd be careful about buying the first breakout without a tight trailing stop.

Are the Republicans Playing Chicken?

The idea of a "short term" technical default is gaining traction among Republicans, it's starting to appear more in the mainstream press. I have to wonder if they are serious about this possibility or if they are using it to force the spending cuts they are demanding without raising taxes?

A Technical Default for a Fiat currency could have immeasurable repercussions, after all, our debt is backed by the "Full Faith and Credit of the United States"-FAITH, nothing else, not gold.

If we cross that threshold once as a political ploy, what would make the world and specifically China think that we wouldn't do it twice the next time a game of hardball comes about?

As I have stated more and more frequently, the Treasury and Fed's answer to the crisis during the Lehman era was to make big toxic banks, bigger and more toxic. If one defaults or falls into a Lehman situation, I would hate to be in the country watching it all play out.

Market Update

 DIA 1 min positive

SPY 1 min positive

QQQ is in line.

As To OPEC

I suspect the Iranian presidency (in OPEC) along with the situation in MENA had a lot to do with the fact they could not reach a decision.

Yesterday Saudi Arabia said it would act unilaterally and increase production, but we already know that the last time they said that (when Libyan oil went off line) they never actually increased production. It's already proven they have overstated their reserves and may not have the ability to increase production. Furthermore, Saudi Crude is a poor substitute for the missing Libyan Crude, for those who used Libyan crude like Italy, it will take 3 Saudi barrels to get the same equivalent of 1 Libyan barrel due to the heavy sulfur content.

We'll see how USO reacts through the morning.

USO

These are early indications

 USO 1 min

 USO 5 min

Some unusual volume today thus far as well as the dollar being up a bit. I'm not sure I would trust this move in USO at this point. Perhaps some strength builds in behind it relatively soon, but it's not there now.