Friday, May 27, 2011

Week Wrap

Today we had a dominant P/V relationship and it made sense considering today's price action, it was Price Up and Volume Down which if you recall, after a move up like we've had the last 3 days into a very small candle today, would make sense. Both the Price Volume relationship and today's relatively small range, indicate trader's unwillingness to chase prices higher.
Today's small candle is typical of a short term reversal, which of course can lead to a larger move.

The P/V broke down like this
For all NYSE, Close Up/ Volume Down was nearly double Close Up/Volume Up, that's dominant.
SP-500: Close Up/ Volume Down at 322 stocks, again dominant
DOW-30: 21 Close Up/ Volume Down with 23 gainers
Russell 2k: 871 Close Up/ Volume Down with 1237 gainers
NASDAQ 100: 48 Close Up / Volume Down with 63 gainers.

As I pointed out earlier, the AUD also seems to be calling a reversal with a small candle and a divergent 3C chart.

Overall it was a tough week to have the opinion that the market wouldn't continue to sell-off after Monday's performance. Most traders would be short on a break like that, but I'm not making guesses, just following the chart.

After the break down on 5/23, as you can see, 3C was in a positive divergence. It took a couple of days to accumulate and that's the move we've seen since. The green arrow denotes confirmation of the uptrend. Usually when a 15 min chart goes negative, we are at a reversal. Based on today's action, it seems the most likely outcome for Monday would be at least a gap lower. There's still enough potential in the 3C charts to make a move to SPY +$135, but we are certainly getting close to a downside move.

What I found strange today was the broad based weakness in commodities with the dollar taking the hit it took today.
Commodities should have performed better.

Another view of the dollar also supports the ideas floated today about a pullback in silver, a downside move in equities on Monday and some other calls. Take a look at this late day chart in which UUP ($USD index) went into a leading divergence at 3:30 p.m. and kept going from there.

Other then the last 30 minutes, and really the divergence wasn't really strong until the last 10-15 mins, UUP was in confirmation all day.

The Euro, which we would expect to have the opposite reaction, did, and did so around 3:40 p.m.

As mentioned, strangely considering the dollar, oil made no progress.
USO 5 min-flat today.

As for Silver...
 SLV hourly 3C looks like the trend is not over, however, I do expect to see volatility within the trend.

 This 10 day average is an ideal pullback point

There was a positive divergence just before 3 pm and SLV gained a bit, it closed into a negative divergence.

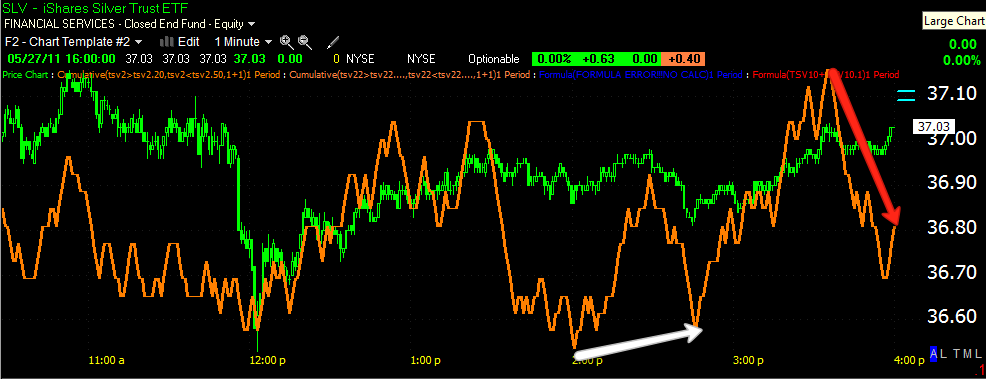
PSLV is showing what looks like a pullback coming along the lines of the target above.
PSLV trend in confirmation (15 min) at the green arrow and a negative divergence at the red arrow. This would make sense with a rising dollar.

Some shorts that have been setting up...

DB
 DB triangle top, which has broken down and bounced a bit. This volume spike looks like a bad print, but DB is setting up for a short.

Here's DB's 10 min chart, there was a small accumulation zone and since it's gone negative, so this should be a decent short trade. The downside target is at least $50 which retraces the Q1 bearish ascending wedge. The target is based on the triangle top, but it fits well with the ascending wedge as the measuring implication for a wedge is a retrace of the base, also in the area of $50.

FSIN
 This is a large top, the target on this one is close to $2 based on the price formation. This is a Chinese company and there have been numerous frauds out of China so if this is one of them, the target would make sense.

 When originally posting this idea, I wanted to see a good bounce, we got that bounce yesterday, today it formed a Harami reversal or inside day so this one is looking good as well. I know many of you have emailed me about this one so we'll keep an eye on it.

FSIN saw no accumulation in its bounce, a true dead cat bounce. Today 3C went into leading negative divergence.

Financials
 This is XLF's top with a cumulative volume indicator I created. If you trace the rise and fall of volume in the top, you will see it rises on declines and falls on rallies, this is exactly what we are looking for in a top.

 The daily 3C chart looks horrible

And the 15 min chart went into a leading negative divergence today.

Many of these charts had dramatic changes today and toward the end of the day. It seems like the market is back to aggressively de-leveraging risk in commodities and equities. For every trade, someone is on the other side of the trade, so what we are seeing is Wall Street money flowing out and retail getting stuck holding the bag.

FAZ of SKF are both good options if you want broad industry coverage and leveraged (3 and 2x respectively). They are also good choices for anyone who cannot trade short in their account.

I don't want to overwhelm you with charts as you are starting your weekend. It's been a long week for me as well so I'm going to run some scans and let the computer do a little work. I'll be adding a list of short stocks, inverse ETFs

There's still the chance that the market does pull off a bigger head fake and moves to the SPY $135+ area, this would actually be a very good thing for us. We'll have to see what happens after the open on Monday.

I'm looking at adding 1 more feature to the site, I just need to figure out how to embed it. This week, I started using a model portfolio and only made trades in stocks and based on information after it was posted at WOWS.  Thus far the performance of the model portfolio has outperformed the S&P-500 by a wide margin and is in the top 15% of over 13,000 portfolios that are active on the site for the week. I think this model portfolio will give you ideas on how to use the information and updates posted here at WOWs. For instance, I made some trades based on negative divergences in the averages and I'd shut down those trades when a positive divergence was posted in a market update. While this kind of trade may not apply to some of you, you'll also see longer term trades, how I phase into them and hopefully you'll see responsible risk and trade management. You certainly don't have to follow these trades, but I want to give you ideas of how you can benefit from the information here that you might otherwise see as just information. I'm getting use to the way the portfolio works, it deducts for commissions, margin interest and has many of the same rules you have in your trading accounts so it is very realistic. I'll try to figure out how to code it into the site this weekend.

Everyone have a great weekend!

BGZ

BGZ is now in a leading positive divergence on a 15 min chart, nice improvement there as well.

TZA

TZA has also shown substantial improvement today with a 5 min leading divergence.

Some Quick Ideas

 FAZ has held up well during the pullback on the daily.

 This afternoon we have a nice positive divergence on the 5 min

While XLF is falling apart.

Closing market analysis

 FXA or the Australian Dollar -as I've shown tends to lead the market from time to time. This doji, nearly a shooting star is not bullish.

 Here's the 5 min of FXA , also not bullish

 The SPY has gained a bit into the afternoon as the 1 min chart suggested, but there hasn't been any substantial improvement in the 5 min chart.

 You can see we are at the apex of the triangle, which provides resistance. I was hoping we'd see $135, but even here, the move has done what it was intended to do.

The 30 min chart is still pretty strong so the chance of $135 is still there, but it certainly looks like we'll see some downside early next week. That downside could be it for the market, or we may get to $135 on a last gasp move. Either way, I'd start planning now for a downside move into next week.

VRML Update

VRML has shown a lot of improvement, the head fake this morning was just that, 3C is now leading on a 5 min chart.

USO showing some improvement

USO Update

I'm surprised USO isn't performing better with the dollar down, and the dollar isn't showing any signs of improvement either.
 Here's a slight positive divergence sending USO a bit higher, but it hasn't crossed the important technical trendline that would cause buying.

The 5 min chart is in line with price, except the recent improvement on the 1 min chart hasn't translated into improvement on the 5 min chart.

As of now, not much has changed in USO at all since the earlier update.

Market Update

 DIA 1-there's been a little positive action recently on the 1 min chart

 The 5 min is still looking really bad

 QQQ 1 has also shown some recent improvement, but

 again, the 5 min continues to look bad.

 The SPY has shown the most improvement on a 1 min chart

But still looks very bad of the 5 min.

My take is that intraday we may see some upside, but if these 1 min charts don't improve more and start effecting the 5 min charts, I'd except to see a gap down on Monday morning.

Silver Update

I'm using PSLV as the signals there are much clearer then in SLV, but they should move together.
 60 min PSLV with a positive divergence in the consolidation, this makes me think we have upside here, but as I said 3-4 days ago, it's going to be a bumpy ride.

 15 min chart showing a couple of negative divergences suggesting a pullback, I would guess a pullback could take it down to the 10 day moving average around $16.50

 The same negative divergences on a 5 min chart

Here's the selling right off the open today, there has been some progress since then. We'll have to see if it holds up, but at this time, considering the 15 min chart, I expect it won't amount to much more then some intraday moves.

I have to run to the Pharmacy for my mom, be back in 30 mins.

RIMM Chart Request

 RIMM in a lateral consolidation on light volume, breeding ground for accumulation. Daily Chart

 The daily 3C from confirmation to distribution to accumulation-with positive RSI/Stoch signal (daily)

 60 min RIMM pos. divergence

 15 min pos. divergence, looks like it's getting ready to make a break.

Today there's some profit taking on the initial run up, but the longer term for RIMM looks pretty good for at least a swing/position trade. I'm guessing it will head for the gap in the $50-$55 area.

USO Update

 This shows volume picking up on probes below the trendline so this trendline is being watched and traded.

Here are several negative divergences off resistance and the last one off USO's attempt to move higher.

Either 3C is going to have to give us a positive divergence and/or a move in USO back above the $39.80 area. It's not uncommon to see a shakeout before a move through important resistance, but at this point, there's not a lot to go off except what we see right now. This is still a guessing game and as I said, I like probabilities. I'll keep you updated, at least we haven't seen a waterfall sell-off when USO broke support.

GDX Request

 GDX-compared to GLD (in red)-miners have underperformed gold itself for awhile now, note GLD making higher highs and GDX topping.

 The 30 min 3C shows accumulation at support of the top  and confirmation of the uptrend, but some cracks are starting to appear.

 Here's the 1 min chart, suggesting the distribution process is underway, remember that these run in cycles of accumulation, mark up and distribution into higher prices.

There may be a little more upside in the next few days as distribution occurs into higher prices, but the 15 min chart is falling out of confirmation now so I doubt there's too much more upside here.