Tuesday, June 9, 2015

Extremely Close...

There's actually not too much more to add to today's analysis, it has been covered through the day to a degree I'm comfortable with. Here's a bow tying it all together with several different trade opportunities from extremely short term trade management to new swing positions to new trend positions. If there's anything of importance I feel needs to be added after going through the charts, I'll post an addendum, but this is pretty much where we stand and it's a nice place to be standing.

The scenario I laid out this afternoon in this post, Market Update and Possible Trade set-up is very close, in fact so close I nearly took action, but realized that it was out of fear of missing the trade rather than objective evidence, strong objective evidence. Truth be known, over the long haul I've found it's much better to miss the trade than to enter for reasons like fear of missing the trade or greed. Once in a while you'll be right and that sets a dangerous precedent, one that tells you in futures situations to go with your gut rather than objective evidence. We have all manner of cognitive biases, each should be plucked out of our trading like weeds choking a garden.

Nevertheless, we are very close to the scenario laid out this afternoon in Market Update and Possible Trade set-up.

Ideally this is what I'd like to see happen tomorrow and how different trade set-ups would take shape.

Starting from the longer timeframes in which the SPY (pother averages) saw their positive divergences migrate out to (strengthen)...

 SPY 15 min leading positive, but still not a great base, still very "V" shaped.

10 min SPY leading positive, same trouble with the base.


To give you some perspective, this is the same 10 kin leading positive above, so it's not nearly as strong as it appears in context of the overall flow of underlying trade, nor is the 15 min chart, but still lots of improvement today.


 On the daily SPX chart, this is what I'd like to see happen tomorrow (the yellow candle I drew in). It doesn't really matter where it opens, whether a gap down low below today's intraday low or up higher, so long as there's an intraday low lower than today's, that would run stops and allow for a better looking base, a more stable base before breaking above the 100-day moving average which it's just below.

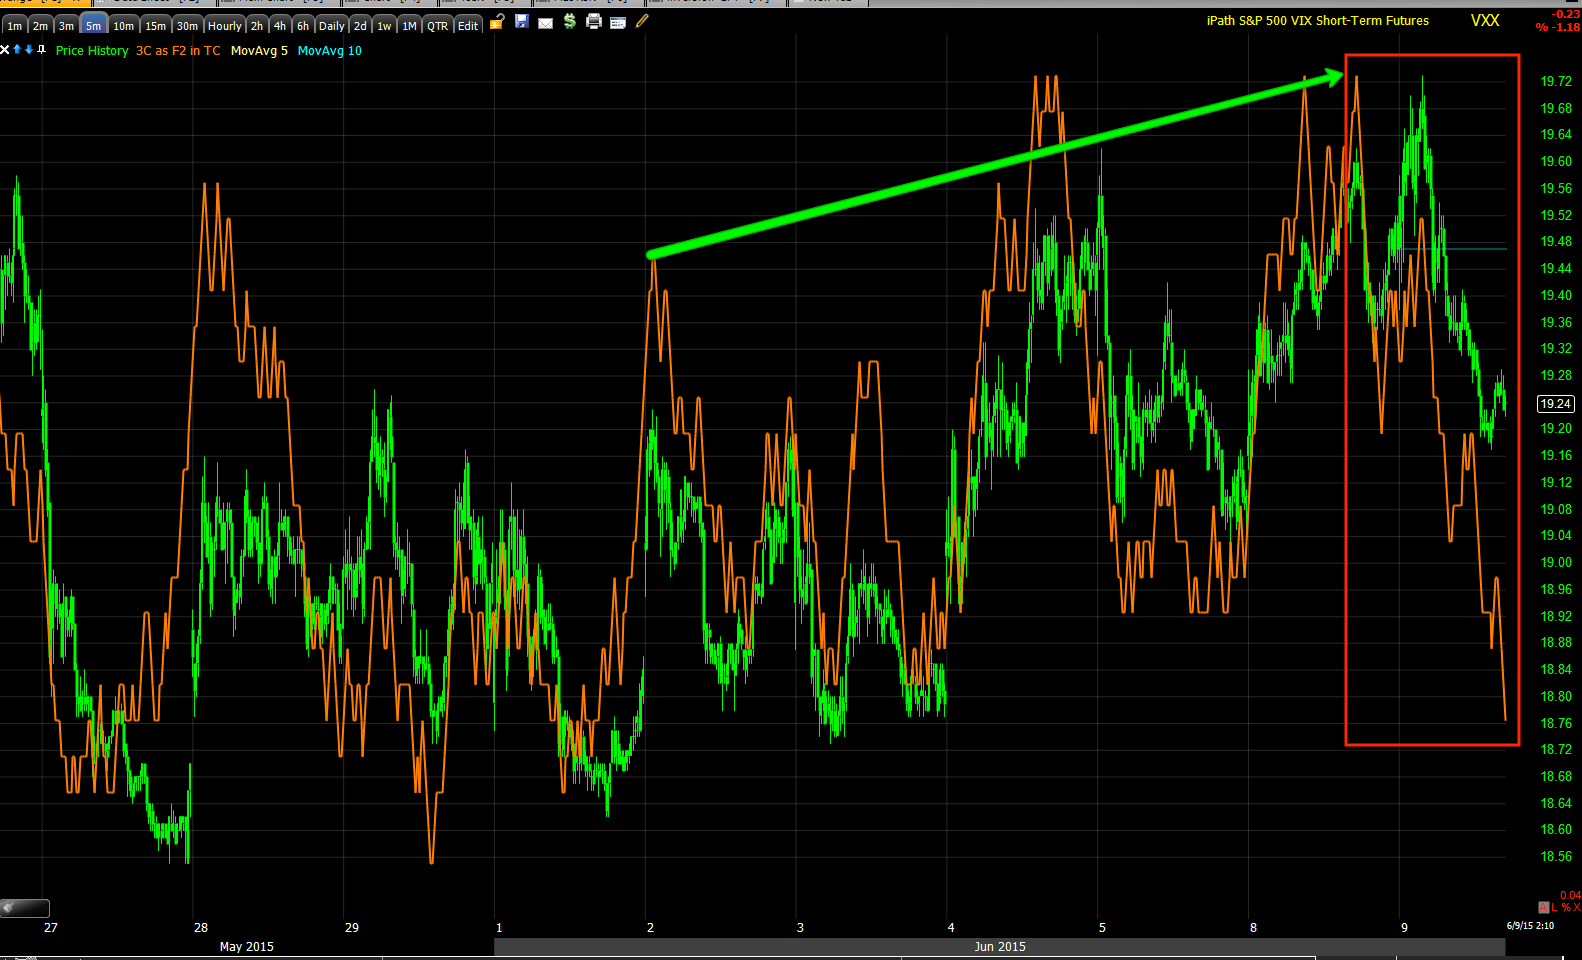
Looking at VXX/Short term VIX futures from the shortest timeframe...
 The intraday 1 min is positive as of the close. The 3C concept of picking up where the divergence left off at the close would suggest VXX moves higher early in the day (SPY /market lower as I'd like to see),  this allows us to close the UVXY and VXX long positions at a slight gain and enter VXX puts. At the intraday lows SPY, QQQ, etc calls could be entered. Ot course as always I'd like to confirm them first, but I suspect they'll be fine. I'd use leverage personally as I don't see this as a long lasting move. As a short squeeze it could be an impressive move, but I doubt it lasts long so some leverage would make the profit potential look a lot better.


The VXX 5 min chart should lead VXX/UVXY lower while the SPX breaks above the 100-day moving average triggering buying and a short squeeze, thus VXX puts should do well and/or SPY, QQQ, IWM, etc calls, again very short term.

However as I said earlier, the real trade here and the real probabilities is using the price strength after nearly 3 weeks of decline to enter short positions that need to bounce a bit and need the market to do it, take Transports for example which I've been very interested it. They simply haven't been able to accomplish much despite a decent positive / bounce divergence due to the market's overall negative tone.

With market support, assets like Transports (IYT) should finally give us that upside we can sell/short in to. I'm using Transports as an example as they could act as a proxy for ay number of watch list "Short Sale" candidates.

This is how it has gone and how I expect it to go and you'll hopefully understand why this is the highest probability, highest profit trade set up...

 The 60 min Transports chart's leading divergence "should" have pushed Transports up a lot further for a lot longer, but the market has been acting as an anchor on most of these watch list trades. Transports only got a measly +2.6% gain, hardly worth the effort or the trade set up to get a better entry and reduce risk.

 The 5 min chart shows the details of IYT's turn back down and it starting to develop a new positive divergence that has grown out of the start from yesterday like the averages today.

The more detailed 2 min chart shows that improvement today like the rest of the market,  thus we should get another chance here with market support and a real entry worthwhile.

For instance, looking at the daily chart of transports, something higher than the last attempt off a 60 min positive divergence that normally would have sent transports up for a couple of weeks rather than dragging them back down.

However if the market does as expected and a short squeeze kicks in above the SPX 100-day, transports will have the support for a move higher which we can finally short in to (red "S").

The thing I didn't show you and why I fell VERY comfortable shorting transports in to higher prices is the 60 min positive divergence in context of transports trend...


60 min IYT chart, not such an impressive divergence when it's in context.

Even worse...
Daily 3C chart of Transports.

No short squeeze 2-day divergence is ever going to overcome the distribution seen on this chart, thus,  I feel VERY comfortable shorting in to short term price strength. This is what most of the watch list short asset trade set-ups are like.

USO Chart Update

Again, Friday's USO call position was always expected to be a short term, though worthwhile trade, not much more, Trade Idea: USO (Speculative)

The charts have started deteriorating today as hasn't added a penny as of right now since we closed the call position this morning, USO Follow Up.

I expect a very near term small bounce in the $USD which should help the USO short/put position as well.
 USO 2 min intraday is leading negative, if it gets much worse and price stays relatively flat, I'll add the second half of the position to bring it up from speculative to full size.

 This divergence is migrating and has made it as far as the 5 min chart which is impressive considering it's fairly new intraday.

The longer term or bigger picture charts like the 10-15 min charts have leading negative divergence so it was always extremely unlikely that the USO move up would be anything more than a quick blip.


TRADE IDEA: USO (Speculative)

I expected the USO call opened Friday to be a short term trade as in what we saw today, I'm also looking for a new entry for the USO put closed last week at a +45% gain.

Right now I'm willing to go with a half size position (for risk management purposes) with a USO July 17th Put. If the signals improve a bit more, I'd fill out the position to full size.


Market Update and Possible Trade set-up

Today has been a day for patience, letting the market work itself out and show us some probabilities, it looks like those probabilities are starting to grow and there appears to be several different ways to approach them, all essentially the same trade set up.

Remember the charts of the averages before from earlier today such as, Market Update & warning.. Well it would seem that despite the stronger intraday positive divergences in the major averages, my warning to be careful with any upside move they might produce today was worthwhile.

However I see a scenario in which a couple of different trades could be set up and some trade management of some current positions might be worth a look.

 As shown earlier, the SPY positive divergence have improved considerably over yesterday,  5 min chart.

And the SPY 15 min chart, leading positive, but still not trustworthy unless more work work is done, specifically...

This "V" shaped reversal area is a reversal event, not a process and it's not stable.

As I mentioned in the warning post, more work would need to be done to create a somewhat stable base that could be trusted enough to consider some trades, very short term trades. Take for example the lateral work I suggested that needed to be done to create something more like a reversal process or a "W" base.


The SPY intraday move that I said I wouldn't trust, 1 min chart...

is now failing intraday and coming down,  this would create the opportunity for that lateral basing work to be done and form something like the "W" base drawn in above.

Make no mistake, this is still FAR from a respectable divergence, but with HYG already being geared p for support, it's pretty easy to see what the target would be...
SPX daily chart. With nearly 3 trading weeks of downside and a break of the 100-day moving average as well as it meeting resistance today, new shorts are likely pretty eager and taking positions, this is an easy thing to guess just from how predictable Technical Traders are without any additional evidence. 

Furthermore, smart money need not risk much at all (long) as a break ABOVE the 100-day would come with its own built in solar panel in the way of a short squeeze seeing how we've had 3 weeks of downside and a break of the 100-day and failed test today. Still even for such a move, a "W" base would be pretty much the minimum to support such a move.

I'm not saying this would lead to a new high or even a swing above the 6/3 Shooting Star intraday highs, but it would game traders and new shorts, it would give us the move I've been looking for and as was forecasted on 4/2 in which everything forecasted has come to pass from the clearer formation of a larger triangle to a break above it on a head fake move to a decline to the 100-day moving average which I believed would be broken to the downside leading eventually to a new lower low below the October lows, I also thought , as is reasonable, that there's be some consolidation around the 100-day , some game playing.

This looks to be the play. While I'm not terribly excited about the idea of any long trade in any of the averages (SPY, QQQ, IWM, etc.), if there were strong enough signals, I'd be open to a trade with some leverage, perhaps a call or a VXX put.

speaking of which since Short term VIX futures (VXX) have been confirming the SPPY action thus far...

 The 5 min chart of VXX has gone from upside confirmation to a small leading negative divergence, confirming the SPY 5 min chart.

The VXX 2 min chart shows the same divergence, also confirming the SPY 2 min chart (as well as QQQ/DIA).

Here's a closer view of the VXX 2 min chart. Again, nothing has changed where it really counts on VXX 10-15 min leading positive charts and it won't, meaning I believe after this little bit of game play, the SPX will slice down through the 100-day and move toward a new lower low below the October low.


Thus a VXX put for a short term trade may look very attractive in the next 24 hours.  
Just as the SPY 1 min chart went negative intraday and looks to be heading back down to where it can build a more solid base of operations for a break above SPX-100 day, the VXX 1 min chart is seeing an intraday positive divergence as the SPY has turned down intraday off the move I warned not to trust.

Thus I may take UVXY and VXX long equity positions off the table to preserve the small gains and prevent losses as VXX moves up/SPY down intraday. If there's enough solid evidence that supports this theory which I think there will be, a VXX put (short term, somewhat speculative) may look like a nice trade set up. I'm not as excited about SPY calls, but we'll see what looks like what.

Right now, this looks to be what we should expect so if we do see price and 3C continue to act as I've laid out above, you might consider some VXX/UVXY trade management or any other positions that may be effected and perhaps a new short term, speculative position. However I'd remind you that the much riper, wiser trade is letting the market bring the trade to you and entering on confirmation at the time and place of your choosing. It would also be the larger, longer term trending trade.

*Last note, a break in the SPY below today's intraday lows on large volume would make the above scenario much more appealing.

Market Update & warning.

It looks like the market wants to bounce in this area, if it can,  this is NOT a move I would trust even for a short intraday period at this point.

Here are some example charts and keep in mind the prerequisite since last Friday was the market had to do some pretty serious work, I do not see that as having been done.

 SPY intraday 1 min is looking more impressive, but this is still a 1 min chart only and still a very small area of real estate in which the leading portion of the divergence resides.

This is one of the charts that makes it look like the market wants to move intraday. It would be best if it just continued to move laterally and build the divergence.

The SPY 2 min chart is NOT showing anything similar as a leading divergence.

 SPY 3 min positive divergence , yet hardly leading and again not very large at all.

This is the real problem. A trustworthy reversal is a process, not a "V" shaped event, this is exactly why or a symptom of why I would not trust any kind of upside movement from here.

QQQ 2 min shows a similar leading positive divergence.

And its 5 min chart's looks a little more impressive here, but put it in to context...

 This is a very small divergence after a very large distribution area. The market has not done the work.

And again, that tight "V" shaped price pattern. Just as if you were building on top of this as a foundation, would you rather build on a pivot or a more stable , larger lateral base?

The IWM 1 min is also leading intraday

And it goes out to about this 5 min chart.

There's a chance that the market stays put price wise and continues to move laterally and continues to build something a bit more solid and we are still talking about a corrective move really.

However the 100-day SPX moving average is right in the area which is sure to trigger some buy orders and squeeze some shorts on a break above it...
SPX daily chart and 100-day moving average with price right below it.

The divergences above look to me like the market wants to try to pierce the 100-day and squeeze some shorts, maybe get some people buying the dip/move > the 100-day.

There simply isn't a base here that anyone with any influence has bought in to and for that reason, I would be very careful about trusting any upside move that may develop from here.

On the other hand, if it does develop and it sends some of our watch list assets higher as a few are already doing today, shorting in to those, letting the trade come to you is something I would absolutely support.

Market Update

Last Friday's The Week Ahead post/forecast was pretty much centered on one idea for the most part,

The charts and excerpts/commentary below are all from last Friday's The Week Ahead post..

 SPY 1 min intraday looks worse than yesterday. This does NOT look like it can support much if any bounce in to next week, so as I said, unless there's some additional short term base work put in, this market is looking dangerously close the the edge of the cliff.

 The IWM intraday charts look like this, if anything I'd expect early weakness early next week as there's no confirmation at all here and it's not just this 1 chart.

 ...It's when the short term timing charts start falling apart that you need to be concerned (if you're long)...Again, unless there's some MAJOR work done early in the week, I think we'll be just taking what we can from the watch list of assets that are setting up on their own with no market support."

You saw yesterday's updates and while some 1 min charts showed some minor positive divergences as that is the weakest timeframe (with many run over), there was no migration to longer term charts such as 2 min, 3 min, 5 min etc. Thus there was no strength building. Yesterday's internals showed what I'd call a half-way short term oversold market. The Dominant Price/Volume /relationship among the comment stocks of the major averages was not flashing a 1-day oversold condition unlike the sector/group performance, that is something I suggested "may" happen today, or the market may just slice through the 100-day (SPX) and continue to a lower low as I expect will be the end result no matter whether a short term toe-hold, 1-day oversold condition or bounce can develop. The market needs to do some serious work to save itself from here was the point of Friday's post.

There have been some additional improvements that were obvious as early as the A.M. Update in which I showed some accumulation in the Index futures on a decline around 4-6 a.m. EDT today.

Here's what we have thus far that is showing some additional work / progress being made, although I would not call it anything slid as of yet. *I'll use the SPY as an example as it is close enough to act as a proxy for all of the averages (rather than post an additional 10 charts).

 SPY 1 min intraday today with a relative positive divergence (the weakest form).

This is the trend of the 1 min chart since distribution sending it lower. There is a larger relative positive divergence , while a relative divergence is the weaker form vs. a leading divergence, the larger size of the divergence does count for something, although not much being it is only a 1 min chart so far.

The SPY 2 min chart shows 3C price/trend confirmation as 3C makes lower lows with price at the green arrows, however unlike yesterday, we do have some migration to a longer 2 min chart showing some improvement in the divergence and market.

The 3 min chart also shows the clear distribution sending it lower and 1 small divergence that saw distribution and now a relative positive divergence, although it is the weaker form, it is starting to see what it did not yesterday and that is migration through longer timeframes indicating some strength building, although still very early.

 Interestingly the 5 min chart which is much stronger than the 1-3 min charts even though it doesn't seem too far removed from them, shows the clear leading negative divergence/distribution sending the SPY lower and a relative positive divergences today as well. So today we do have some migration, although it's more of a start of improvement rather than the beginning of something I would consider high probability.

 The 10 min SPY is still in perfect downside confirmation as this is a stronger timeframe and 3C trend of underlying flow.

VXX/VIX short term futures trade opposite the market, which is why we opened a UVXY position to add to the already open VXX partial position last Thursday, Trade Idea: VXX / UVXY Long.

VXX 2 min is showing a confirming negative divergence suggesting there's something to the building SPY divergence above.

UVXY, the 2x leveraged long ETF-(VIX short term futures) is also showing the same 2 min negative divergence and confirming both VXX above and SPY above as some market strength is starting to take hold.

 However, I would not confuse any potential market strength no matter how much it builds from here with a market reversal that will stick if we even get to a bounce. This 10 min (and 15 min) VXX chart is in a leading positive divergence with a large base/accumulation area (in the form of an ascending triangle).

In addition to the short term SPY/VXX charts above, as mentioned several times already, there's only 1 reason to see a positive divergence in High Yield Credit and that is as a lever to help move the market. We saw this yesterday, however keep in mind that no matter what we see in HYG short term, there's no coming back from the larger trend which must be considered in any analysis from this point froward, What High Yield credit is Screaming


HYG 1 min showing additional and interesting leading positive 3C signals intraday. It would seem someone is trying to put some support below the market in the area. As I said Friday, the ,market has some serious work to do if it is going to bounce as it looks dangerously close to falling off the edge of a cliff, some may say that has already happened with the SPX breaking the 100-day,  bit as we know, many traders will be focussed on the SPX 100-day m.a. which sets up a perfect area for Wall St. to game main-street, although I have little doubt how all of this resolves as the games and short term action fades away.