Tuesday, May 26, 2015

Daily Wrap

I'm going to keep it short tonight because there's not much to tell that we haven't covered.

The closing negative divergences in the market on Friday played out just as we'd expect on the 3C concept of the market picking up where it left off on the previous close, even over a 3-day weekend and that was with a horrible negative divergence.

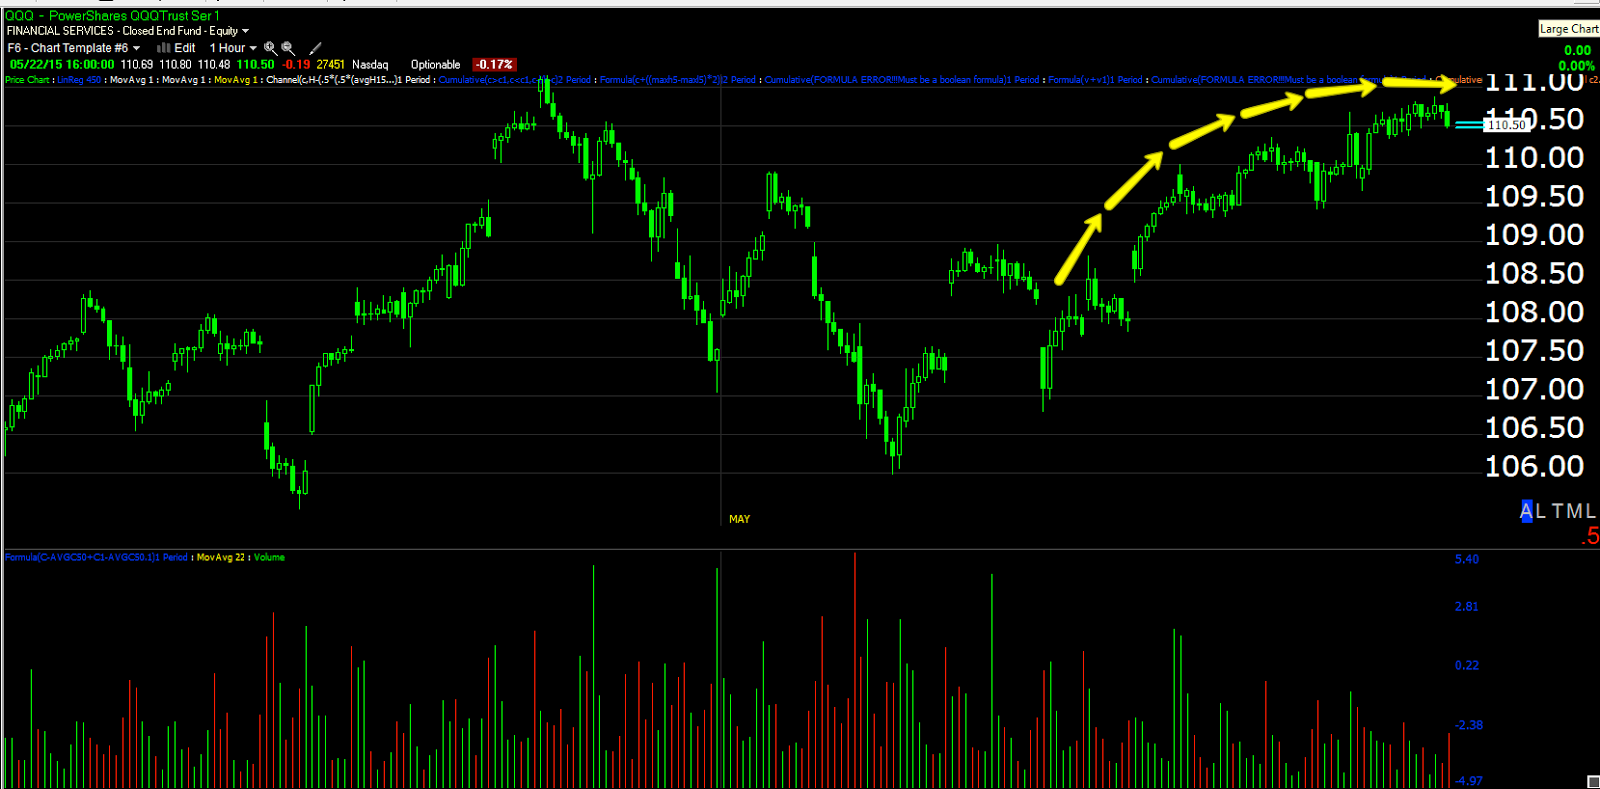
I also mentioned that we were in the reversal process of what I believe will be an Igloo top with a Chimney. I posted this chart of the "Igloo" on Friday in the The Daily Wrap with the following chart and commentary (remember this is from Friday)...

"I think the new Call/Put positions listed above to be profitable early in the week as the QQQ "reversal process" Igloo price pattern above that was expected to form this week should see early weakness next week before a head fake/"Chimney" which should allow us to open the new positions I have been watching this week, although we didn't enter any of the watch list trades as the signals were "close", but not quite there.

The concept of 3C charts picking up where they left off in the cash market even over a weekend or even a long holiday weekend, should see the positions entered this week at a gain early next week as today's closing 3C charts/signals are all reflecting early weakness which would be in line with the "igloo" price pattern finishing before the head fake Chimney which "should" allow us to take gains on the new options positions as well as enter new, longer term positions on the head fake move right after booking gains on the new positions above on early week weakness."


EVERYTHING POSTED ABOVE FROM FRIDAY PLAYED OUT PERFECTLY TODAY. 
We closed the Put positions in QQQ and IWM today at a gain on today's weakness as the 3C charts foretold Friday and closed the VXX calls and the TLT Calls at a gain as well. This further created the Igloo in the QQQ above as forecasted Friday, but with significantly more weakness than the normal rounding of the "Igloo top" portion of the price pattern...
 Look at the QQQ chart above this one from Friday and the normal rounding over , "Igloo top", today it was significantly deformed due to massive market weakness, not just on the day, but severe damage done.

Normally we would look for the head fake "Chimney" on the right side of the "Igloo" rounding top formation, in this case it would look something like this...
Igloo and Chimney in yellow, the chimney being a head fake move that fails and leads to a fast downside move, but also gives us an opportunity to enter swing / trend shorts at better prices and lower risk.

Incidentally today, the positive divergence needed for a move up were VERY present, thus our entry in VXX and TLT puts today after closing the call positions at decent gains in VXX and TLT, TLT & VXX Follow up (P/L) and charts with a smaller VXX +2.5% gain and a larger TLT +50.4% gain today.

Shortly after we reversed positions and entered TRADE IDEA: SPECULATIVE TLT PUTS and TRADE IDEA: SPECULATIVE VXX Puts, both with decent , but very short term positive divergences meaning while we may get a decent move, it should be short lived, along the lines of the "Chimney" move to the upside as I mentioned we could have entered SPY, IWM or QQQ calls as well, I just liked the VXX/TLT charts better.

Adding to the weakness today, the spot VIX saw the biggest percentage move of all 2015 at +15.9% and the $USD has now put in the strongest 7-day move since 2008 on its counter trend bounce.

Interestingly, adding to the probabilities of today's new positions entered and a near term / short term market bounce, Internals WERE EXTREME!

The Dominant Price/Volume Relationship was in all 4 averages with an amazing 72 NASDAQ 100 stocks, 27 Dow 30!!! There were 1058 Russell 2000 and an amazingly strong 368 SPX-500 stocks all in the same Dominant Price/Volume Relationship of 4 possibilities... Close Down/Volume Up which is the strongest 1-day oversold condition of the 4 possibilities usually leading to a next day move higher as our intraday divergences suggested, those being the reason we entered the TLT and VXX puts today after closing out the calls at a gain as forecasted Friday!

Furthermore internals were exceptionally strong with all 9 of 9 S&P sectors closing red with Utilities leading at -.63% and Energy lagging at -1.58%!!!

OF the 238 Morningstar groups I track, an amazingly overwhelming 231 of 238 groups closed RED, this is a VERY strong 1-day oversold condition and especially taken with the Dominant Price/Volume Relationship of the 4 major averages. This CLEARLY suggests a next day close in the green on a very strong 1-day oversold condition. However remember the positive divergence were at best a half a day long, exceptionally weak for a bounce suggesting exactly what we have expected, the market is getting ready for a very serious turn to the downside so we'll want to be selling short in to any price strength with decent divergences.

As for futures tonight...

The short term 3C charts suggest exactly the strong, but very short term bounce we expected by the intraday 3C charts today. Here are the Index futures in several different timeframes for a bounce, but notice how small the divergence is unless we add to it tomorrow, which seems unlikely given internals tonight...

 N Q/NASDAQ 100 futures 1 min building a  positive divergence just as we saw on the intraday charts today.

The slightly stronger, but still short term TF/Russell 2000 futures 3 min chart also with a positive divergence, note the exceptional volume today!

And the 10 min ES/SPX futures with a strong 10 min divergence, but a very small one which could lead to a sharp upside move as internals suggest, but a very short term one which is why I decided to go with the leverage of options as there's simply not a large enough divergence to make an  equity long (or short depending on the asset such as VXX) worthwhile.

As for the charts that count in looking for a bounce that fails and leads to a strong downside move...
 The very strong 30 min ES / 3C chart with the same rounding/Igloo top seen above in QQQ, but note the leading negative divergence (red) and the exceptional volume!

Even stronger, the 60 min ES/SPX futures chart which shows no other divergence nearly this strong on the entire chart since 4/13 and very negative on huge volume.

This all suggests the short term move to the upside we expected both last week (after initial early week weakness which we saw today) and on today's divergences creating the Chimney portion of the "Igloo/Chimney" price pattern which is a downside reversal price pattern , especially with these 3C divergences.

We'll be looking to take gains on positions entered today adding to the QQQ, IWM, VXX and TLT gains all booked today  (+2.5%, +6.3% +50.4%, and +83% all booked today).Then we'll be looking to enter new longer term swing/trend shorts on any price strength. Today saw exceptional damage done to the market beyond the percentage moves and way beyond the exceptional damage of 2015. I suspect we may even see the move down (the one that challenges the October lows and moves below them eventually) begin later this week.


USO / Crude Update

Since we have a lot of new members who may not have had the benefit of following oil as long as we have, I'm going to try to show a brief overview of our expectations, the correlations and the big picture as well as shorter term trade.

First of all, USO / Oil saw a massive distribution phase last summer with 3C negative divergences on long term charts that led to the down trend and lower prices that have been the subject of much crude discussion. Different people have called bottoms at different times, Cramer being one of them, but as you'll see, it looks a whole lot like there is a bottom and he probably knows it, he just called it early and I suspect that was to help out his buddies on Wall Street as he is Goldman Sachs alumni and when you are GS alumni there are a lot of perks, for instance several of the last technocrat leaders / Prime Ministers of Italy and Greece have been Goldman alumni. Mario Draghi of the European Central Bank is Goldman Alumni.

The larger question for you to think about and consider is a person in Cramer's position who could be very helpful in creating demand or supply just when Goldman needs it via his depleted, yet still vast audience can be very helpful to Goldman and if Cramer should ever need a favor, who better to "Owe you one" than Goldman considering their "Global Reach" ? So I guess the question becomes, where do you think Cramer's loyalties are, with a bunch of nameless, faceless viewers who follow his every recommendation or perhaps to GS and other big players on Wall St.? Just a question you need to ask yourself when considering the charts below and the calls for a bottom which are seemingly endless.

Just a quick search with the keywords "Cramer calls bottom in oil" gave me the following results...


10/20/2014 "Oil prices near a bottom"

12/03/2014-"Could the bottom in oil be closer than we think?"

12/12/2015 Cramer Consults the Fibonacci-Queen, oil due for short-lived bounce around December 16th to 18th

1/15/2015 "Signs that oil may be near a bottom"

1/16/2015 "The price of oil has not yet hit a bottom"

1/30/2015  Oil's "Bottom could be around the corner" & "On the lookout for "V" or "U" shaped bottom next couple of months"

1/30/2015 "Cramer's Game Plan: Oil Bottom is imminent"

2/04/2015 "Have Oil prices finally bottomed?"

2/04/2015 "This smells like a bottom"

2/09/2015 "Cramer's 2 signs that oil has bottomed already"

4/02/2015 "We're at the beginning of a bottom in oil...but that doesn't mean it's going to rally"

4/15/2015 "Oil prices on a tear, but don't buy oil stocks yet"

4/30/2015 Cramer: "Buy oil stocks? Don't you Dare...There was a time to buy oil, that window has closed"

5/21/2015 "Oil prices not yet at rock bottom prices"

I'm not quite sure what to think. We've had a couple of themes and I'll show you why. At first it looked like oil was going to see a counter trend bounce early in the range, but as the size of the base and the amount of accumulation went on, it became clear it was too large of a base for a counter trend rally and that we were more likely looking at a large base that would continue to form as it would have to be large enough to support what I believe will be a trend reversal in oil. I believe the base is defined between the two trendiness above. When prices are near the bottom we see 3C accumulation, when prices are near the top of the range we see milder 3C distribution to send prices back to the lower end of the range where they are accumulated.

Here are some of the initial, bigger picture charts...

 This is the daily 3C chart of oil futures. Last summer we had some heavy distribution right in the area of a H&S top (yellow). The green arrow is showing 3C price/trend confirmation or confirmation of the downtrend as 3C makes lower lows with price until right round the new year (2015) when the 3C charts start to diverge with price (positively/accumulation). At first it looked probable that oil (futures/USO) were going to make a counter trend rally, but as the base grew larger it was obvious it was overkill, much larger than needed for a counter trend rally and our theory was that oil would go on to make a larger base , large enough to support what would likely be an eventual intermediate or primary trend reversal in oil to the upside. That positive (leading) divergence is still in effect (white area).

The numbers on the chart represent the 4 stages of an asset's cycle. These occur within primary trends, they occur within swing trends of a month or more and they even occur on an intraday basis. Understanding where you are in a cycle gives you a good idea of where you are going. There are different hints and give-aways that help us determine where we are in a cycle, actually numerous ones, but you can often tell just from price action alone.

The H&S top on this chart is a stage 3 top/distribution cycle and this is almost always followed by stage 4 decline which is also marked on the chart as 3C confirms the downtrend in price. The positive divergence starting around the New Year "should" see a transition from a downtrend to a more lateral trend which is a stage 1 base. When the base is complete, we expect to see a breakout of the base and stage 2 "Mark-up" also known as "Participation". Typical 3C will confirm the uptrend here as well like it does at the stage 4 decline until a negative divergence is the first hint along with an increase in the upside rate of change in price as the asset enters a euphoric phase right before turning from an uptrend to a lateral topping trend , stage 3.

Currently oil is right between stage 1 base and what "appears" to be a stage 2 breakout, however we called this breakout in advance as a head fake move, meaning it likely would see distribution and would not hold. The reason for this is oil was showing negative divergences that suggested it would pullback toward the lows of the base where it would be accumulated again and likely be done with the basing process. However, when we have such a defined area of resistance, Wall St. knows that technical traders will buy and chase a breakout. We anticipated this false breakout (failed breakout) in advance as this is one of the ways downside momentum is created as new longs start to sell at a loss. "Failed moves lead to fast reversals", in this case I suspect the reversal will be toward the bottom of the base area where the base will finish up the basing process and move to a real stage 2 breakout.

 This is the same chart (daily) except with USO as the asset (ETF for WTI crude). You can see the same H&S top at #3, then stage 4 decline and a lateral stage 1 base.

Taking a closer look at the far right side of this base area I had said that it was very likely that we'd see a false breakout above the base's resistance trendiline (before it occurred) based on the concepts of a head fake move and the 3C signals we were getting at the time which were more consistent with a pullback than a breakout to a solid stage 2 "Mark-up" trend.

If you look at USO's daily chart carefully, you'll notice there was a head fake move March 18th, but in this case it was a break or stop-run below the base's defined support range. These head fake moves which we confirm with 3C charts are some of the best price-based timing indications for a trend reversal. In this case it was a run of stops just before USO made a move to the top of the range worth approx. 30+%. 

Much the same way the head fake/stop-run created upside momentum as new shorts were squeezed, creating momentum, the move above the top of the range serves the same effect, just to the downside. In the case of the March 18th head fake below the range, the same principle applies, "From a failed move comes a fast reversal", in this case it was a failed break below support that reversed to the upside and created strong upside momentum initially on the short squeeze of new shorts entering as price broke below the support range and were squeezed as price moved back above the bottom of the base.

All indications point to the recent move above the stage 1 base's upper range as being a head fake or false breakout that should see oil move back toward the lower end of the range to complete it's basing process as smart money doesn't chase prices higher, they buy at the lows of the range as you'll see.

 A very strong USO 6 hour chart shows trend confirmation on the move off the head fake March 18th stop-run  as 3C moves higher with price at the green arrow. However once price breaks above the top of the base's range at the yellow trendily, we see a dramatic negative divergence right at the very area where retail traders would be buying the breakout as institutional traders would be selling in to retail's demand, causing the large negative divergence at the red area which happens to fit exactly where prices broke above the range, indicating an extremely high probability that the breakout was a head fake or false breakout and price action since then has tended to confirm with no upside follow through in price.

 This strong 2 hour chart shows 3C accumulation (white) at the break below the range (head fake stop-run just before the trend reversal up +30%). Again, a negative divergence at the breakout above the range (yellow) is very clear. I didn't mark the divergence here because I didn't want my drawings to distract your attention from the lack of 3C confirmation on the break above the range and even worse, the negative divergence on a very strong 2 hour 3C chart.

This just confirms the expected false breakout we expected about a week before it even began.

This 60 min chart of USO in the base's range shows good 3C confirmation of most of the trends at the green arrows , but notice the clear divergence at the break above the resistance/top of the base's range just like the stronger 2 and 6 hour charts. However, while still being an exceptionally strong timeframe, the 60 min chart provides more detail than the longer 2 and 6 hour charts which are more trend.

At this point my expectation is for USO to head lower, although there will be the normal ups and downs we find within any trend which you'll learn more about below. We have a current USO equity short to take advantage of the swing trend lower. I anticipate it will move toward the base lows of the USO stage 1 range around the $16 area, however we will monitor the charts for any data that suggests otherwise (perhaps a smaller or larger pullback).

We can't ignore the $USD counter trend rally and the effect that it has on oil through the legacy arbitrage correlation. Here's an example...

 This is a 60 min chart of CL/Oil futures (candlesticks) vs the $USD (purple). Note there is an inverse correlation known as the $USD legacy arbitrage which is simply $US Dollar denominated assets move opposite of the $USD. For instance a lower $USD means to get the same value for a barrel of oil, oil price must rise to account for the weaker $US dollar. Likewise, a stronger $USD means cheaper oil prices. This correlation is typical for most $US dollar denominated assets like oil, precious metals, most commodities and in a non-manipulated market (which has seen unprecedented Central Bank manipulation since 2008) typically stock prices as well. 

The reason the $USD is so important right now is because of our $USD analysis and forecasted trends as oil (as you can see) has a clear correlation to the $USD (inverse).

We expected a downtrend in the $USD and have seen exactly that on daily charts breaking the strong 2014 uptrend, but we also anticipated a strong counter trend rally which played out last week with the strongest $USD weekly move since 2008!
 Daily chart of $USD trend change from up to down as a lower high and two lower lows have been made with a counter trend bounce (green arrow). This counter trend rally should cause downward pressure on oil near term, by the time the CT rally ends in the $USD and it starts making new lows, I expect there to be a decent chance it correlated with the expected real breakout to the upside in oil.

 $USD 30 min chart is still in line and suggesting more upside in the $USD as part of the counter trend rally.

 This 15 min chart of the $USD shows a "W" base with a strong 3C positive divergence that has been in line until recently at the red arrows suggesting a pullback within the counter trend bounce is in the making.

 The more detailed 5 min 3C chart of the $USD suggests the pullback in the $USD is closer , this "should" have an inverse effect on oil short term (bounce) and there are some decent reasons for a bounce short term.

 The 3 min $USD chart showing a negative divergence as well.

And now that it is hitting the 1 min chart, the timing is moving closer to a $USD pullback.

Remember this should have the opposite effect on oil near term.

Oil futures....
 The oil futures 7 min chart is in line right now with the price trend.

 As is the shorter term 5 min chart.

 However the near term 3 min chart shows 2 positive divergences in oil futures suggesting a small bounce is getting ready to take place, this would fit with the short term pullback in the $USD from the charts above being they have an inverse relationship.

And the 1 min timing chart in oil went from negative overnight to a building positive divergence suggesting we are getting close to a minor oil bounce.

USO short term charts...

The USO 15 min chart is a strong timeframe, but much more detailed. Note the clear negative divergence at the break above the base's range . This suggests a swing trend move lower.

 The 5 min chart shows several divergences and a current in line reading at the green arrow. It seems to me all of these divergences are related to gap fills, look closely.

 The 3 min chart shows a small positive divergence building like oil futures above, it looks like a gap fill is probable as there's a gap just above and USO has been filling gaps.


The 2 min chart is a timing chart. I suspect we see today's positive divergence continue tomorrow and probably lead to a gap fill. This may make for a decent short entry as I intend to keep the USO equity short (which is set up as a swing trade for a move lower) open. I don't see this as a trade with good risk/return properties, but as I said, it may make for a decent short entry for the larger downside swing trade.

Again, while the $USD is in a counter trend bounce, that should pressure oil lower along the lines of our swing short. However when the $USD returns to the prevailing downtrend, I suspect this may align with a larger trend reversal in oil to the upside, this is what I suspect anyway and we'll be looking for the evidence of such and of course of any other scenario the charts may point to, but at present, this seems like the highest probability.

TLT & VXX Follow up (P/L) and charts

First the P/L from the closed TLT and VXX positions from earlier, Closing VXX June 19 $120 Calls and VXX June 19th $19 Calls which I corrected as the $120 calls were TLT, EDIT* Closed TLT $120 Calls

The put position in both looks to be short term by the chart signals which are the same reason obviously for closing the Call positions. I did leave the equity longs in TLT and VXX in place as I'm not worried about draw down and these are meant to be longer swing trades if not more in VXX's case at least.

However very near term, the short term does look probable for at least a speculative position in puts as posted just 15 minutes or so ago.

As for the closed Call positions P/L first, the VXX position was opened last Wednesday, Trade Idea: VXX which also explains treating the two positions (VXX long equity and VXX Calls as 1 position for risk management reasons).


The VXX position was a VERY minimal gain, this was more to keep the position from any losses, but still came in at +2.5%

The TLT add-to Trade Idea: TLT Long, which was adding to the original 2x long TLT (via shorting TBT, thus creating a 2x long TLT position) position meant as a longer term trend position, was a shorter term fill-out of that position, also treated as 1 position for risk management purposes.


The P/L for TLT was much better at a gain of +50.4%

Here are the TLT and VXX short term charts and reason for closing the Call positions as well as opening the new speculative put positions.

TLT (20+ year Treasury bond fund)... I'm expecting a counter trend bounce in TLT, however this is more of a shakeout move that is expected, but as with most counter trend bounces/rallies, these are some of the strongest rallies you'll see in any kind of market even though they typically occur in a downtrend, they are almost always far stronger than bull market rallies.

For proof, just look at the counter trend bounce/rally we forecasted in the $USDX with the strongest weekly move last week since 2008 and this is a counter trend bounce within a larger  downtrend.

 However right now the options positions are for very short term moves. This is today's 1 min TLT chart showing the leading positive divergence late Friday with price picking up where the 3C divergence left off on Friday and moving much higher. 

However on a very near term basis today we are seeing negative divergences in TLT as if it is setting up for a short term pullback, perhaps a gap fill of today and maybe some depending on how much more today's negative divergence develops.

 TLT 3 min chart is showing migration of the 1 min negative divergence today (strengthening as it moves to a longer timeframe). You can likely see the leading negative signal to the far right of the chart.

And on a 10 min chart which is a much stronger timeframe, we have a weaker form of divergence, a relative negative divergence, but on a much stronger timeframe.

As to why this is a SPECULATIVE position, the bounce or counter trend rally to the upside is still expected and still the dominant signal, that's why these put positions are short term and speculative.
 This is the much stronger TLT 15 min chart with a LARGE leading positive divergence signaling a counter trend rally.

For the reasoning behind this trade set up, see the original trade idea here, Bond Rally / Swing. This will explain the head fake move or in this case specifically the volatility shakeout of new shorts in a trade already thick with treasury shorts.

 This is the daily TLT chart. You can see TLT has made a lower high and a second lower low breaking below the long term trend line. Technical traders will go short on the break of the long term trend line just like they'll go short on the price break below the neckline of a H&S top, which is EXACTLY why we won't. Wall St. knows how technical traders think and respond and they'll shakeout the new shorts on a volatility shakeout above the trendily creating a short squeeze and very strong counter trend momentum, the same way as they do with the break of the neckline of a H&S top. 

However as the base for the counter trend bounce develops in TLT below the trendily, it looks like the daily candle today is seeing resistance/distribution as it has a long upper wick in addition to today's negative divergence above.

VXX (short term VIX futures) which move opposite the market.
 On the 1-min intraday chart we see accumulation/positiver divergence in to the close Friday and price picking up where Friday's divergence left off. However in to the price gain today we have a negative divergence on the 1 min chart...

Which has migrated to the 2 and 3 min chart above...

Again the larger trade we are looking for is VXX to the upside as this 15 min chart leads positive, this is why I keep the long equity position in place and why I see the VXX put as a very speculative/very short term trade. We should be entering a new VXX call position on a short term pullback, again like TLT, perhaps a retrace of today's move.

XIV (the inverse ETF of VXX) showing confirmation of the VXX charts. Remember this moves opposite VXX and should give opposite 3C signals for confirmation. XIV moves with the market as VXX moves opposite the market.

Giving a confirming signal on the intraday charts from 1 to 3 min above, we have the negative divergence Friday in to the close and price picks up where 3C left off with a move lower which we captured with VXX calls earlier. However as VXX shows a negative divergence today, XIV shows a confirming positive divergence today (3 min).

And like VXX's 15 min chart with a strong leading positive divergence, XIV's 15 min chart moves from 3C price/trend confirmation at the green arrows to a leading negative divergence (the opposite of VXX's 15 min leading positive divergence) and the reason this is the larger trade and the VXX puts are the shorter term , speculative position.

XIV moves with the averages and VXX moves against them. We have confirming signals in SPY, IWM and QQQ today. I simply don't want too much short term , speculative  exposure. However a SPY, IWM, or QQQ call position could be used, I just liked the charts of TLT and VXX better at the time.
 SPY intraday today on a 2 min chart not only with a positive divergence, but the rounding reversal process (yellow arrows).

 QQQ 3 min showing Friday's closing negative 3C divergence picking up where it left off today from Friday's negative divergence as was shown in the Daily Wrap Friday... Today a positive divergence confirming the VXX, XIV and SPY charts above.

 IWM 5 min also leading positive today intraday on the decline and a lateral price trend reminiscent of a very short term intraday base for a bounce. IWM looks like it needs to come down toward this morning's lows to build a more stable base ("W"-shaped).

Looking at the same 5 min chart of IWM on a longer trend basis, you can see why any long position here would be very short term and very speculative as we have a stage 1 base at the 5th/6th/7th of May like all the other assets, stage 2 mark-up 3C confirmation at the green arrows and stage 3 top distribution at the red arrow/box as price is lateral and the start of stage 4 decline.


EDIT* Closed TLT $120 Calls

I'm sure you probably figured this out from the text of the post, but the Closing VXX June 19 $120 Calls and VXX June 19th $19 Calls should have read "Closing TLT June 19 $120 Calls and VXX June 19th $19 Calls"

TRADE IDEA: SPECULATIVE VXX Puts

Again, another short term, SPECULATIVE position as VXX looks to come down very near term.

I still prefer the longer expiration so I will use June 19th (monthly) $20 Puts in speculative size, again for a very near term position.

TRADE IDEA: SPECULATIVE TLT PUTS

I'm looking at TLT 6/19 $122 Puts at a smaller speculative position size for a very short term trade, perhaps only days, but I prefer to have the longer expiration in case needed.

Closing VXX June 19 $120 Calls and VXX June 19th $19 Calls

Again, I'm closing these for now. Both positions have equity longs in VXX and TLT, the calls were meant for short term juicing of the position while the equity longs were meant as longer term positions to capture trend. I'm leaving the equity portion of the positions open (the positions were opened with the Equity and Options position representing 1 position for risk management purposes).

Again, this is "For now", I hope to re-enter these at better prices near term.

QQQ & IWM P/L & Market Update

The closing intraday 3C signals from Friday as seen in the The Daily Wrap (SPY, QQQ & IWM) all suggested price action pick up where it left off this morning on the cash open (3C negative divergences/distribution from Friday) which is a concept we have seen work over and over whether the very next trading day or even over 3-day weekends.

The Igloo/Chimney (top and head fake signal before a serious trend reversal) also seem to be in place with the Igloo/top not quite done on the downside before the head fake (chimney) after the Igloo/top is put in, but just before a serious trend change. Thus the intraday support building in. This is why I saw no reason to sit through a correction with time sensitive options when we can most probably take the gains now and re-enter them at better prices with more appropriate expirations/strikes, especially for the IWM expiration which was meant to be a short term position with June 5th expiration (usually about 3-4 times more expiration than I think I'll need and in the money).

As mentioned and shown in the A.M. Update this morning, just as we saw last week, it seems like the Durable Goods print was leaked ahead of time like so many recent Economic Data prints.

The IWM June 19th $124 Puts P/L...


The IWM puts were at a small gain of +6.3%, but I see no reason to sit through a consolidation in these time sensitive options when we should have an opportunity to re-enter them at a better area near term.

The IWM 3 min intraday shows a bullish reversal candle on higher volume this morning at the white arrow, often indicative of an intraday Flame-out or near term capitulation/selling event.

The 1 min 3C intraday IWM chart also shows an intraday positive divergence at those lows suggesting its looking for an intraday low to get a toe-hold which it seems to have found for the moment.

The QQQ June 5th $111 Puts... Entered Thursday for a near term quick trade, Trade Idea: SPECULATIVE QQQ Puts


At a cost of $1.20 and a fill of $2.20, these puts showed a nice gain of +83% for less than 2-days of market exposure.

 The intraday "Flame-Out" or short term capitulation/selling event on higher volume and a bullish "Star" reversal candle. The higher volume is key as it makes the candlestick signal about 3 to 4 times more effective than without the volume and this applies to any timeframe whether intraday , daily, weekly or even monthly.

The QQQ 3 min intraday chart showing the negative divergence in the Q's in to Friday's close with the 3C charts and price picking up where they left off on Friday upon the cash market open the next trading day. THIS CONCEPT WOORKS MOST OF THE TIME, EVEN OVER A 3-DAY WEEKEND.

Note this morning's leading positive divergence, still just an intraday signal so not something I'm terribly crazy about trading long, but it may serve as a nice set-up for the next shorter term short/options (Put) position. I'd much rather let the trade come to us.

SPY CHARTS... (as we had no position in the SPY-at least not in the tracking portfolio-although I suspect a few of you did enter SPY puts from emails I received last week).

The 1 min SPY intraday chart with a leading negative divergence at the close on Friday and price action picking up where Friday's 3C charts closed on Friday with heavy intraday distribution.

This morning you can see an intraday leading positive divergence suggesting an intraday base and bounce attempt coming shortly as a lateral intraday price range has formed.

However the much stronger 5 min 3C chart is showing a strong negative divergence through Friday and a leading negative divergence today, suggesting any short term intraday charts are just a minor intraday movement that we should be able to use to set up new short term positions and hopefully some longer term short positions.

Again the stronger 10 min 3C chart shows the same accumulation area as we see in nearly every chart we look at whether equities, commodities, currencies (some inverse-distribution like VXX) on the 6th and 7th, just a day before the "Bounce" forecast of May 8th and distribution in to that bounce which is clearly seen starting in to higher prices almost immediately and now the 10 min charts, the "Gas in the tank" charts which the positive divergences went out to on the 6th and 7th are falling apart and starting to lead lower as I have been waiting to see before entering new longer term short positions in size.

The longer 30 min chart and cycle with a "W" base back in March that is now leading negative as this move has come to its end. This was the "Triangles" breakout we had been looking for which were showing good timing for a  move at the 6th and 7th positive divergence with distribution in to the move above resistance or the breakout level where technical traders will chase price and provide demand that smart money can sell in to.

As for Index futures...
ES 1 min with a clear negative divergence in to the 8:30 Eco-Data as well as the 9:30 open (green arrow)  with the intraday positives since as seen above on the SPY, QQQ and IWM (averages).

NQ/NASDAQ 100 Futures showing a clear negative in an overnight range and in to the 9:30 cash open (green) with the same intraday positives forming here as well as the market averages.

And TF/Russell 2000 Futures showing a confirmed downtrend (green arrows moving down with price) as well as a leading negative divergence in to the cash open (9:30 at the vertical green arrow). Note the intraday positives since like all of the pother averages and Index Futures.

NYSE TICK Data
While not the normal TICK channel we'd normally look for, you can see a break below the channel at an intraday extreme (red box) with an upside extreme of +1000.

Our custom TICK / SPY Indicator shows the intraday breadth situation a lot better...
SPY in green above and the custom NYSE TICK indicator showing the intraday capitulation at the lows and then improvement after, this is generally where I want to be pout of put options before momentum starts to fade or reverse.

More to come...