Wednesday, December 28, 2011

This is true

I remember watching Bernakacides testimony saying explicitly he would not bail out Europe, of course I also remember when he testified that he would not monetize the debt too. However this is not just any critic and Ron paul is doing well in the polls, the "End the F_E_D" may be a dream realized. If you ever want to learn about a real scandal, search youtube for videos on how the F_E_D was actually created and the history of central banks before the 20th century. Republican, Democrat or Independent, it's my belief that Ron Paul is the only hope for our economy and the structure of the monetary system which will eventually collapse as every fiat system in history eventually has. Why do you think the government was all over the guy who started Liberty Dollars? That's another interesting story, there were entire towns using them. I'm not sure how they were different then commemorative coins on the Home Shopping Network and there usage was any different then a barter system? Taxes were still payed in Fiat, but they came down on him like a ton of bricks for one simple reason, it was catching on and would have made the F_E_D irrelevant. Think about the how the dollar has lost its buying power and then think about your grandparents who bought T-bills their entire lives. No, the US will probably never default on paying the debt (T-Bills) they will just do it with dollars worth 25% of what the original bond was leaving your grandparents with a 75% loss in buying power!


Any way, here's the link 

Financials Update

An example of what I expect short term and longer term using XLF.

 Short term positive divergences have stabilized the downside in the market, now we have a decent bounce positive divergence.

 However on the 15 min chart above and 30 min below, too much damage has been done, thus I'll use strength to short in to.

Look at this leading negative divergence, 2 days wiped out the entire bounce.

ES Hinting at a Bounce Too

See the relative positive divergence at the ES lows? That should equal a bounce, how much of it comes overnight and how much comes tomorrow are yet to be seen.

Update: Credit / Risk basket

For the most part we have good confirmation, High Yield Corporates are acting a little worse then the market, High Yield bonds in general are selling off at a faster clip then earlier this morning, commodities are in line, but financial momentum is a bit stronger then the overall market and the S&P is actually below the Euro correlation which leads me to believe 2 things, 1) the macro environment is getting worse as credit is selling off worse and 2) short term the market has maybe overdone it a little on the downside which argues for an oversold bounce as mentioned earlier. I'll be looking to add positions on any price strength as the macro environment is deteriorating.

The Euro is settling in around the $1.2930-$1.2940 area, so downside momentum has stabilized which will help open the door to an intraday bounce. Think about which stocks you like and set some alerts, you may get one last chance to set up some nice positions, (i.e.- AAPL).

Looking for a pullback to go long BGZ

I like BGZ for taking advantage of a swing type move, BGZ is a leveraged inverse or bear ETF for large caps (read Dow-30 stocks) and when the market really falls apart, there won't be safe haven trades in the large caps, everything gets dumped, so BGZ is in good position value wise.

 BGZ daily 3C sees accumulation at the lows, note the break below the support level yesterday as I have mentioned, head fakes are the last thing we see before a reversal. The white boxes in price are approximate accumulation areas.


 The 60 min chart did a LOT of positive leading the last 2 days, starting with the break below support, this generates supply that can be accumulated without moving price against larger positions being taken.

 The 30 min chart confirms, also note the parabolic spike in the yellow box on price...

 The 15 min chart is now in line with the others, good confirmation and look at the leading divergence on yesterday's break of support.

And the 10 min chart is similar.

Being an oversold bounce is probable, I would like to enter BGX on any market bounce as a swing length trade that takes advantage of a break down in the Dow as it still remains a safety trade as small caps underperform.

AAPL Update

 AAPL accumulation/distribution cycle...

 30 min Trend Channel long stop out..

60 min Trend Channel long stop out and ADX crossing below 40 signaling the end of the uptrend.

As the market could very well bounce, I would be looking for some strength in AAPL and maybe enter in a phased manner.

AAPL below $400 should be a pretty decent area to add a little more.  AAPL below $395 (so long as 3C confirms) would probably make for a good entry on the last 1/3rd position.

BAC Trade Follow Up

Yesterday I showed you BAC which was underperforming the market badly, I said I was thinking of shorting BAC and confirmed I bought puts on BAC yesterday, those January $6 puts are now up 27% in one day.

 Here's the daily, note the loss of momentum in the price candles and volume.

Here's where I bought the puts for the WOWS Options Model Portfolio, when BAC broke $5.50 (an obvious stop level), it was the final nail in the coffin. As BAC is one of the top 5 holdings or at least was, in most major hedge funds (think about Paulson's flagship Advantage Plus fund that lost nearly 50% of AUM with BAC as a top 5 holding), after it broke below the psychologically important $5.00 level, I have maintained it would bounce before year's end so hedge funds can engage in window dressing, 'The Art of Looking Smart" and sell their BAC positions in to some demand so they don't send prices lower. They want BAC out of their portfolio for their 2012 prospectus to new clients as holding BAC (especially as a top 5 position) after it lost over 65% on the year, simply doesn't look good. Isn't it interesting that BAC broke down late yesterday as the 27th was the last day of the year for hedge funds to adjust their portfolio because of the T+3 settlement rule? In other words, they used any strength, and BAC at $5.50 is a 10% move which is huge when you are talking about holding millions of shares, to sell BAC and get it off their balance sheet. As soon as the window dressing date passed, BAC started falling apart. I would guess BAC is headed back to sub $5.00 levels.

Here's a visual of underlying trade...
BAC (Bank of America) breaks $5.00 which is a line in the sand in white, as expected when it happened, BAC bounced to allow institutional money to try to unload in to some kind of demand rather then unload in to weakness and push prices against them. Right at the 27th, the 15 min chart goes negatively divergence and at the break of $5.50 is already leading negative.

You just saw Wall Street doing some year end window dressing, I think I'll hold BAC for now and maybe start replacing some financial ETFs with stocks like this and JEF among others.

5 inside days for JEF, also in good head fake territory.

A Sign of the times

You want to know just how bad things are in Europe, look at the ECB's balance sheet expansion for 2011...
That should tell you a little bit about how bad things are in Europe.

RIMM Update

I'm still holding RIMM long..


 RIMM has had a bad % day on the drop, but it has not shown the false breakouts that the other stocks/averages have shown, thus far it has managed to hold the breakout, but did run in to some expected resistance.

You saw other 30 min charts like the last one just put up, so far RIMM is holding up in confirmation.

Market Update

I just wanted to provide some perspective as it looks like we will get a bounce, however there are times when even Wall Street loses control of the market like in 2008 and bullish signals are useless.

 The earlier positive divergence caused the market to lose downside momentum and go in to a consolidation, a 3C positive divergence doesn't always mean a bounce, it can mean a simple consolidation like this, but I would prepare for a bounce as it has been a fairly strong day especially in the Russell 2k at -2.65% -remember this was the thesis behind my Santa Rally video, weakness in small caps doesn't bode well for a Santa Rally. In any case, a bounce would be normal and actually healthy so the market doesn't get oversold and keeps nice steady downward pressure on the market, parabolic moves in either direction are not good for the trend.

 The 5 min remains in line and leading negative so if we get a bounce,  wouldn't panic, but use it as a tactical entry, I know it is emotionally hard to short strength, but it is also the least risky way especially in the environment of multiple 3C timeframe confirmation.

Look at this 30-min chart, it's leading negative and has lost all gains in 2 days, this is incredible as it hits new lows! So the bigger picture is very negative, any short term strength should be viewed as an opportunity.

Chart Request-GDXJ Junior Gold Miners ETF

When I set up the gold miners trading system, which we need to get back to using, I didn't use the price of gold at all in my calculations. I found that the 2 most serious effects on gold miners (which used to lead gold, but that was nearly a decade ago) were FX rates and Energy costs. Almost everything else could be hedged or set as a known cost, such as the purchase of land or a lease, but especially for foreign miners outside of the US (remember that like oil, gold is traded in $USD) these two dynamics severely effected operations. Gold is sold at a fixed cost which obviously moves around, but when a foreign miner has to pay labor in the local currency and there are changes in that local currency vs the dollar, the cost of labor can become more expensive relative to the price of gold being sold, the same can be said for energy which mining requires a lot of. So when the price of oil goes up, again the local currencies value vs the dollar can often make labor and energy much more expensive to sell the same amount of gold. Furthermore like oil, the easy, low hanging fruit has been mined. Miners are now faced with lower grades of ore, they need more expensive technology to get to harder to reach deposits, it can take 10 years from the time of discovery of a new mine until it produces gold and the regulations, taxes and labor laws in foreign countries are more and more expensive, not to mention situations that might occur in a country like Venezuela as these miners have to travel to more remote areas of the world with unstable governments.

I have speculated that miners would pick up in value as they have the actual gold, but my analysis of GDX, NUGT and DUST all suggest miners are n for a bumpy ride.

As for the GDXJ, lets take a look at the charts.
 Instead of getting in to the complexities of Dow Theory to define trends, I have found that simple 22/50 and 200 daily moving averages (specifically the direction in which they are slanting) is nearly as good as Dow Theory. In this case the 200 (white) is the Primary Trend, such as bull or bear market, the 50-day (yellow) represents the intermediate trend and the 22-day (red) represents the short (Dow Theory) trend. Here all 3 are in downtrends, any long trade would have a lot going against it from the outset as you would be engaging in a counter-trend trade.


 Here's the daily top formation, note the break away gap in the red box, when we see breakaway gaps, the stock is in big trouble and this was never filled so it remains a break away gap. You can see one time when it was tested and the heavy resistance of the breakaway gap sent the stock lower on a failed test.

 A closer view shows another small top formation that broke down and provided resistance on a test in the red box, note the 3-day candlestick reversal pattern. After the failed test we saw another breakaway gap at the red arrow.

 Long term 3C looks really bad here.

 The 30 min chart shows a failed cycle and is in line with price, confirming the downtrend.

 The 15 min is in confirmation as well, making any long trade difficult at best. As for a short trade, there isn't a great entry point, you'd have to just jump in with a defined stop, maybe the latest break away gap...


 The 5 min chart provides more downside confirmation.

The intraday chart shows a positive divergence that has caused a consolidation, maybe we see some upside, but I would only use that to enter a short as this ETF is very bearish by all standards.

The Euro

The real problem with the market today started early this week. Monday I posted this on the Euro....

And I said,

"Last week we saw 3 consecutive smaller triangles in the EUR/USD, all showed (predictably) false upside breakouts that went on to fail. The series of smaller triangles has now formed a bearish continuation Descending Triangle. My thoughts are this too will show a false breakout, but the implications of the triangle are more serious as they effect the trend."


"Here are my horrible trendlines again, but a descending triangle is found exactly where this one is, after a downtrend and is a continuation pattern (bearish implications). I would think just like the last 3 FX triangles last week we will see an upside false breakout and then as I have suspected since before the FX bounce started when the $1.30 level was first broken, the end of the bounce allowing the substantial $1.30 longs to liquidate their positions using the bounce from sub $1.30 levels.

Remember the Euro and the market have roughly the same correlation, so a drop in the Euro would be a market negative event."

 In this post yesterday I noted the Descending Triangle (bearish) in the Euro.

I had said the following,

"Of course in technical analysis dogma a descending triangle is supposed to break down, but in the real worls we see these head fakes 80-85% of the time on obvious patterns and as I said last night (after 3 smaller triangles head faked 3 consecutive days in a row in the FX pair), this one would too, probably very early in the morning. It turns out it did so around midnight EDT."


So here we are now...
 This is the larger triangle, a continuation pattern as the Euro is ready to start a new leg down. When $1.30 was broken mid December, I said that the market/Euro would bounce, there are too many long contracts at $1.30 and they need to dispose of them and they will need strength in the Euro/demand, to do that. Sure enough we saw the bounce above $1.30, but it was always anticipated this would be used to exit the long $1.30 trade and perhaps go short. As I said above, a break of $1.30 will mean trouble for the market and the trend as the Euro and the market are so closely correlated (which is actually a proxy for the $USD/Market inverse correlation as the Euro is the biggest FX component of the Dollar Index at 50%). Remember the head fake breakout, there it is in green, this created demand and allowed FX $1.30 longs to sell/short the Euro.


 Here is the more recent and much more bearish descending triangle, again with the breakout that I suspected as the pattern is too obvious and the FX market too big for it to be ignored.


Yesterday on the breakout, look at 3C, that was the final nail in the coffin and one of the reasons I made my first video in probably 6 months on the probabilities of a Santa Claus rally.


Now that the Euro is under $1.30 for the second time (the first break of important support almost always sees a countertrend bounce), the market is in a much more dangerous downside situation.


With the Euro at $1.2931, it lost 141 pips in roughly 4 hours, a monster move.

XLE/ERY Update- ENERGY

Energy and crude both have their difficulties in trading, while USO/Crude can be easy in so far as that currency or $USD value has an inverse effect on it, it is also susceptible to geo-political events like the Iranian 10-day war game exercise they are engaged in right now in the Straights of Hormuz where much of the world's oil passes through, while the aircraft carrier John C. Stennis is in the region. The potential for a mistake with all of that going on in a rather narrow strait can cause crude to break away from the $USD inverse correlation (as crude is sold the world-over in $USD, a weak $USD means oil prices rise and a strong $USD mean they fall in general.

XLE/Energy is difficult because it too follows the dollar, but it is not just crude, there are all types of energy and logistical components as well such as pipelines, drillers, explorers, etc.

Here's an Energy update as well as our short on energy, ERY.
 Yesterday XLE had a false head fake of its own coming out of a triangle intraday, declining volume s useful in identifying consolidation patterns and distinguishing them from just random price patterns that look similar.

 Here on the daily chart, the 50-day moving average has provided support and resistance with serious breaks of the 50-day leading to sharp sell-offs, we saw one around late July. Right now XLE is near the 50-day and should get a little support, but a break of the 50 day could potentially lead to a sharp sell-off. I consider Energy to be one of 3 important industry groups that the market needs to move higher, although there are 10 main industry groups, energy, Technology and Financials are essential to the market being able to sustain a rally.

 Like USO, the 30 min Trend Channel has held swing trends in XLE, as you can see the Swing up trend was broken at the red arrow with a current short trade stop around $69.80 currently.

 Again, like USO, XLE looks like a pre-planned cycle in which smart money accumulates (white) and then marks up price and sells in to strength as well as shorts. I call these cycles, they are manipulations of the market or at least they are put in place to run in tandem with a market cycle, they generally aren't long term changes in trend, but swing trades. The 15 min chart alerted us to problems in XLE as well with sharp distribution at parabolic areas, these parabolic areas offer Wall Street demand to sell short in to, this is why I say parabolic moves generally aren't healthy moves.


 The 10 min chart gave confirmation


 And the 5 min which is leading negative also gave confirmation at the exact same areas of parabolic price movement, it is hard to sell short in to that kind of strength emotionally, but it is usually the least risky area to sell short in to.

 Note the 2 min chart confirmed distribution also at the same 2 areas and now is showing a mild positive divergence suggesting  an oversold bounce, much like the rest of the market.

 The Euro in red was also warning that XLE was breaking away from its correlation and warning of a frothy/manipulated market.

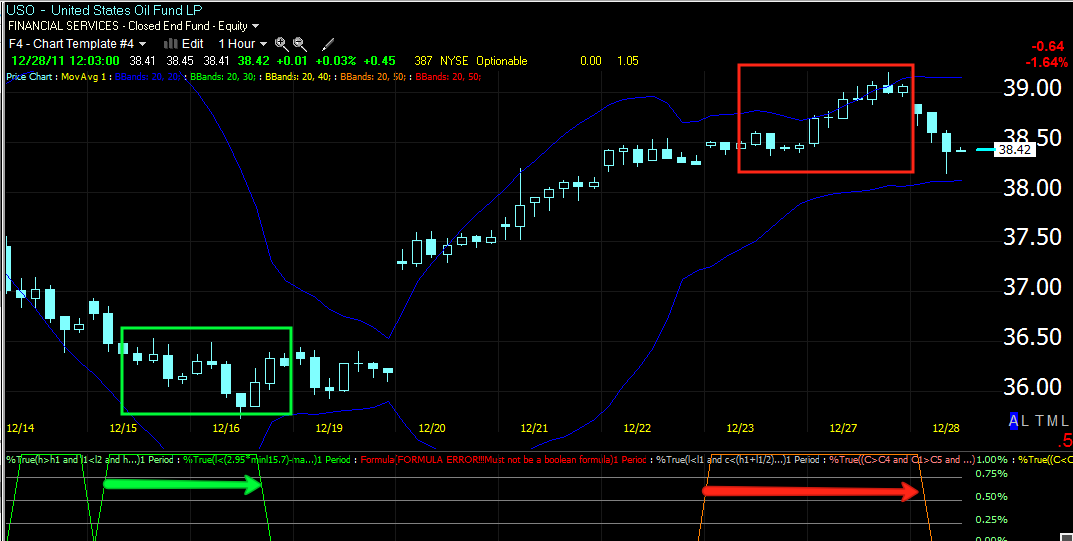
 The same can be seen in USO (generally XLE/USO trade with the Euro).

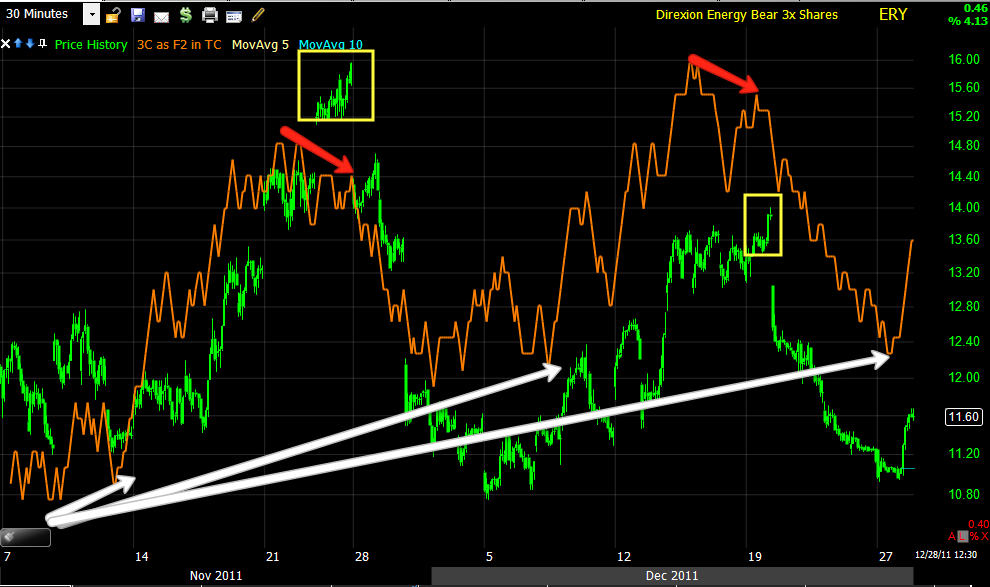
 Here is ERY which is in the model portfolio as a directional short on energy, ERY looks to have been forming a "W" type of base, note the last few days of downside have seen very small bodied price candles and lower volume, a sign that downside momentum is running out. This is also the type of environment accumulation occurs in to.

 The 30 min ERY chart has shown accumulation near the base lows and when prices move too far away from the target area, they let out some supply and send prices back to the target accumulation zone, note accumulation has been stepping up recently.

 The 15 min chart shows accumulation in to a flat-ish trading range, very typical.

 And the 5 min chart shows heavy accumulation near yesterday's price lows, again this may have been a head fake of sorts with traders providing supply for Wall Street by shorting those breakdown lows. We see this same pattern on bigger daily chart formations as well, again it is the head fake concept and is at odds with everything technical analysis has taught us about market bottoms for nearly 100 years, however it is what it is and it is the way the market operates, traders for the most part just haven't accepted it.


Here's the same accumulation in ERY on a 2 min chart, the theme here is the alignment of multiple timeframes with the 15 min chart positive, this is a very strong signal.

I plan on holding ERY, it is not even close to its potential with a breakout coming at the $14-$16 dollar levels. As the ETF moves in my favor, I plan on reducing the directional use of ETFs and replace them with stock picks as the market starts to act less directional and starts showing who is who in the zoo, it is becoming a better market for stock picking rather then purely directional plays.

USO/XLE Update

Yesterday USO looked like it was getting ahead of itself and setting up for at least a decent 1-2 day short trade to make a little extra cash. As of the last update, using the Trend Channel as a trigger for the short trade USO was a short at a break below either $38.80 which would represent a false breakout from an ascending triangle or $38.70 which was the Trend Channel long position stop and change of trend to down.

 Here's the Trend Channel and the break of both $38.80 and $38.70, I'm a huge fan of real time alerts which would have let you know USO was breaking those levels and allowed you to open a trade which I suggested using the leveraged crude short, SCO.

 Here's the false breakout yesterday from a bullish ascending triangle, trader would be buying on the pattern alone, much more on the breakout. The trigger for the USO short was a failure of this breakout at $38.80 which means we would be looking at a head fake move. The parabolic spike in the middle of the false breakout ALWAYS attracts my attention as they usually fail.

 Here's the 30 min Trend Channel which has held the swing trade moves both long and short in USO, an entry at $38.80 would mean that you would have a zero risk trade as the Trend Channel for a swing trade is now at $38.80 as the stop out level. If you caught this trade, email me and let me know.

 I also pointed out the sell signal on the hourly chart of my custom DeMark inspired indicator as well as an earlier buy signal.

 The main problem for USO came with the very bad looking 15 min 3C chart, here you can see accumulation at the lows, distribution at the highs, a cycle. These are generally pre-planned cycles as there is accumulation of shares to sell in to rising prices.

Confirmation came in the form of multiple timeframes in 3C aligning, like this 10 min chart

As well as the 5 min chart which really went downhill around the time of the false breakout's parabolic spike.

We'll take a look at Energy and ERY next. The market has lost downside momentum and has been under intraday accumulation so a bounce should develop soon, you may want to consider using that price strength to enter positions you have had your eye on.