Tuesday, September 20, 2011

Predicting the FOMC

Sound crazy? It is, although there have been many economic reports we have predicted as well as earnings, all it takes is a strong 3C signal. And why do those 3C signals work? It's pretty simple, the market is that manipulated that we are actually watching what Wall Street is doing. This is how we have been in every up and down move the last 6 weeks to the day, sometimes to the hour.

Today was a surprise as I expected the market to sell off hard and fast and to see strong positive accumulation by now, but that was more me putting the different pieces together then it was 3C telling me, "The market will fall hard and fast". Friday we expected Monday to be down and it was, Monday we had a signal that the market would rise so I and many of you covered a portion of our shorts and then entered them at higher pries, which made us some more money. However today was not on the radar. I think it's one of a couple of things: 1) Overnight the European action changed the value of the Euro dramatically from yesterday's close 2) It could have been part of Wall Street's tactics (tactics are a means to a strategy), 3) Saturday's post may have been right on and we may have seen a shift in what Wall Street was doing, perhaps the Fed hanged course over European events. Remember, Geithner was just over there and to tell them what they had to do? That could have been done by a press conference. In any case, 3C straightened out the day and gave the direction of the market and all was well again, however, my thoughts about the FOMC are not in alignment with the 3C signals. The weak part of Saturday's analysis was always the timing. The market would have to sell off VERY hard and we'd have to see very strong accumulation in 2.5 days, that hasn't happened.

If I had my way, the market would drop 6% tomorrow morning, I'd cover 3/4 of my short and let the rest rise having locked in a profit.

However, we are dealing with the FOMC, first what will they say? Second, what will the knee jerk reaction be? There's almost always a knee jerk reaction and it's almost always wrong. Third, what will the real reaction be?

We've had 2 Fed events in which we have been told by the analysts and the media, "If the Fed doesn't give us QE3 tomorrow, the market will fall 600 points". Both times the Fed gave us just about nothing and both times the market was fine. Actually the first time launched the first rally after the August decline! So lets say the Fed gives us substantially more then in the past 2 meetings, a trillion dollars of QE3, but the market expects 2 trillion, well, the market could sell-off. What if they Fed gives the $hypothetical $2 trillion the market wants, then the market say, "Oh boy, we got it, we must be in bigger trouble then we thought" and again the market sells off. Or the Fed says, "We're still watching the economy with a lot of tools" and that's it, who knows, maybe the market rallies. As you can see, besides point 1, 2, and 3, we have what drives the market, sentiment and that can be unpredictable. I find the best way to play the market is to do what smart money is doing and as of today, it looks like they are in distribution mode or just finished it and getting ready for a solid decline. This is part of my Saturday theory, the short interest is so high and the margin interest, a break to a new low and a rally after that (a head fake) would do the most damage and make Wall Street the most money. This may still happen.

Heck, one year we got the signal that smart money was running from the market at 12 p.m. right up to 2:15 on a FOMC announcement. My theory, someone leaked the embargoed announcement from the media to Wall Street so we may still get some signal that points to direction.

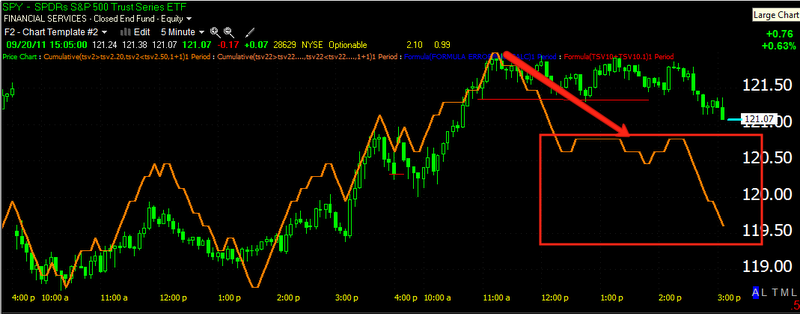
Beyond that, 3C looks very negative at this last cycle top and a new low makes sense with what 3C is showing. Last week this was about the average size top/distribution event within the last 6 weeks, as of this week, it s the largest we have seen since the market fell from the late July top.

I showed this chart earlier, but here it is again...
intraday lows by mid morning, many of us took partial profits on our shorts and as the market went higher (3C had given us warning this would happen before we ever sold our partial position), we then re-established the shorts at a higher, better price, so we made money in the morning and re-established the full position in the afternoon. As of last week, this distribution area, Point (J), was between the depth of Point (D) and Point (F), or about average, which made sense from the accumulation zone for the move up at Point (I). Now Point (J) is the deepest and longest distribution zone of this entire 6 week period. What this tells me is that the accumulated shares were probably all distributed last week and since yesterday Wall Street has been adding to their short position for the move down. You saw the distribution today as prices went higher, Wall Street always shorts in to strength or a trading range-we saw both today.

It seems Wall Street is getting ready for a new low which will lock in just about every trader in to a short position. Furthermore, the Bear Flag that was present last week has now taken the shape of a bearish ascending wedge, traders are keying off the price pattern. To take the market to new lows would set up a historic bear trap, then to lift the market from there as we have long term indications that may be the plan, would force a massive short squeeze as margin and short interest is at multi year highs according to the NYSE.

The Dollar-
 This is the dollar represented by UUP in green and the SPY in red, you can see there's an inverse relationship between the two, a stronger dollar generally means a weaker market and a weak dollar means a strong market.

 Looking at 3C for UUP, the 5 min chart looks bullish for the dollar

 As does the 10 min chart

And the 15 min chart, to the left you an see a negative divergence in red that sent the dollar lower.

As of this moment, the dollar is trading a bit weaker then the close on Euro strength.
The Euro is close to the levels seen this morning that helped send the market higher earlier. But just as I warned last night when the Euro was very weak after the Italian S&P downgrade, a lot can happen overnight.

Another correlation is between Copper and the market.
 Here is FCX a copper stock in green vs the SPY in red, note Copper topped out well before the market did, but it tends to work on all timeframes.

 Here's and hourly timeframe and you can see FCX diverging and heading lower while the market was climbing in the early afternoon, only to see the market give up most or all of it's gains in to the late afternoon session.

This 1 min chart gives you a closer view, Copper topped at the red arrow, it wasn't for another 3.5 hours before the market topped and headed lower.

Here's a look at why I think we could see a huge short squeeze in the not too distant future...
This is the daily hart of the S&P-500 going back to late 2009. You an see accumulation May-September of 2010, this is in anticipation and at the point Bernanke announced QE2 at Jackson Hole, Wyoming. You can also see distribution over a long period of time at the top. This most recent period is the shallowest trough since 2010 and hints that we may see a move up in the markets, this is a longer term perspective.

A head fake by setting a new low and setting a bear trap would create a VERY strong short squeeze that would send the markets much higher, for a time at least. Nothing will stop the eventuality we face on the downside.
This 4 day chart goes back to the accumulation of 2003 that started the last bull market, the 2007 top and now you can see how much worse our current divergence is, leading negative on a 4 day chart. Bernanke has built a huge house of cards and the higher he stacks them, the worse the fall will be. This chart already indicated the fall will be worse then the 2008 fall. However, I think we are still a ways off from this eventuality.

So why would I prefer to take substantial profits early tomorrow and leave only a fraction of my shorts in place? Quite simply said, the volatility around FOMC decisions. As I mentioned, the knee jerk reaction is almost always wrong. I would rather reposition myself after the volatility, but I will most likely hold if we do not get the chance to take the kind of downside profits 3C seems to be indicating are on their way, I'll be sure to let you know.

Tonight Republican leaders have sent a letter to Bernanke and the rest f the FOMC board members, you can find the text here.

If anything exiting pops up before  turn in, I'll be sure to let you know.

Correlations

About 6 weeks ago I questioned whether historical and/or recent correlations would hold up, my bias was toward thinking they would not. We've seen the Gold/Market correlation go from 90-95% approx. to about 80%. Silver has fallen out with the dollar. A number of currencies have fallen out with the market and today we see the Euro/$USD have given ground vs the market.

For example:
 The SPY is in green, the Euro in red. Sure, overnight the Euro pulled a 180 degree turn from the time Italy was downgraded to send US market futures higher, but in the midst of today's rally, look how the Euro went sideways most of the day, and falling before the market, while the market exaggerated the bounce. I believe this happened more as a function of Wall Street tactics then anything, but even in afterhours, the market is down on most averages.

Yet the Euro has bounced since the market close. I just want to mention it in case you use as many different sources as I do to try to find confirmation. I suspect it will get worse in the near future.

Still Short

This newer indicator, the 3C divergence depth indicator has been helpful recently, especially with timing.  The first very deep blue bars are the decline in early August, a very nasty decline. As you can see by the lines I drew, it's usually right at the peak of the 3C depth indicator that we actually top out and the decline starts after that, today we put in a new peak and this is why I am considering yesterday and today's action as part of the same top. It also is the deepest distribution we have seen since the August decline, so it implies we still have quite a move down to go still. I can't say I am comfortably short, but I have faith in 3C, I've been in too many tight spots and had it come through. I'll still be watching for any changes, but for now I'll remain short.

Look How Bad AAPL Looks

 With the breakout of the last 2 days, AAPL is in very fertile head fake territory.

 The 1 min chart on a rounding top is leading negative

 So is the 5 min chart

 And the 10 min.

 The 15 min is also now leading negative

 This is where it is scary-the 30 min chart, price at new highs, 3C lower.

 The same on the 60 min chart

And on the daily? WOW.

Market Update

Here's some pretty surprising charts.
 DIA 5 min leading negative divergence and DEEP.

 DIA 10 min leading negative divergence

 DIA 15 min leading negative divergence

 DIA 30 min leading negative divergence!!!

 IWM 5 min leading negative divergence, also very deep.

 IWM 10 min leading negative divergence, also very deep

 IWM 15 min relative negative divergence

 IWM 60 min leading negative divergence-this is very negative.

 QQQ 5 min leading negative divergence

 QQQ 15 min leading negative divergence

 QQQ 30 min relative negative divergence-this is a very long timeframe.

 SPY 5 min leading negative divergence

 SPY 10 min leading negative divergence

 SPY 15 min leading negative divergence

SPY 30 min relative negative divergence

When I talked about my theory for this week and the Fed, the important part of seeing a positive divergence build in to the FOMC tomorrow would be a fast drop that is quickly accumulated, that wasn't something 3C could tell us, that was something I thought would need to happen to show a positive divergence in time for the FOMC. However, today seems to have been part of the top (yesterday as well) and we have some very significant timeframes that are negative-30/60 min as well as very nasty leading negative divergences. If we didn't have FOMC tomorrow, I would say including todays action, we'd need at least 3 days minimum to see this move bottom and turn to an up cycle. So this has definitely put a monkey wrench in what I hoped to see. In addition as shown earlier, this is one of the biggest distribution areas, is the biggest, in the entire flag.

So I'll be holding my shorts a bit longer unless we get a huge drop and trying to make some sense out of whatever signals lie ahead.

IWM Breaking on Volume

I just posted the negative divergences and this trading range hasn't been bullish for the market. The IWM just broke intraday support on some volume, those would be stops and that is why I recommend keeping your stops away from the obvious levels such as intraday support.

I may have to look at the FOMC theory in a different light. Today's action seems to have been meant to set up longs the same way Friday's close did.

It's too early to make definitive statements, lets see how everything reacts.

Volatility Indications

This is the VXX, a volatility indicator that has an inverse relationship with the market's direction.

Again, some strange readings as it almost seems as if our top is being reset for a downside move.
 VXX 1 min positive leading divergence indicating accumulation

 VXX 5 min positive leading divergence indicating accumulation

 VXX 10 min positive leading divergence indicating accumulation

VXX 15 min positive leading divergence indicating accumulation

Market Update

The Euro, which the market was following early today, has moved down quite a bit, near support, the market has remained locked in a trading range, which is also the type of price action we commonly see distribution/accumulation.

Here are the 5 min charts of the averages.
 DIA 5 min leading negative divergence

 IWM 5 min leading negative divergence

 QQQ 5 min leading negative divergence

SPY 5 min leading negative divergence

A Broader Example

This is the QQQ 15 min and I'm able to show more history.

The first two red arrows to the left are the market top at June/July that led to the nasty late July/early August downtrend. From there we predicted the downtrend would subside and it did. We've had several cycles up and down in this bear flag which we have caught all of them. If you look at the bar chart below, this is the current cycle, which last week on Friday I said I thought it may have a few more days in it. The FOMC part is where a lot of confusion comes in because this flag is obviously much more shallow then the distribution of the top and decline. If you look at the two red arrows on the bar chart next to each other, the first us yesterday's depth if negative divergence, the second is today's which is even deeper, suggesting distribution in to today's move up. It is also now the deepest negative cycle since we saw the top as it added more negative depth today.

Example Chart

In the Inverse ETF post I noted certain inverse ETFs look like they are re-setting for a move down in the market. Here I'm using the DIA as an example with the 3C bar chart.

At the red arrow is the negative divergence on Friday that was expected to be the top of this up cycle, Monday we got a big gap down and then a move back up. You can see even though price is higher now then Friday, 3C continues even lower. Looking at the bar chart below (shallow areas=accumulation, deep areas=distribution) you can see the depth of the negative divergence at the first red arrow on Friday and the depth of the negative divergence today on this bounce higher, which would indicate that there has been distribution in to the move higher today as the average charts have shown, but it's almost as if this is still 1 major top with the even deeper spike down today.

I'm holding my shorts here.

Some Interesting ETFs (Mostly Inverse)

 EPV UltraShort Europe 15 min leading positive divergence. This is one of the interesting ones, it's almost as if it is setting up a completely new cycle for a move up, Europe MSCI down.

 ERY Energy Bear 3x this 1 min chart is positive and leading, this is what I would expect looking at the averages.

 ERY 5 min positive leading

 FAZ, another leading 15 min chart, again as if the cycle that just set up for a move down in the markets on Friday is resetting.

 SDOW Short Dow-30 1 min leading positive.

 Strangely though, there's a 10 min leading positive, again as if it is resetting.

 SPXU 1 min leading positive-Short the S&P-500

 And once again on the 15 min chart, a leading positive divergence.

 SQQQ Short the NASDAQ 100 1 min leading positive, which I would expect.

 SQQ 5 min also leading positive.

 SRTY 1 min leading positive, it seems that today's move up has been under distribution as the charts of the averages suggested.

 SRTY positive 5 min divergence.

 TYP-Technology Bear 3x- long 1 min positive and leading positive divergence.

TZA 5 min leading positive divergence.

What is really strange is to see the 15 min charts almost resetting, I wouldn't think we have enough time to complete that kind of downside. Of course there are a lot of undercurrents from Europe-good and bad news and the FOMC tomorrow.