Friday, May 9, 2014

Looking Ahead

There's definitely some positive activity today on intraday timeframes which leads me to believe we'll probably see some positive activity early next week, for instance, the SPY...
 SPY 1 min

However the 2 min , while a bit positive, isn't that impressive, 3 and 5 min aren't anything more than in line

SPY 5 min

The QQQ 2 min looks decent, usually 3C divergences pick up where they left off, so my gut instinct would say early positive price action Monday.


 The 2 min Q's are not that impressive, there's a lot of what I'd call rotation, although that's generally seen in a healthy market. For instance, look at the IWM's close vs the SPY's.

With a QQQ 5 min chart like this, I'd find it VERY hard to justify taking any long position and that's something I may have considered (1-day call position) if all of the averages had charts like the IWM below, but had formed a second base (with today's lows being the first part of a "W" 2-part base)

 IWM 2 min

IWM 5 min, if there were a second move down to this morning's lows with a continued positive divegrence, I'd have considered a quick options trade so long as the set up were there.

We might just get that chance.

Take a look at Futures...
 This is the 1 min ES chart, there's almost no chance that the signal here would hold up Sunday night, overnight to the open Monday morning, but it does show some trend of distribution which may just be wrapping up positions before the weekend.

If we were to see some very early positive price action, because this 5 min chart isn't supportive, I doubt it would go far. You may recall there was a time in a choppy market like this (not quite as bad), that long or short trades depended almost exclusively or at least had the final say, right here on a 5 min chart. The way this one sits, it doesn't support much of a move.

However this ES 15 min does have a positive divegrence and could just allow enough space for the market or IWM to put in a more solid base as mentioned above, something like a "W".

Ad I demonstrated in this post, Perspective with the DIA, there really needs to be some overwhelmingly strong signals to take long risk against the market's backdrop.

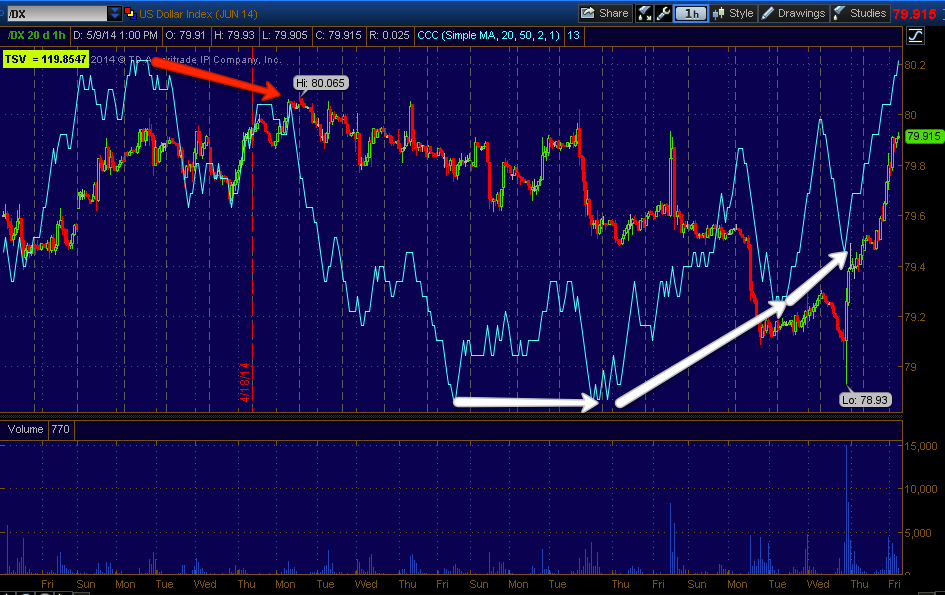
Since USD/JPY has been and as far as I can tell, continues to be the only real trigger out there as $102 $.22 away and acting as a huge psychological magnet, that can move the market, the signals there continue to be some of the most important for the moment, whether "considering" a long trade or getting a great opportunity at setting up shorts or add-to positions.

The only areas ES breaks with the FX pair are resolved quickly with either accumulation on a short term basis or distribution on the same (yesterday saw distribution).

Of course the assets that move the pair are the single currencies, Yen and $USD. From what I can see, the Yen seems to be locked on downside trajectory (5 and 15 min charts), the $USD's 1, 5 and 15 min charts all look like it pulls back, that would explain the nature of any very short term strength early in the week (I'm thinking specifically Monday) and I do mean short term, so much so that I wouldn't even consider a 1-day options position. However the $USDX's 60 min chart is positive, so again this could be along the lines of a double bottom or "W" as mentioned before with regard to the IWM 5 min chart above, of course the market would have to pullback to do that so again, any price strength would likely be VERY short lived and a pullback would be the only real hope for a base significant enough to get a bounce off the ground that can be trusted for a day or two.

The VIX Futures continue to migrate out to a stronger divegrence as we had a 5 min and today added a 15 min and by the close it looks like a 30 min positive has been added. 

As for VXX/UVXY, they continue to see stronger underlying trade...
 VXX 5 min


VXX 10 min

UVXY 15 min and spot VIX

Finding support around the area, this fits very well with the DIA "perspective" post, especially on the urgency of the timing.

My overall opinion continues to be, "If we miss a long set up, I'm not too concerned as the Risk/Reward perspective looks very poor unless something big changes and still that would only be short term".

Otherwise, any price strength is more or less a gift to sell short in to assuming we can get it which I think is probable being USD/JPY $102 is so close by. However there's no reason I can think of that the pair need do anymore than cross $102 and trigger orders, I see no reason that it need run higher or linger, in effect it would be setting a bull trap.

It might look something like this...
Daily SPY...

As for GDX/NUGT, Gold and GDX do have a good correlation, this is the first time in a while I've seen a clear divergence in gold futures,
 5 min gold futures leading positive


GDX intraday

The more important 5 min chart...

Honestly, although I expected it and wrote on Monday that the repair of the 10 and 15 min charts would be the key to the GDX/NUGT long trade, it was kind of hard to imagine... At that point we still hadn't even broken below support which is something we expected to happen first in order to repair those charts.

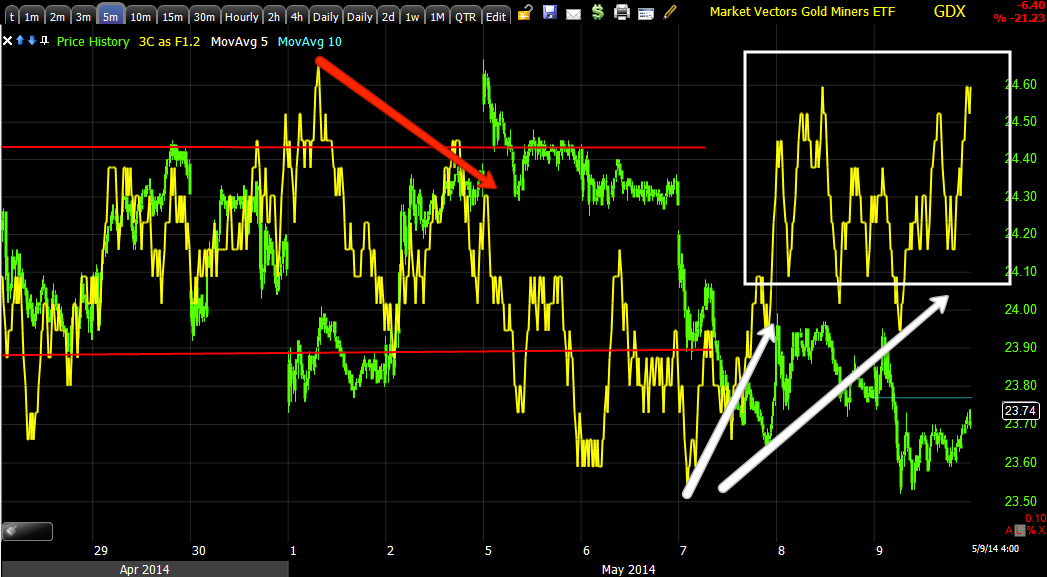
Just look at the leading positive 10 min above and the leading positive 15 min below.


The 30 and 60 min are already there.

I think we probably have a little more time to get positioned here, but since I'm expecting more of a trending trade and that's been hard to find in this market, I wanted to get some exposure and then add to if the opportunity arises.

So, while I think we have some short term details and maybe some smaller trades that we need a little more market information on, the set up for the big picture is looking very ripe, again I'd refer you to this post, Perspective.

It's more details right now than anything else and the market will give us those details as we move forward as it has very clearly with positions like GDX which was trading at a breakout, 3C or the market via 3C told us it would fail, price would move below support and the 10 and 15 min charts that were nothing but negative would repair, all of that happened this week.

Enjoy your weekend, I have a feeling things are going to be a lot busier than what we've seen the last several weeks, perhaps even months.


Trade-Idea: GDX / NUGT long (speculative)

I'm going to go ahead and enter a half size trading position in NUGT 3x long gold miners, GDX is the underlying asset. I'm leaving room in case there's some more downside, but the signals continue to improve here and I think whether it's a day or a week, NUGT and GDX are going to fire and on primary trends, not swing so I'm going to go ahead with some exposure to the asset.

MCP Update

Wednesday I believe, I opened a speculative size MCP long, because it was in front of earnings, here is the post, MCP Update/ Possible Trade and this is the previous update MCP Follow Up / Trade Set up.

MCP's earnings didn't go well, but this reminds me of the RIMM trade in which it was just before earnings, there were a number of very strong 3C charts and we took the trade, earnings flopped or the stock did any way, but the 3C signals remained strong. I'll have to dig up the posts from that trade, but I believe we were down 15+%, maybe more, but the signals remained strong. I think it was about 2-3 weeks later that the twin CEOs of RIMM stepped down in a major shake-up and RIMM shot up, we ended up closing the trade at a gain of somewhere in the mid-teens, even after having been down so much.

We weren't seeing an earnings leak, we were seeing accumulation though, just for a different reason, a major board room shakeup and the 3C signals told us the entire time, "Something favorable is going on and that's what gave us the objective evidence to stay in the position.

In any case, here are the charts for MCP,I said earlier that we needed to see it start moving laterally, that's where we'll see accumulation and there's more than enough volume,

 This is a bearish triangle within a larger base in MCP, there was a breakout and we were long with about a 6% gain when I didn't like the way it looked (no 3C confirmation) , but worst of all, this asset after basing for over a year was not likely to move to a stage 2 breakout without putting in a head fake move first, so we exited the long at a small gain at the first yellow box and I have been looking for a head fake move BELOW the triangle ever since to get long again.

While this is an earnings inspired move (head fake or not) so was RIMM's, as long as the charts look decent still.


This is a wider view of the larger base and the triangle, the problem was there had not been a shakeout of the base, the move of the last 2-days certainly qualifies as a shakeout, creating supply is what it's all about to be accumulated in size and on the cheap by smart money.

 I said earlier, "we need to see some lateral/sideways movement", that is just starting to form now, this is where we'll see if the divergences go wild or not.

So far the early 1 min is starting to accumulate, this is just a start.

The 3 min is in a positive position which is surprising, unless it was a really bad move in which 3C moved to a lower low, I suspect this is being accumulated along the lines of a shakeout of the major base above.

And the 5 min chart, there's plenty of supplly, that's what a head fake move creates, whether a true head fake or not, there's plenty of supply.

Whether this works out for my partial position  or not, I think for a new trade at some point this is going to be a nice entry, just from a market maker stand point, rather specialist, they need to unload the inventory they've taken on at higher prices.

And the 10 min chart, it's not the long relative positive divegrence that I like, but the small leading positive of the last day or so.

And the 15 min in that nest of supply.

So I'll continue to hold MCP until or unless the signals give me a reason not to.

Finally on a long term basis like the large stage 1 base, this mullti-day 3C chart, highest probabilities went from in line on the downtrend to accumulation/leading positive at the base, a head fake move usually occurs or a shakeout, just before a transition to the next stage which would be 2, up. So I'm going to stick around, "Maybe" even add if the charts give me reason.

Perspective

In an earlier post today I tried to show short term signals and what direction they'd likely take and what 
I think the risk is and where the probabilities are and why I'd rather (from a risk perspective) short price strength and underlying weakness which is already evident (underlying weakness) and not likely to change, rather than try to trade this market long which is dangerous in several ways  including the meat grinding choppiness of the market, the multiple timeframe analysis with multiple trends in stage 3 or 4 and the signals which are the probabilities, I showed you all of this with the SPY, QQQ and IWM, but I didn't realize how well it can be seen and understood using the DIA.

Her are the charts... *Note that I'm not saying there's nothing out there I'd trade long, I'm saying the evidence would have to be overwhelmingly strong and as you know I like to trade these moves both ways, but there's a time to be careful and if ever there was a time it's now more than ever. This applies to individual equities (stocks) too because the broad market is responsible for about 2/3rds of the movement of any given stock on any given day, meaning the greatest influence on whether your FB or GOOG trade moves up or down is the general market's direction that day, there are caveats like news and earnings, but generally speaking the market is the most powerful gravitational force on individual equities, about 2/3rds.

I'm going to say there are 3 cycles (probably more), but the ll of the except the NDX is the February cycle which is still relevant.

The medium cycle that is still in effect is the bottom or base of April 11th (which is when we first noticed it and started moving things around to take advantage of it (which started moving around April 15th). 

April 11th posts... Market Update "So far, nothing "seemingly" unusual, it looks like a normal op-ex pin. However there are some interesting developments in both the shape of price (reversal process) and the divergences building beyond simple intraday steering currents which are in effect" 12:44 p.m.

Closing SQQQ (long) Trading Position 1:10 p.m.

EOD--- "Really simple bottom line, I think we have a base developing, not much has changed today perhaps due to options expiration, but there's still not enough for me to jump in yet and thus I'll wait it out and see what Monday brings." 3:56 p.m.

April 15th

Broad Market Update "apparently working on a larger "W" base. I do believe this is a tradable base and that we are VERY close to an area where we can take some low risk/high probability positions, however I have no reason to move the targets on the upside I posted Tuesday and Friday of last week, posted again today." 1:16 a.m.

Trade Idea: Opeing QQQ May $84 Calls "I think I'll go with a full size position here." 12:54 p.m.

Trade Idea: Entering URTY Long (3x leveraged long Russell 2000) "This is a trading position, full size." 2:56 p.m.

These are just a few example posts; you know it's been a while since I put out multiple full size positions all the same day or closed multiple shorts at the same time, that's because we were at a low risk, high probability entry and look at April 11-15th, you'll see it was the bottom of a pivot and new medium term cycle.

The small cycle started around April 28th and is still in effect.

DIA charts
 DIA 1 min intraday with the distribution yesterday at the highs as the market broke north of the USD/JPY correlation, then positive divergences today intraday that came down in the afternoon due to movement in the USD/JPY, but even more than the movement, the underlying floe of trade, we see that with 3C, but they can see that via order flow, market makers, specialists, etc., they have a better feel than anyone for which way something is going to move before it does, that's why we can see these signals because we are following their lead.

 For perspective, this is the same 1 min chart viewed at the trend level even though we usually use it for intraday signals. This is the short term cycle from 4/28 and you can see we'd want to be out of longs by 5/1 or 5/2 as distribution set in, lateral chop and downside.

Look at the current 3C signal now at slightly higher prices.

 This is the 2 min chart, it was positive intraday today and saw a negative with the USD/JPY

Look at the same chart's trend view, these are not high probability long signals.


 5 min DIA with distribution yesterday at the highs, a positive divegrence today and what appears to be in line at the green arrows. However, look at the trend of the 5 min chart.

 You see the clear, strong accumulation of the 11th, 14th and 15th, you saw the posts above, exiting shorts and puts on the 11th and entering calls and longs on the 11-15th. Really I'd want to largely be out of most of those ;longs by distribution at the 22nd through the 24th, after that it just becomes a meat grinder with all of that chop, very difficult to maintain any position and this is why there have been so few trade ideas recently because the market is not conducive, but we don't know that from the trend, that comes after, we know that from 3C before price has even moved.

Look at the current leading negative divegrence.

 This 10 min chart takes out a lot of detail, but a lot of noise also and reveals underlying trend cleanly, it's clear there's a leading negative divegrence.

Think about it, the only hope we are seeing for the market is a short term move in the USD/JPY above $102, that's not a lot to hang a long trade on.

 The 10 min chart (same as above) in the short term cycle from the 28th which is really in stage 4 a, it broke from the top to decline and saw the first thing that happens after the move to stage 4, a volatility shakeout and it looks like we are nearing the end of that which should send the DIA back to stage 4 decline and a lower low for this short term cycle, but also the medium and long term cycles as well.

When multiple timeframe analysis lines up, it's like hitting 3 cherries on a 1-arm bandit (slot machine).

DIA 15 min chart, I labelled the February cycle that is still in effect with larger 1-4, I labelled the April 11-15 medium cycle with smaller 1-4 and I labelled the April 28th cycle with even smaller 1-4.

Look at the 3C leading negative divegrence.

This I kept clean, a 60 min chart of DIA from the start of the Feb 3rd cycle, the red area would be the top or stage 3 (depending on the average) or some version of stage 4, typically the volatility shakeout bounce.

Note the 3C trend, that's as clear as I can make it. 

We want to trade moves like the Feb 3rd base and we did and get out before it turns in to a meat grinder (red box) and get back in on price strength for a move to the downside.

USD/JPY Carry Trade

And that's the one, I checked all of the other "Usual Suspects",

 This is a 1 min chart of the USD/JPY pair in green/red candlesticks and ES (SPX E-Mini Futures) in purple, so the tall spike about 23rd's across the chart around $101.84 is around the open of regular hours today, to the far right is current price (at the time of capture a few mins ago).

As you can see, the correlation is not perfect, but it's the one.

Take a look at the same comparative analysis on a longer 5 min chart.

Here ES runs up yesterday (red box) above the ALGO sanctioned correlation and it gets promptly...? You saw the charts of yesterday's highs, it gets distributed, I'm not sure if Yellen said something yesterday or what caused ES to run north of the FX carry trade, but the algos made short work of the arbitrage opportunity. Otherwise, the correlation is pretty darn tight. Thus making USD/JPY, still the pair of greatest interest and the most likely asset to move the market in the near term, in the mid to long term, the distribution trend is the most likely driver of price.


This is a 1 min intraday chart of USD/JPY, unfortunately with FX pairs, the 3C signals are usually only good on the a min and sometimes 5 min charts, after that they're useless so I look at single currency futures of the components, $USD and JPY (Yen).

We see negative divergence signals today and this is one of the reasons I put out a quick note that we'd likely see some downside, but this is just intraday stuff.

This is the Yen intraday in line, so what's moving the pair lower?

The $USDX has a nice leading negative divegrence and that should move the pair and Index futures a bit lower, depending on how long it takes to fire, it looks ready to turn soon.

 The 5 min Yen has had a negative divegrence for the last 2 days, that fired and turned the Yen down which helped USD/JPY on the upside a bit, but this signal is just in line right now.

It's the 5 min $USDX that looks bad and is likely to cause the USD/JPY to fall, that should take the market down with it, but I'm talking about "pullback", at least at this point.

During a pullback we'll see if there's accumulation or not and that will tell us if USD/JPY is building a bigger base, if so, then $102 will likely be taken out and the market moves up with it, that's what I want to short in to.

If not, then we are likely to transition from stage 3 and these different areas of stage 4 to a normal stage 4 decline and I think this is the one that brings the SPX and Dow down below the Feb lows and the QQQ to a new lower low as it already retraced the Feb. lows.

 I've covered this a dozen times now, this 15 min leading negative divergence of the Yen is the BEST hope for the USD/JPY to bounce above the important psychological level of $102 where all the stops and action is, that would move the market up on a bounce and that's what I'd want to short in to because this is as far as the Yen negatives go, the 30 min chart is in line.

As for the $USDX, it doesn't get positive like that (USD up and Yen down = market up) until the 60 min chart.

However as recently noted, the long standing $USD Legacy Arbitrage correlation is a strong dollar=weak stock prices, weak precious metal prices, weak oil prices, commodities, etc and a weak dollar is the opposite. This is a decades long correlation that we haven't really seen since the F_E_D started destroying the $USD via printing/Quantitative easing, but as they dial back the Treasury purchases and wind down QE3, it seems we are seeing hints of the old Legacy correlation so that's something to pay attention to, if it becomes reliable, if you know what the $USD is likely to do, you have a handful of assets you know which way to trade and vice versa.

Volatility was Monkey Hammered on Monday to lift the market, however, from what I've seen I think Wall St. knows where we are and where we are going better than anyone and it looks to me that they've been pinning the VIX futures at low prices to accumulate on the cheap, their positions are much larger than ours, they don't get filled in an order or a day.

 The VIX futures 5 min chart has been leading positive, there's a slight relative negative, I think that reflects the positives I showed earlier today in the market averages as the VIX trades opposite the market.

However the VIX futures divergence has migrated to a stronger 15 min chart (meaning the accumulation process is stronger). It seems someone is afraid of something and are collecting VIX futures in anticipation of that downside event.

This is the 15 min VIX futures, I'll try to update the VXX / UVXY charts if I get a chance, but these last 2 hours of the market are when I gather a lot of very useful data so I'll be paying attention to the signals in the market across a wide range of assets.