Most of these charts I captured over an hour ago as a few things came up (positions) while I've been putting this post together.
I just double checked that nothing major changed, note VXX is down to a new intraday low, however none of the averages moved to a new intraday high, this is the quick move down that has been thus far, accumulated, it seems there's even more urgency to pick up protection from a downside move, but as I mentioned before and quite frequently,
it's retail that chases prices, the pros let price come to them, buy weakness, sell strength, a lot of the same stuff we do, not to be contrarian, but that's where the signals are.
So other than VXX moving to an intraday low, nothing I'm trying to point out more broadly (which is really just fine tuning yesterday's
Forward Planning post) has changed.
VIX Futures 3C chart for the new intraday low...
Not only are we still positive , but at the move to a new intraday low we are even seeing an increased positive 3C ROC.
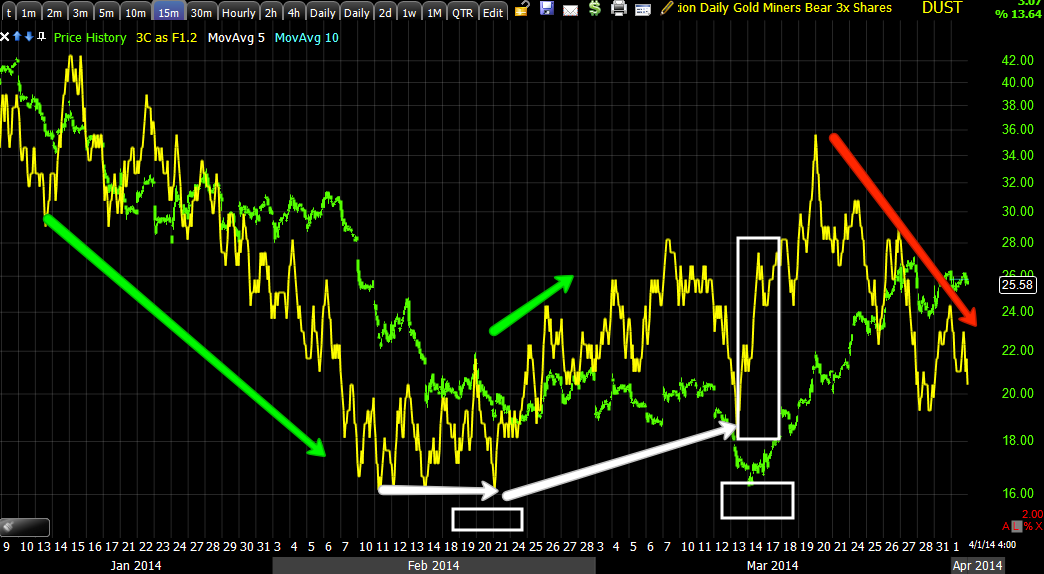
I posted this earlier, I was showing how VXX's relative strength through Feb/March had been running very high, it was fine, it showed protection being bid, but for my purposes of timing, I needed to see a break lower that was under accumulation.
There's the trendline which was broken, but to really pick up supply which is what head fake moves are about in large part (or demand) as institutional positions are much larger and can move the market against their position if entered at once or in too big of a chunk (not to mention the predatory HFTs that ping for iceberg orders and front run them causing institutional investors a lot of money on bad fills), the lower trend line is where we should see volume pick up, that means supply is more abundant as well making it easier to accumulate a large position without drawing too much attention to yourself.
Here's that same chart now, just pushing through support, I'd expect volume to pick up and just like that, "SUPPLY"
The overall accrued trend in VIX Futures remains positive, this is the trend of underlying trade as the VIX/VXX finally broke down Friday after there was quite a bit of hanky panky in the options.
As far as the market, I'm using the IWM (Russell 2000 ETF) as a proxy because it has moved to stage 4 and the volatility shakeout. Quite often on the VT shakeout price will linger under resistance fooling traders in to thinking it's a failed attempt at resistance which they will short, then it moves above and they are shaken out too, there are a lot of different ways to make money for the locals from volume rebates, the B/A spread, fading the book, etc. so a lot of that is what we are seeing when price stops under resistance and appears to fail on a volatility shakeout after a H&S neckline is broken or in the IWM's case, the stage 3 top's support line.
This is the last cycle to be run, we saw this in real time and knew this was coming. Recall my Feb 4th post saying, "
This move has to be strong to flip sentiment, it will likely be so strong that my inbox will be full from members asking..."Are you sure?" with regard to the next trend (down) even though I put the warning out in advance of the first point on the upside in an effort to anchor expectations as this can be very emotional and that's not good decision making.
From Jan. 27th accumulation started in a week long trading range, we expected a head fake move BELOW the range and got it on a 2+% day down and at the second "!" we built a small "W" and reversal process and had a decent accumulation/base which is stage 1.
#2 is mark up or stage 2, #3 is "top/distribution" and #4 is stage 4 "Decline", the "5" is the typical volatility shakeout as new shorts enter on a break below support and they are shaken out.
If you are familiar with this concept with regard to H&S tops, it's exactly the same as the VT shakeout after the neckline is broken on the downside and new shorts enter, they place stops just above the neckline or resistance (former support) and the market runs them. It's when this shakeout starts to go negative in the shorter to intermediate timeframes that we enter shorts and get ready for the next turn down.
I didn't participate in many longs, actually none yesterday although I felt this was high probability, the reason why is the signals for longs we so weak that I'd be gambling with no objective evidence and on concept only which is fine, but not when you are at the tail end of stage 4 with volatility and thus unpredictability picking up. These are the situations in which you can have a 2% day up and the next day have a gap down that takes out 3 or 4 months of longs on the open...i need very strong evidence to go long here, I'd rather wait and set up the shorts.
This is the 5 min IWM chart, as I have said since last Thursday, the 5 min positive was the largest (timeframe) positive we had seen in a week or so, but it only lasted 1-day, that is the base/small foot-print I've been talking about. If you only put a gallon of gas in your car, you aren't going very far.
The 5 min chart is already weak, even though it had another minor positive at the broken white arrows, instead of 3C leading it's actually in a relative negative divegrence which is the weakest form, but the fact we have a negative on the chart is the point taken with the small foot-print/base.
Really without levers like SPY Arbitrage, HYG, the Carry Trades to push the market up, the best chance is a short squeeze on the IWM volatility shakeout, but that only lasts so long and last I saw (yesterday) retail is very bullish again (Investor.com).
The IWM 15 min chart went negative, then in line or downside trend confirmation , there was
NO POSITIVE ON THE 15 MIN CHART, so there wasn't a very strong divergence at the base area and since as you can see, we aren't even getting confirmation as 3C is leading negative (not huge yet, but it should be holding up a bit better).
Of course as far as probabilities we just look to the longer term charts like the 60 min which has been telling us for a while that this market is in trouble and since the signals appeared, the R2K has already touched stage 4.
Intraday 2 min IWM (as of earlier) was seeing negative divergences,
almost as if any price strength is being sold.
I use to judge the market by looking at a watchlist of several hundred stocks a night, if I saw more were short set ups I'd know the market was getting ready to turn down and vice versa, I have more effective methods now, but I still watch bellwethers and momo stocks, depending on what's in rotation.
PCLN as a proxy for equities...
I'm seeing a LOT of individual equity assets SETTING UP, not quite there, but setting up shorts, remember this is exactly what my game plan was in yesterday's post,
Forward Planning which means we should have some time to weed through them and find the best looking set ups, but the point is they are in sync with the market, there's deterioration already to what should (normally) be a shift upside shakeout, I don't know how much the HFT scenario is effecting trade, but the underlying trade is no where near as strong as it should be and the VXX underlying trade is exactly what I was hoping to see, much stronger than it should be.
This 2 min PCLN chart is showing clear distribution of higher prices, that's how smart money rolls out of necessity, but it's also the best way rather than selling in to weakness as most retail traders do (hold on to strength and don't start selling until they've lost a fair portion or all of the gains).
This is the PCLN 5 min chart, it is in line, which means while there's deterioration, it's just getting going, the shorts we want to enter in to some strength off the IWM shakeout are starting to move the direction we want them to be in when we enter, but as you can see we are not there yet.
This means if you're not trading the market long,
which I am not unless I have good objective evidence to do so (and normally I would be with calls), it's time to sit on your hands and be patient.
I know you are probably sick of hearing it, but in the words of Jesse Livermore...
...JESSE LIVERMORE:
"IT WAS NEVER MY THINKING THAT MADE THE BIG MONEY FOR ME, IT WAS ALWAYS THE SITTING"‘MEN WHO CAN BOTH BE RIGHT & SIT TIGHT ARE UNCOMMON’
I'M SAYING, "PATIENCE", for me personally as a trader, this was one of the hardest things to learn because I felt that like any other job, to get ahead you needed to be productive, you needed to be busy, but with trading, this is not so. There are so many things we are conditioned to since childhood that really hurt our trading, such as the expectation society has pounded in our heads that you need to be right at least 80% of the time to be considered even mediocre, that notion has probably cost traders more money than anything else.
As far as leading indicators, remember earlier we talked about Credit, especially High Yield and how it leads the market, well lets take a look today.
*All leading indicators are compared to the SPY/SPX in green unless otherwise noted...
Note the leading properties of HYG vs the SPX, it led the SPX down and it led it off the intraday lows, but CREDIT led...
There was a dividend today that knocked HYG down, there's a small 2 min positive so it looks like there's a little levering going on here, but as I said, it's small and only 2 min.
As for HY Credit vs the SPX, here's the recent trend (dates below) and the SPX following.
Intraday...
Again Credit led the market down and led off intraday lows. Right now it's flat, this is much different than credit leading positive so I'd say this has a slight near term bullish bias, but a VERY weak one that can flip in a matter of hours to something VERY different, another reason I'm VERTY careful right now with long exposure.
While we are looking at potential levers to move/manipulate the market (VERY SHORT TERM), lets look at the other two SPY Arbitrage assets, TLT and VXX.
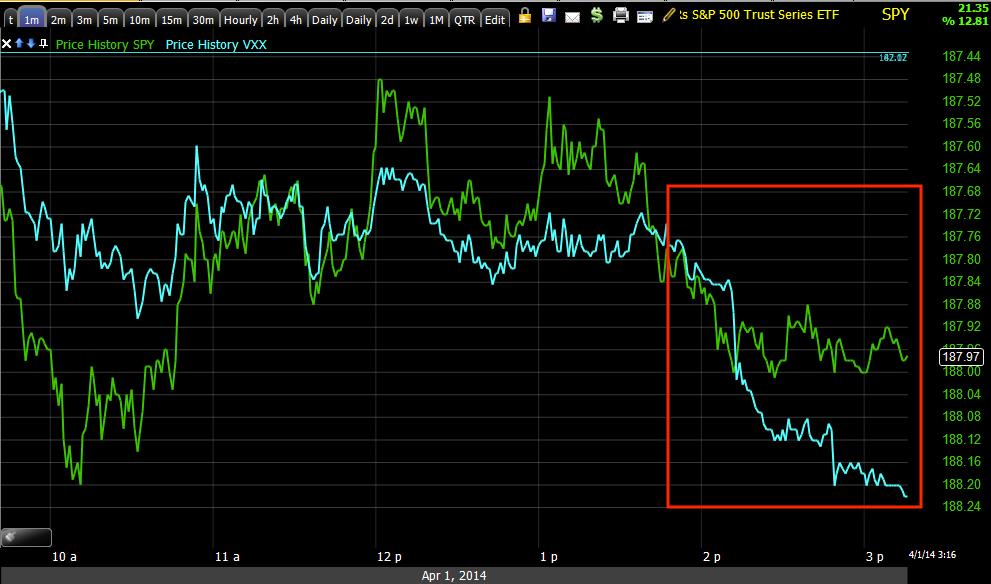
This is VXX intraday vs the SPX, except I inverted the SPX's price so you can see the natural correlation and the relative weakness in VXX, I already told you why I think that is and we have positive divergences so that's fine, if HYG moves up with VXX moving down that could activate the SPY Arb, but there's a 3rd asset in the scheme.
This is TLT (20+ year Bond) vs the SPX intraday with SOPX prices inverted so you can see the correlation, TLT is a flight to safety trade and even though it is down today, the flat trading range should ring some bells, in fact I checked to be sure and it is NOT being set up for the SPY Arbitrage lever.
Look at the intraday accumulation in TLT, that's a flight to safety and most definitely NOT a SPY Arb set up. VXX is a flight to protection and we are seeing positives there too as you know so the market is telling us something clearly which we should already know just from staging the IWM and applying the Volatility shakeout concept.
Here's the accrued position in TLT near term, but on a respectable 5 min chart, a leading positive divegrence. I'll likely be closing some TBT longs very soon.
Longer term Professional sentiment is clearly falling off vs the SPX as you can see, this happened yesterday as mentioned, but it did ramp in to the close, today is even worse so it appears they are not biting. The shorter term version is in line with the market, but not leading, telling me we have some more to go, but we already know that just from looking at the reversal process in VXX.

Here's the leading qualities of FCT/Sentiment as it led the market on the upside and it is now leading the market or giving a leading negative indication,
so I don't think the market has much upside and other than the IWM's shakeout, as I said a week or so ago, "I don't think this has anything to do with a market based head fake, I think it has to do with accumulating VIX futures/VXX and the market trades opposite them"
Also one of my favorite leading indicators, Yields went negative yesterday and added today. Yields are like a magnet for equities, they pull equities to them , but as I said yesterday, this dislocation could be a lot bigger.
So for now as I mentioned, I'd sit tight, be patient, there are some assets here and there we can trade, but as far as setting up the next round/pivot, I'd just sit tight and lets keep gathering objective data (our edge).