Today the market was up big on a big move up in the Euro, it basically traded in line with the Euro most of the day. 3C did a good job today of catching the front running HFT's on many on the intraday moves, but the real importance is in the forest not the trees. I listened to an interview today by Joe Saluzzi and I think it's a great quick piece to listen to about the new trends emerging in an otherwise, wasteland of a market regarding volume and participants.
Considering where the market is, it's interesting that we have seen 24 weeks of continuous outflows of money from Domestic funds. Insider selling has been unreal at ratios of over 2000:1 some weeks, this is the first week the ratio was sub 1000 but still in the hundreds to 1. Over $81 billion dollars has come out of mutual funds this year. The unemployment-the real number according to u^ is over 17% and a compelling argument has been made that it's closer to 22.5%-although we only see the headline U3 number. The U6 number (which is the same as the way they counted during the Great Depression which topped at 25%) had a huge jump last week.
Without going into all of the ins and outs like Fauxclosure gate and the “millions of foreclosures that could be affected and other various sundry figures, here's Joe's take...
http://tinyurl.com/23qbzlk
One today's front, as I expressed last, sometimes you can get caught up in the lines and miss the bigger picture. Today the market had a great start and it gave up a huge advantage leading us with some ominous signals.


Above, the S&P-500, declining volume, an excellently formed shooting star closing a little more then 1 point off its lows, a MACD negative divergence, declining volume and an RSI divergence that's also crossed below 50-one of my personal sell signals in a cross over system I have showed you.
Looking at the daily negative divergences (this is the forest view of the market)


The same with the SPY, 3C is lower now then it was at the August highs with recent action sending 3C lower.
On Intraday timeframes...

The SPY 15 minute..-shows extreme selling into today's gap up.

The Q's which have led the market both higher and lower showing an important hourly negative divergence
All this while the VIX daily positive divergence (which trades opposite to the market) is getting stronger. The last divergence at the white arrow slammed the market, this one is much bigger.

The first positive divergence barely reached leading status, this one is way into leading positive status.
As for individual trades, bear or bull, there are always great looking trades on either side of the market. Here are some recent movers and some recent ideas that look really good.


URZ is up 25% since it was bought in early October, also on the list (bought in the white box). Again, look at the positive trend in MACD

VNDA was on last night's list, I said I think it'll reverse to the upside soon, it put in a VERY impressive Hammer today (bullish reversal signal/support level). Volume was up on the move. Again, look at the MACD trend vs. the market, this is how it should look, it should move up with price, not down.
As for BAC which I've been talking about for awhile-seeing a bounce, as I said last week (Friday?) that we'd see a bounce in GLD and USO), I think we'll see a bounce here.
 Here, 3C 5 minute shows a positive divergence brewing-just like XLF (The financials I mentioned several times today). If you are a nimble day trader you may want to consider it long, but I think the greater opportunity is in the longer term view as a short and using any strength to build or add to a short position here.

 Here's my Trend Channel set for a Trend Trade. So long as the upper channel is not violated on a close, the trade is still a short and adding near the top of the channel makes a lot of sense to me.
As for currencies, the market was more or less dictated by them today so the EUR/USD pair is worth a look.
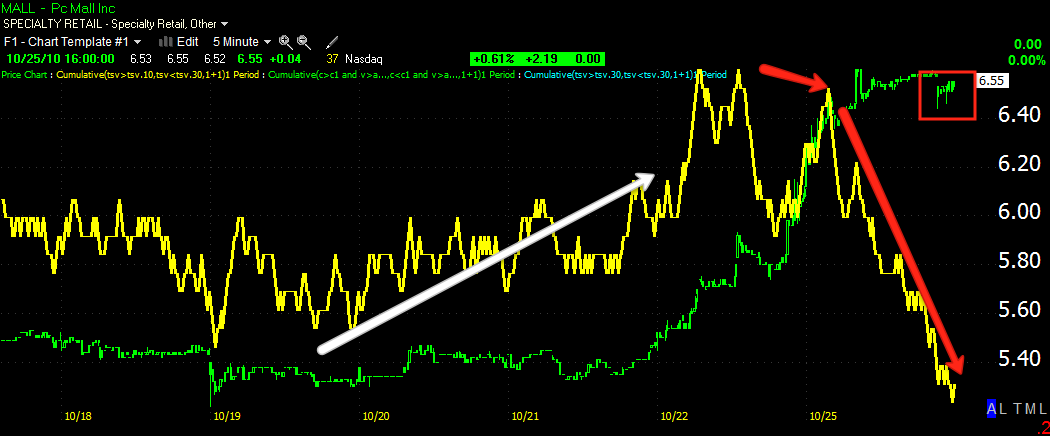
 Here's the 5 min FX pair. You can see to the left at the red arrow where this week's open gapped up. You can also see where all of the advance has already been retraced and we are trading near the levels where it opened, much lower then where the US equities market gapped up, the pair was much higher by then.
 Here's the hourly chart, there was a strong EUR trend in place, the fact that it's even gone lateral is cause for concern for market bulls as a rising dollar means falling equities and commodities. If you look at the red arrow, we have something that very much resembles a H&S top and we'd be on the downside of the right shoulder. a break below that red arrow would be a bottom for the USD as many charts are indicating, the GLD trade would be shot to pieces as would many market averages. A lot can happen over night, but this is definitely a chart worth watching.
Tomorrow there will be more individual trades up, maybe some "After Market" earnings plays.
As for BAC which I've been talking about for awhile-seeing a bounce, as I said last week (Friday?) that we'd see a bounce in GLD and USO), I think we'll see a bounce here.


You can see where BAC took out some important support on a 5-day chart-look at the volume. AGAIN, I DO NOT PLACE STOP LOSS ORDERS with brokers, it's no different then showing your hand in a poker game. The technical traders do it every time and place stops at obvious levels and put them on the books and they get hit every time-look at the volume for proof!

As for currencies, the market was more or less dictated by them today so the EUR/USD pair is worth a look.


Tomorrow there will be more individual trades up, maybe some "After Market" earnings plays.


