Wednesday, October 26, 2011

Addendum

This ES chart seems to validate my theory.

 This ES chart shows the market being ramped on early positive rumors before the open. Then there was a negative divergence on the open just as we saw during the day in the regular charts. Around 1 p.m. accumulation was finished at the white arrow. Since that point a negative divergence through the entire rally or distribution. In after hours you can see it's leading to new lows.

This is after hours and right now it's even lower then this chart as price starts to fall.

Today looks like the day they turned the machines off, otherwise the Dow would have been down by over 300 points in early trading and they may have found it impossible to get back to break even.

ES Closing indications and the Strange Trade Defined!

When I said I think something is up, it was hard to put in to words, but this ES chart may be worth a thousand words.

From left to right, we see the same negative divergence on the open in ES as in the market, there was pretty good volume there and a ramp on news just before, those may have been some significant losses taken early this a.m., remember ES trades about 1.1 billion contracts a day at 50x the price of the S&P 500 (as of the close about $62,100 per single contract).

 I just did some tedious rough math based on the volume of contracts and an average price for each 15 min time period (high of the period minus low of the period divided by 2 and added or subtracted to the high or low depending on whether the market was heading down or up). In essence, I calculated the average share price per 15 minute time period-tedious.

This is filled with assumptions, but it's meant more to be an example then anything else. We started off the day with good news and thus we can assume there was an intraday long position, what that would have been I have no idea, but the negative divergence on the open sent the market lower and the volume multiplied by the average contract price would have led to a loss of $953,340,349 (the real number would be multiplied by 50, but for ease of example, we'll just go with this)

Morning loss of $953,340,349
Midday accumulation according to 3C  $570,748,461
This is where it gets tricky because it's hard to say where the most distribution of shares would have been (at what price level)
Afternoon distribution would have been $1,438,526,452
Less the cost basis of accumulated shares= $867,777,991

Conclusions: Even though this is very rough math, the morning loss would have been $953,340,349
After accumulating near the lows and subtracting that cost, the afternoon net profit would have been around $867,777,991 or a difference of -$85,562,358 rather then over 10x that amount.

So however you figure the math and it's really impossible to know, you can see a clear incentive to lift the market in the afternoon to make up for massive losses sustained in the morning. No matter how far off my assumptions may be, there's clearly an incentive. I think this also has something to do with why we saw the downside in the morning break with the typical EUR/USD correlation that has been so strong, if that correlation had held, the losses would have been far, far greater. I also think this is part of the reason that the correlation in the afternoon was broken as well, except this time instead of the market running behind the correlation, it was running far in front of the correlation-in essence playing defense on the way down and playing catch up on the way up.

I have been struggling for some time to create a version of 3C that can essentially compare the volume/dollars of a negative divergence vs the same for a positive divergence. I just did that more or less by hand and that's what I came up with.

I think it also partly explains why USO lagged the market so badly, when they are both correlated to the same thing, further evidence of the market running in front of the EUR correlation in the afternoon.

This is USO in green vs the SPY in red. The white box is an example of the daily mismatch between yesterday's EUR/Market close in which the market "if the correlation had held) would have been much, much lower. And in the red box, you can see how the market is playing catch up and running ahead of USO exactly at 1 p.m. right after the accumulation period would have ended and the rally started.

As a further example, the EUR/USD correlation to the Dow-30 is 1 FX pip equals roughly 2 Dow points.

Today in the early EUR/USD sell-off, from open to low, there was a -157 pip move. This would equal  negative 314 Dow points. Instead the Dow lost an incredible -13.32 points from open to low!

If we take the morning high to the morning low of the EUR/USD we saw a loss of 175 pips that would equal 350 DOW points.

Instead, the DOW from morning high to morning low lost 172 points about half the normal correlation.

By contrast the Dow rallied off its low to the close by 196 points. The EUR rallied of its low to close by 110 pips-much closer to the correlation, in fact only 24 points off, whereas the previous example in the morning was off by 300 points!

I don't know what the correlations for the S&P-500, NASDAQ 100 and Russell 200 are, but in terms of percentage I would imagine they would track the same as the Dow-30. Not so in today's rally off the lows to the close, here are the results:

DOW-30 (which in the afternoon rally was very lose to the 2 point correlation) +1.4%
SP-500 +1.7%
The NASDAQ 100 +1.86%
The Russell 2000 +2.7%!!! Nearly double the DOW and presumably nearly double the correlation between the Euro and Russell 2000!

So those strange things I was noticing today, but didn't have time to figure out what they were, here's what they were.

Short Term losing Indications

 DIA

 IWM

 QQQ

SPY

EUR/Market

The market is not only rick compared to the Euro on the day, but locally this afternoon as well, someone shut the algos down.

 SPY/Euro

DIA /EUR

 FXE 1 min

 FXE 2 min

FXE 15 min.

Something is definitely up and I don't have a bullish feeling about it.

USO/Market

As a member correctly points out, there is a strange divergence between USO and the market.


Compared to the close yesterday of the Euro, the market is rich in valuation right now, the correlated equivalent would be about SPY 123 as of right now so it's about 1.6 points rich or 160 S&P points.

E-Mini Futures

As you will see the 1 min ES futures as far as intraday trade has thus far been right on today. If that track record keeps up, then, well you'll know.

A negative divergence on the open sending the market lower, the 11 a.m. positive divergence sending the market higher, a small negative sending the market into a small downward slope right in to a positive divergence sending the market higher again. However the biggest divergence of the day (this afternoon) is yet to be fulfilled.

TICK INDICATOR

And some other strange market events.

I found it strange that the market's correlation with the EUR/USD didn't work so well on the downside. I won't hypothesize, but just note it.

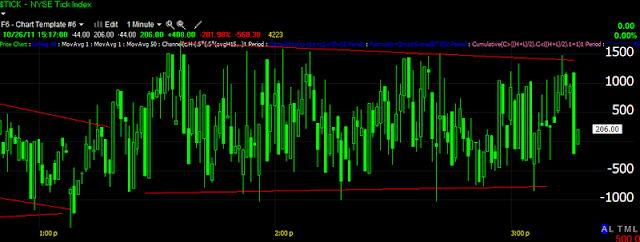
The TICK chart is pretty much trendless, oscillating between +1400 and -1100-quite  a range.

Short Term Market Update

 DIA

 QQQ

SPY

EUR/USD at resistance

Italy Comes To The Table-better late then never

As per Reuters:


Italy promised European Union partners on Wednesday a package of reform steps to boost growth and control its public debt, including labour and pensions reforms and additional revenues from property divestments.
In a letter sent to an EU summit in Brussels , the government said it would put forward a firm plan of action to boost growth by Nov. 15.
It promised measures to cut red tape and modernise state administration to improve conditions for business.
It also said the minimum age for old age pensions would be raised in gradual steps to 67 years for both men and women by 2026.
The letter also promised to raise 5 billion euros a year from divestments and improved returns from state property.

So in effect, the URGENT call to Italy Sunday night to get pension reforms underway won't be fully implemented until 2026 at which point the Euro as well as the European Union will likely no longer exist and World War 3 should be wrapping up on the European continent.

So much for urgency.

Herman Von Rumpuy Chimes In

The two agreements reached were:


1) They have agreed to a date in which to kick the can down the road


2) As far as bank recaps go,


"Short term recapitalisation is needed in the current exceptional circumstances to create a temporary buffer allowing the banking system to withstand shocks in a reliable manner. Agreement has been reached that banks should be required, by 30 June 2012, to have 9 % of the highest quality capital. This figure should take into account a marking down for sovereign bond holdings against current market prices (as of 30 September 2011)Banks should raise capital in the first place from private sources, and only if that is not possible, seek support from national governments. If the latter support is not available without creating systemic risks for the Eurozone, the EFSF should provide the loans for recapitalisation.
Any form of public support, whether at a national or EU-level, will have to comply to the rules of the state aid crisis framework. The Commission has indicated it will be applied with the necessary proportionality in view of the systemic character of the crisis. With these measures, we restore confidence and put Europe's banking sector on a sound footing."

This is so full of holes it's hard to know where to start. I guess you can start by what is missing-THE COMPREHENSIVE EU SOLUTION TO THE CRISIS INCLUDING ITALY AND GREECE AS WELL AS LEVERAGING THE EFSF-NO MENTION OF IT.
At least he acknowledges the "shocks" that are coming to the banking sector.
The 9% capital is nothing new, this was reported weeks ago, so no meeting was needed for this.
" This figure should take into account a marking down for sovereign bond holdings against current market prices (as of 30 September 2011)."
Here's a real problem, banks need to raise something like double their current market capitalization, to make it even harder, all of the bonds of PIIGS that have thus far been marked to par will have to be marked to market immediately causing huge losses that will also have to be overcome in their effort to recapitalize.
"Banks should raise capital from private sector sources"-THEY ARE LOCKED OUT!
If that is not possible, then they must turn to their national governments, but they  will have to comply to the rules of the state aid crisis framework.  Which is different for each government, Greece and the rest of the PIIGS are in no place to recap banks.

Only if they can't raise capital through steps 1 and 2, "the EFSF should provide the loans for recapitalisation."
Note the word "Should", not "we have agreed on this course of action" and how could they when they have not agreed to leverage the EFSF which as a Finance minister stated could be "Swallowed in one gulp by Greece alone". Furthermore, they still have no idea what the banks will need, but it sounds like close to a trillion dollars of which at this point the EFSF only has $440 billion dollars.

BOTTOM LINE-A HUGE DUD


As Predicted RIGHT HERE and EVERYWHERE ELSE...

The EU summit would be big on plans, scarce on details.

Lets get started-this will be fun!


  • EURO ZONE PLANS TO LEVERAGE EFSF BAILOUT FUND "SEVERAL FOLD", FINANCE MINISTERS TO DECIDE DETAILS IN NOVEMBER -- DRAFT EURO ZONE SUMMIT STATEMENT
  • DRAFT EURO ZONE STATEMENT MAKES NO MENTION AT THIS STAGE OF ITALY'S REQUIRED BUDGET STEPS
  • NO AMOUNTS SET FOR BANK RECAPITALIZATIONS
Point 1, the leverage of the EFSF was supposed to be decided today, I guess they are taking a page from Congress and maybe will create a super committee and kick the can down the road a bit further until they actually figure out what they are dealing with-which s to say, until they realize that they are in an impossible mess.

Point 2, Italy was pressured to make promised changes as of Sunday night, those changes seem to hard to come by in Italy, so lets just leave that one out and maybe no one will notice :) (smiley face)

Point 3, They already set bank recaps at $110 billion, now we are going backwards which actually makes perfect sense as pointed out before, 3 stress tests later and they still have no idea who has what and how much liability, very reminiscent of US sub-prime write downs circa 2008 when banks would tell us, "We have written down all of our subprime exposure" only to be followed by 4 consecutive bigger write downs.

Next Batch or Rumors-Statements:

First can we get some "Mission Impossible" theme music in the background?

  • EU-27 RELEASES STATEMENT AFTER BRUSSELS SUMMIT
  • EU-27 SAYS COMMISSION MUST URGENTLY EXPLORE BANK GUARANTEES
  • EU SAYS BANKS SHOULD FIRST FIND PRIVATE SOURCES TO RAISE FUNDS
  • EU SAYS STATE AID RULES ON BANKS SHOULD BE PROPORTIONAL
  • EU SAYS MID-TERM BANK FUNDING MUST HEAD OFF CREDIT CRUNCH RISK
Point 2) Must urgently explore? This work should have been completed months ago, again they have no idea of who holds what and what ticking time bombs will blow when they embark on any policy course. The first step to solving a problem is identifying and understanding it-at this ground breaking summit to save Europe, they haven't even gotten that far.

Point 3) Banks have already made clear that valuations are too low for them to voluntarily seek out capital, it makes no sense for the banks to seek capital at fire sale prices, they made this clear weeks ago. Secondly, they also made clear that they are locked out of private capital markets and rightly so as no new investor will put money in to a bank when they have no way of knowing if that bank is about to implode. This is a pure, desperate, idiotic statement. What banks WILL DO is stop all EU lending and as I pointed out 2 weeks ago, European businesses use approximately 80% bank loans to run their businesses as compared to 30% in the US. You think the US credit freeze was bad, just wait and with that goes all hopes of green shoots when it comes to EU member's GDP.

Point 5) Directly contradicts point 3, explanation above. If a bank can't raise capital which they can't and the EFSF is not going to give it to them, then the policy will be shrinkage and as we know, that means no loans, this way they bring down their liabilities effectively nullifying point #5.

This is too easy, even for a hack like me.


NEWS

As I mentioned, the news will be hot and heavy today causing a lot of volatility and anything EU related needs to be taken with a grain of salt, such as this last rally intraday.

I've had a lot of questions as to what has been driving this and I found the first of many answers. There was a rumor that the Chinese bailing out the EU about 12 hours ago!


This from the AP 12 HOURS AGO!


"China to take part in eurozone bailout fund"
Actually 13 hours ago.


3 hours later, Reuters refutes this very same rumor.
 China has backed efforts to tackle the euro zone's debt crisis but there is currently nothing concrete concerning support for a special purpose investment vehicle (SPIV) of the euro zone's bailout fund, a Chinese diplomat said on Wednesday.


More Sewing Circle Rumors on the way....

TYP Update

 TYP vs the NASDAQ as they are similar, its trading pretty much inversely as an inverse short on tech.

 The 1 min showed a negative divergence which seems to be playing out now.

 The 5 min shows a larger base and what appears to be a pullback .

 The 15 min is still leading positive and not really negative as the red arrow indicates, but in line.

And here's the 60 min which again seems to show a decent size base in a leading positive divergence, yet to break out.

Data Leak?

Did anyone else just see a trade go through on the SPY at $122.83?

Market Update


DIA
 DIA 1 min was negative right off the open, around 11 a.m a positive divergence and currently a negative divergence for intraday movements.


 DIA 5 min showed problems yesterday, the gap up today was also negative right at the open, again a positive divergence around 11 a.m. and currently negative-this effects the intraday trend, but a bit longer then the 1 min chart.


 DIA 10 min shows a negative opening gap and in line status.

 DIA 15 min reflects the negative opening gap, the same 11 am positive divergence and the same negative divergence now, this is a close up view.


 DIA 15 min The wider view shows a lot longer term trouble here.

 DIA 30 min has seen a lot of damage done in the last day and a half by way of a leading negative divergence.

 DIA 60 min the long term 60 min chart is leading negative and as price is near new highs for the last several months, 3C on this VERY important timeframe is near new lows, a VERY strong negative divergence effecting trends that can last weeks and even months.


QQQ
 QQQ 2 min shows the negative opening gap-a perfect fade and in line status now.

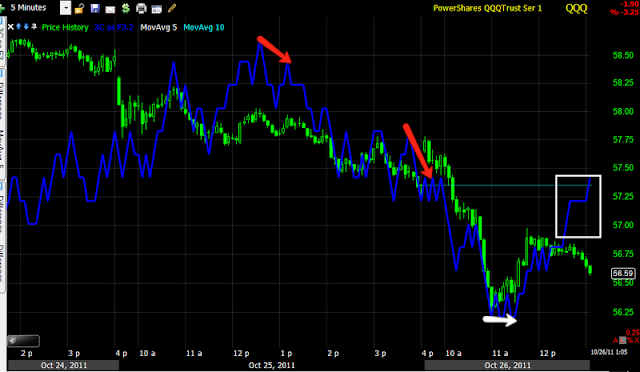
 QQQ 5 min chart shows the same on the open and a slight leading positive divergence intraday, the QQQ has taken the worst hit today so profit taking and consolidation aren't surprising.


 QQQ 10 min shows several days of problems and is in line now.

 QQQ 15 min chart has been in line on the way down, there was a slight positive divergence yesterday at the close, which played out in an opening gap up that was distributed almost immediately, currently in line.


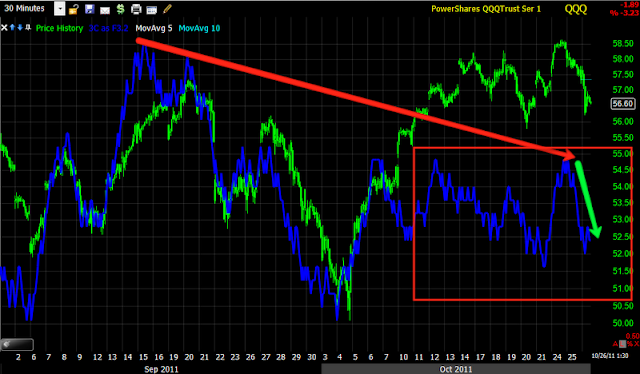
 QQQ 30 min chart shows long term trouble.

 QQQ 60 min also showing the major trend as being in long term trouble.


SPY
 SPY 1 min a negative opening gap this a.m. and a negative divergence on the intraday bounce.

 SPY 5 min-several days of trouble, another negative divergence on today's open and the same 11 a.m positive divergence.

 SPY 10 min also showing a few days of distribution as we made new highs, not surprising, this is how Wall Street operates, currently leading negative, short term in line.


 SPY 15 min This chart shows clearly distribution in to price highs, as I always tell you, Institutional money needs demand to sell short/distribute and new highs create that demand as Bulls chase break outs, Wall Street is able to go under the radar selling short simply by taking the other side of the Bulls' trade and no one notices anything. Again, currently leading negative.

 SPY 30 min this is another fantastic example of my comments above. This is a visual map of Institutional distribution and short selling. There's a lot more to price then just price if you know what to look for. A rally is not always as bullish as it first appears.


SPY 60 min And we have long term and short term leading negative divergences.

The Summit Has Started

It is nearly impossible to follow all the news and decide what is moving the Euro from here to there. The one thing that seems clear is that plans should have been in place long ago and it seems th Finance ministers are flying by the seat of their pants. Angela Merkel's most notorious statement to the German Lower House in getting them to vote to give her negotiating authority was, "We shouldn't take another 50 years of peace on the European continent for granted", that's pulling out the big guns of hyperbole, but may not be that far from the truth at some point as former Core countries like France have now become the target of bond vigilantes just like Greece, Ireland, Portugal, Spain and Italy.

If the S&P downgraded the US over its ability to work together regarding the debt ceiling, what would they do to European countries, it would be much easier to imagine if the EU was more akin to the United States rather then 17 or so sovereign nations using the same currency, but it doesn't look good for France.
As far as the banks seeming resistance to take hair cuts on EU member countries (mostly PIIGS) bonds, this creates two dilemmas. 1) Their is no credit event triggered in which the banks take write downs from anywhere between the originally agreed 21% to the now talked about 50-65%, this would blow out banks capital reserves and many weaker banks would fail.

#2) A Credit event is triggered and the banks get some form of insurance relief from Credit Default Swaps meant to protect their bond holdings, the problem is many of these banks have written the swaps and sold them, so they take an immediate hit. In either case, it seems almost inevitable that the EFSF has to bail out banks and the current $110 billion is a drop in the bucket compared to the over $1 trillion dollars in exposure, BUT NOBODY KNOWS FOR SURE because after 3 bank stress tests in the EU, the EU still doesn't know which banks have exposure and how much. How they can form a recapitalization plan which is riddled with mines is a pretty scary question when they don't even know what they are up against. Why don't they know this by now?

Furthermore, we are certainly going to hear how the member state are committed to raising the $440 billion dollar EFSF leverage, but I would bet a dime to a donut that there is NO specifics as to how, because they simply don't know. As one finance minister warned on Sunday, Greece alone could swallow the entire EFSF at this level. And don't think that Ireland, Portugal and eventually Spain and Italy will expect the same bondholder haircuts that Greece will likely receive.

While it seems that the PIIGS are the ones at the mercy of the ECB/EU/IMF/Troika, the core nations like Germany and France realize, it is in fact the PIIGS that hold all the cards.

What a mess.

That Didn't Take Long...

 The SPY at last update was green, not anymore.

 So was the IWM-"WAS"

 The Q' are leading the pack still

And the DIA isn't far behind.

And the Euro.... I think maybe the correlations aren't quite what they usually are.

In fact they are not
Looking at the red-EURO close yesterday, it has clearly set a new low, the DIA is pretty far from that.

In fact, judging be recent correlations of a 1 pip move in the Euro equaling 2 DOW-30 points, we should see the DOW-30 at $11538 as it stands now, it's $11737 a discrepancy of 199 points!