Wednesday, July 20, 2011

The Miners Trading System

Tonight's update is no new signals. However, system 1 made a move toward a long DUST signal today.

System 1 is in green, the signal line in red.

AH and Intel

Well INTC apparently CRUSHED earnings according to the Street.com however they are trading down in AH. We'll see when the market opens tomorrow what the real story is. Remember my earnings call on INTC wasn't about beat or miss, but reaction in price and thus far it's trading down.

In any case, I thought I'd pass this little AH game along. I was looking at the YahooFinance message boards to see when they'd release (believe me, I never go there otherwise) and everyone was up in arms about the number had been leaked because INTC was trading up in AH, the number wasn't leaked-at least not the way they thought, but what was happening was the experienced AH traders were making t seem that way so the retail guys would think there was gong to be a monster AH rally on great numbers, the guys on the board were buying, INTC released and now it's trading below the close. So that's one of the little AH games the locals play and a good reason not to trade AH unless you know who's who in the zoo.

QCOM Beats, Trades Lower

Here's the story, but it's all about what I mentioned earlier, expectations and in this case, QCOM came in light on guidance and the stock is trading down in AH. Whenever I think earnings, I think of that song, "What have you done for me lately". I actually had a girlfriend about 18 years ago who actually asked me that question.

SLV Update $38.94 the key to the trade?

 Here I've drawn a support/resistance trendline, based on the tweezer bottom support at the EOD of 7/18, this appears to be an important level.

 I backed the chart up a bit so you can see the volume surges, because we just had a volume surge that makes these look very small. You can see volume surging into resistance and on a break of resistance.

 Here I rolled the chart forward a couple of bars and you can see the most recent spike makes the former spikes look tiny in comparison. It is interesting that there's such a huge spike on a candle that really has gone nowhere except to hold support.

3C 5 min shows a negative divergence above resistance. If SLV falls back below this trendline, it's likely that the move in silver will have failed. I'd expect a little more upside if they are indeed setting a bulltrap as the break needs to be convincing, but perhaps that volume surge was the conviction they look for in a bull trap, or perhaps it is simply someone expending massive amounts of cash to support silver, either way, I think we are looking at the line in the sand.

MCD Short Trade Update

You may recall the bull flag in MCD and my expectation for a false breakout from previous updates...


 Today MCD has posted an all time new intraday high, perhaps it will post a new closing high before the day is over, in any case, there's the breakout from the bull flag, a perfect way to set up a bull trap.

 MCD 60 min 3C-no confirmation-negative divergence.

 MCD 30 min 3C-no confirmation-negative divergence.

 MCD 15 min 3C-no confirmation-negative divergence.

 MCD 10 min 3C-no confirmation-negative divergence.

 The 1 min chart turning down from an earlier negative divergence.

Price s always the final arbitrator, I like the trade here with a stop a bit above today's highs, the risk is pretty minimal. However, if you want a higher probability trade, then you can wait for price to break below the flag confirming the false breakout.

INTC Earnings Request

It's been awhile since we've had an earnings trade, please remember earnings are always a wild card and always speculative trades and your risk management should reflect that.

Now, INTC...
 INTC daily the recent run has been negative on 3C charts.

 30 min chart, another run up that is not confirmed, but negatively divergent

 15 min chart, speaks for itself
and the 10-mn chart, looks like distribution into the highs

The one thing to keep n mind as a caveat is the recent sector rotation out of tech. However, the INTC 15 min chart looks a lot worse then the SPY.
Also remember that 3C is not predicting a beat or a miss, but rather the most likely performance of INTC, thus they can beat and still react badly, be careful with knee jerk after hours reactions.

SPY Update

 SPY 15 min

 SPY 10 min

 SPY 5 min

SPY 1 min

We can still experience some upside volatility, but with all 4 timeframes aligning, I'm not getting too greedy.

FAS Update

 15 min

 10 min

 5 min
1 min

Remember, financials have been the backbone of the market.

My Actions

I personally am not convinced the bounce is over, usually we end these things with a bang, like a big head fake, but I am taking some profits off the table in Ultra and Ultrapro ETFs that I've had in place. I don't mind missing out on some extra profits, I had good profits and have decided to lock some in. I still have open positions, generally I've taken about 50% off the table.

Like they say, enter the trade cautiously and exit quickly. I don't entirely agree with that, but in this case, I simply am not seeing continued good underlying 3C support. Note that the market can and does continue to rally in to negative divergences, thus I'm taking "partial" profits.

GLD/SLV Update

I was curious this morning why we saw such a strong move up in GLD/SLV then a member emailed me this article.

John Taylor is well respected and I think his opinion published had a knee jerk effect on the PMs.

 Here's GLD on a 5 min 3C chart with a bullish ascending triangle, I'd watch for an upside breakout and then whether that breakout has 3C support, which I doubt at this time.

 Here's the daily move in GLD today.

 Here's the daily move in SLV today

 GLD hourly chart is quite negative, I don't know if a knee jerk reaction to an article is enough to overcome the distribution set in play.

 The same goes for SLV on an hourly chart.

 GLD's 15 mn 3C chart showed no accumulation for the move up, suggesting it was a knee jerk reaction to Taylor's piece. Taylor may in fact be correct, I respect the man, however, that does not preclude the possibility of a pullback that seems to already be in motion, nor the depth of that pullback. The red square shows some 15 min weakness.

 SLV 10 min 3C shows the initial reversal of two days ago and a slight negative divergence today.

The 1 min chart looks a bit worse, with the 1 min chart there are generally 3 possibilities, the negative divergence is the start of a larger divergence as they almost always start on the shortest chart and work their way through the longer harts. It can also be a sign of an intraday move, or lastly t can show weakness that will form a consolidation zone.

Because of the knee jerk reaction, the lack of accumulation and the seriousness of the hourly charts, I think the path of least resistance remans down for the time being.

Energy...

Remember in the early long post of the market sectors I sad energy is the best chance for the market to continue its rally?

Take a look at the recent XLE chart.
This is a positive leading divergence, granted it's only a 1 min chart, but t may be the start of something. I'll continue to watch it.

USO Update-No surprises here

In yesterday's USO update, I started the post with this paragraph,

"Remember the last USO update today, I said there's a possibility for a false breakdown before USO takes off, well that probability just increased."


and


"I can't say for sure if this would simply be a pullback from resistance to gather some more support like we saw in yesterday's decline or whether this is moving toward a downside shakeout, if the downside shakeout occurs, I'm almost certainly a buyer, of course I'd check 3C for a head fake, but the way the market has been manipulating technical traders, this would not at all be uncommon, in fact just the opposite."


So two possibilities, 1) a pullback, 2) a shakeout, either way USO didn't look ready to break out without some downside.


 This is an overall bullish pattern and why I'm bullish on USO in the intermediate term.

 Here's today's intraday decline that I warned of yesterday.

 We have 3 negative divergences in red, yellow and a slight false breakout in green just before the dip in prices.

 Here are the same 3 on a 5 min chart-confirmaton.

If this turns in to more then just a pullback to gather strength before challenging the breakout resistance, this would be the most likely scenario, a break of the flag to the downside, which is accumulated followed by a sharp move up to a breakout.


These two charts are the only thing that suggest the dip was a possible pullback to gan some strength-option 1


 A 5 mn and 15 mn positive divergence on the dip.


CSE Short Trade Idea update

Just two days ago I brought you SE as a short trade idea. CSE is a financial so it's no wonder in this post 
I was seeing some short term accumulation.

Here's what I had to say about it,

" Here the 1 min chart is showing a positive leading divergence, note the downside momentum earlier today and how it faded to a lateral trend once the positive 1 min divergence began. This fits well with my theory that the market will bounce a bit before the next leg lower, which also allows us to get better positioning with less risk on trades like this that may bounce. The overall character of 3C s negative/bearish, the 1 min chart is not significant regarding the primary trend, it's just showing us what a counter trend move might look like which again is an opportunity."


And true to form, with everything we've been seeing in financials the last few days, CSE has bounced today. I put an initial target for the bounce in the last update just below $6.50, we are at $6.05 with an intraday high of $6.10 right now.


 Daily chart of the top

Today's move.


Right now 3C s inline with price, so there's no signal to short t yet, but I would keep CSE on the radar and on the short list, when the reversal comes, it may come quickly.

XLF Update

 XLF's Bollinger Bands are narrowing, meaning a directional move is coming. There are a couple of options, 1 we see a move up n XLF and if there's no other support in the market, 'd be leaning toward distribution of that move, or we could see a pullback, or a legitimate move. Heres some more data.

 The XLF 15 min chart is largely positive, but there has been a flat area today that is bothering me. I would suspect, based on market behavior, if Financials are in rotation, it is to use that strength, just like the rest of the bounce, to short into. This would imply to me a breakout to the upside and likely distribution of such.

 Energy was a possiblle sector to look toward for strength, but since the last monster post,  see weakness developing. This is DJUSEN DJ Oil & Gas Index, the 15 min chart looks horrible. As a matter of fact, I may consider shorting the group using something like DUG, maybe SCO for a shorter term trade.

XLE-Energy on a 10-min chart, falling apart.

Market Snapshot

First let me apologize for the length of this post, but it's important.


 SPY 3C hourly-in line, but we only need a deep 15 min divergence to get a reversal.

 SPY 30 min in line as well.

 The 15 min chart is still positive, it's in leading position

 The 10-min chart is showing some weakness as it starts a slight leading negative, if this filters in to the 15 min chart, a reversal is nearby.

 The 5 min chart is negative today and as you'll see below, it's not surprising.

 Here's the relevant IWM chart, 1 min leading negative divergence. The selling started late yesterday afternoon.

 Here are the Q's on a 15 min chart, in a negative and leading negative divergence, this is why yesterday I said that if  was using leveraged ETFs, I'd sell TQQQ and put the money in to financials.

 QQQ 10 mn also in a slight leading negative divergence. To be clear, there are relative divergences that compare two similar points in price with two different readings of 3C, a leading divergence is more powerful and leads price.

 QQQ 5 min, started going negative yesterday as Tech went out of rotation as per my post of Tech vs Financials regarding sector rotation. Today, the pop at the open, due to AAPL, was promptly in distribution, this is also a leading negative divergence.

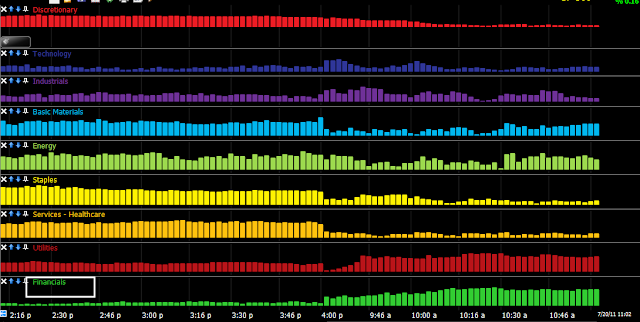
Here are the recent movements in sector rotation. As you can see, Financials today have taken over the role of leader, this was evident yesterday and why I made such a fuss over it and hanging short term ETF positioning to take advantage of financials coming in to rotation. Note most of the other sectors are going out of rotation. Basic Materials in light blue has a chance, consumer discretionary, which judging by simple common sense would be the first to go, looks the worst. Energy is a possible white knght for the bounce, but it's a bit ambiguous. Financials alone cannot support this bounce and that is why we are seeing such a lack of performance today.

Lets look at the sectors

 Materials, not performing, I don't see much hope there ether.

 XLE is close to unchanged and as I said a bit ambiguous, it could go ether way, but the energy omplex s large enough that combined with ongoing strength in financials, the bounce could be kept alive a bit longer. When financials fade, this bounce is almost certainly done.

 As I mentioned yesterday, Financials which were underperforming, came in to rotation and are the only thing holding the market up at this point.

 Here's the 15 min chart which suggests some more strength in financials.

 The 5 min chart is showing what looks to be a pullback coming (by the time I post this it will probably have happened.

 Industrials are flat

 However the 5 min 3C looks like they are going out of rotation, probably not much hope there.

 As I warned yesterday, "get out of tech and in to financials", tech is underperforming at resistance.

 Consumer Staples don't look like they'll come back from their decline out of rotation.

 The 10 min 3C chart is confirming this with a leading negative divergence.

 Utilities are showing some relative strength price wise, but...

 The 10-min hart is going negative on them as well.

 Healthcare s another possible white knight for the bounce, although underperforming now, there's been some improvement.

 Here Healthcare is about in line on the 15 min chart, the pullback looks a little worse then 3C.

 Consumer discretionary, as mentioned above has fallen apart, this is the first to go.

Here's the 1 min chart, absolutely falling apart today.

So, unless Energy steps up and financials maintain, I think we are getting close to the end of our bounce. Last week when 3C predicted the bounce, there was no way of telling ho long t might last, we'll have to monitor the situation, but I would be taking some profits and certainly looking at entering some shorts, even f you are just dipping your toes in the water. Make sure the particular short you choose makes sense and isn't just any idea out there. You can always email me for a second opinion.

Sorry for any spelling errors, both of my fingers are pretty sore from typing (note I said both-that's what happens when you goof off in typing class and end up being a two finger hunt and peck typist).