Tuesday, November 25, 2014

Daily Wrap

Today's price action, full of closing candlestick Stars and Dojis (indecision/reversal candles), looked a lot more like the Dominant Price/Volume Relationship from yesterday which was Price Up/Volume down, the most bearish of the 4 possible outcomes and with a strong Morningstar performance, a97 of 238 closing green which may seem bullish, bit most often it leads to an overbought condition and next day correction.

Considering the SPX (-.12), the Dow (-0.2%) and the Russell 2000 (-0.05%) all closed red with only the NASDAQ 1000 +0.09% closing green, but for all intents and purposes we might as well call it a totally flat day, this is certainly a change in character.

Transports actually had the best day, at least until you look at it a bit closer (+40%). Transports short have been an open position and a favorite longer term core short position.

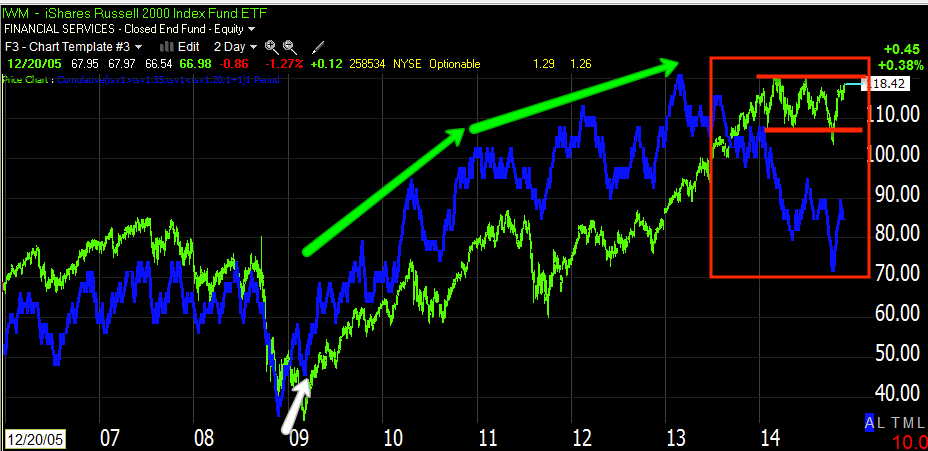
Here's what the averages in general looked like on the day...
Everything but the NASDAQ by a hair and Transports closed red, but nearly everything was almost unchanged, not the bullish story you want coming in to Black Friday on major media outlets.

For a closer look at transports...
 2 hour macro view was in line coming in to 2014 and then went negative in to 2014. We've looked at all of the charts and Transports looks like a good core short position in my view.
As for timing signals, the 5 min chart went sharply negative today and I don't think that was on  falling oil prices.

In fact, intraday look at the 1 min chart, insane.

The averages didn't fare much better. We've seen the longer term charts and trends, it's the short term timing chart especially since I think the head fake move already occurred, but is obscured by the "SURPRISE" PBoC rate Cut from Friday.
 IWM's 60 min macro trend showing accumulation through the first 2 weeks of October, although some didn't believe it, after this move I think nearly 2 weeks of accumulation is QUITE BELIEVABLE.

The distribution period has been larger, longer and more intense, but some of the other averages are even worse than this.

As far as the short term timing indication charts...
This is the IWM 1 min , remember what I said about those thin, quiet trading ranges, 3C is in decline all day through the IWM's flat range.

 The SPY with a sharp negative divegrence since the suspected head fake move (yellow arrow) and after the PBoC gap up, with a much stronger , faster divegrence to the downside, similar to the speed and timing of 30 year yields, or the Flight to Safety trade.


 And the SPY intraday, clearly negative right in to the suspected head fake move (yellow arrow) with a deeply leading negative divegrence since the gap up on the PBoC non-liquidity event, which the bank itself is warning that this is not the start of a loosening cycle.

And the Q's
Again, beware and don't fall asleep at the switch during flat, dull markets. The Q's intraday leading negative through today's range should be proof enough, but I suspect before long as this is a timing timeframe, we'll have more solid reasons to be diligent during boring, flat markets.

Cruse, which I posted on last week as a possible trend change here, Oil Trend Changing... will have to be watched closely oif we want to place a trade tomorrow before OPEC's Thursday meeting as the US markets are closed.

It seemed at first from the post above that USO will see a move higher on an OPEC production cut and I'm still watching for convincing evidence, but today intraday, oil was all over the place on OPEC rumors.
 Looking at Brent Crude futures intraday it seems as if someone knew what the first rumor/leak would be as they sold in to oil before the leak at #1 which was "No Cut", then at #2 the next rumor was an OPEC cut sending oil higher in to #3 rumor/leak which was "No cut, stricter compliance" obviously referring to Saudi Arabia adjusting production as they see fit or as the US sees fit in an effort to punish Putin.

However, overall the ending price action was similar to a rounding bottom and on a positive divegrence, perhaps all of that just to pick up crude shares/contracts at lower prices since everything today in oil was rumor/leak? This is one I'll be watching like a hawk tomorrow for a true potential leak.


USO's intraday chart today looks VERY similar to Crude Futures (Brent) above...

So were trannies following oil as they sold off in to the close while oil also moved lower? It seems illogical at best.

The $USD saw its second day of consecutive weakness on a stronger EUR (both macro trends), this "should" have sent Gold, Silver, copper and oil all higher, as well as stocks but...
Silver (white) moved higher, gold (green) slightly higher), copper (yellow) was slammed again and oil (blue) was slammed. We might give oil a pass on all of the OPEC rumors.


Dr. Copper is seeing an increasingly negative trend, however with a lot of the macro global growth data and opinions, it's not surprising, however for old-timers who have always believe copper leads the economy and the market, this is an ugly omen.

Speaking of Omens, not that I personally subscribe to them, but there was a near spot on a Hindenburg Omen today. Again, while I don't think they are a prerequisite, they do often accompany bearish turns down, however they are not a necessity for bearish turns down. The last H.O. was around the September high leading to the October lows.

As for leading Indicators, as I posted and predicted here, VERY BAD Market NEWS...Richmond F_E_D, CONTEXT, SPY Arbitrage and TLT-30 year Treasuries... the SPY arbitrage was likely to be levered up in to the close.  VIX as expected, was slammed a bit in to the close and HYG pushed higher as posted, but it had no effect other than to perhaps keep the one average in the green and the rest from slipping, as I showed earlier today, they were approaching a "Slippery Slope".

 VIX slam in to the close sends SPX lower or about in place.

HYG was ramped in to the close to no effect, however...

HYG distribution in to that ramp was carried out.

The failure of the SPY arbitrage was in the fact they couldn't push TLT lower, in fact it looks like there was a large block trade buying or covering TLT and selling TBT (at the exact same time), our trade, Short TBT giving us a TLT 2x long position.


 Note the volume in TLT this afternoon and the jump higher which is why I suspect a block trade and at the exact same time in the inverse TBT...
TBT was sold in a large block trade causing it to fall. You don't see these often, but when you do, apparently someone is in a hurry to get out of the position to take that kind of fill.

Both trades would be exactly in line with what we've seen during the TLt pullback/accumulation which is why we entered the trade.

On a 60 min chart TLT has a large positive divegrence and is already moving up sending yields down, which has already pressured the market as posted in last night's Daily Wrap.

The 30 min chart shows a sharp move higher, apparently the result of recent strong accumulation and likely the catalyst behind the block trade.


As for yields which are a leading indicator and act as a magnet pulling equity prices toward them...


 The higher TLT and 30 year bonds go, the lower 30 year yields go. Toy can see for yourself the last time there was a divergence between 30 year yields (blue) vs the SPX and you can see how big this divergence is now.


 I mentioned the ROC in yields to the downside last night, but this is even sharper.

Even our 5 year yields made a sharp move lower and these have been one of our favorite Leading Indicators for some time.

Today also had an immensely strong 5 year treasury auction on top of yesterday's very strong 2 year auction.

There seems to be a clear Flight to Safety  trade in the works.

Pro sentiment stayed almost exactly in line with the SPX, however on a trend basis like the 30 year yield chart 3 charts up, both look almost identical trend-wise, in other words, not good.

HY Credit sold off in to the close for a second day in a row.

As for AAPL, it looked like it was heading toward a trade at the last update (not quite there)...SPY Underperformance/ NASDAQ Divergences & AAPL.

Today AAPL's timing timeframes moved a lot closer and this too will be high ion the watchlist.

 AAPL positive 5 min divergence to a leading negative.

And the intraday chart looks horrible.

This is interesting both as a trade and as the heaviest weighted stock in the NASDAQ 100, you can find out the exact weight for a $10,000 a year NASDAQ subscription, but in the past it has carried about 20% of the weight of the index, that's about the same as the bottom 50 weighted NASDAQ 100 stocks combined!

Also interesting as we saw the break up start last week, the ES vs.USD/JPY correlation failed even worse after the EU close, it had been in line until then intraday. When even the ramping levers break!

As for internals today...There was absolutely no Dominant Price/Volume Theme among the component stocks of the major averages.

Everything else was luke-warm. Five of 9 S&P groups closed green, but the leader, Consumer Discretionary (again) was a mere +0.31%, Energy was the laggard at -1.63.


Of the 238 Morningstar groups, a very luke-warm 130 of 238 closed green, it was as if  the whole market were one big Doji indecision candle today.


Breadth was along the same lines, luke-warm with the % of NYSE stocks > 200-day moving average stuck right at the 50% area now for the 18th day in a row, but just thumbing through them quickly, whether breadth indications or breadth indicators, nearly all have a look as if they are about to roll over. We'll see, but I'm use to seeing Rates of change, just like I saw a week or so before SKEW shot up and this has the same look.

I'll take a look at futures and post anything interesting before I hit the sack.

Gold has had some interesting volatility tonight, but it is volatility, not trend so we'll see how that pans out (no pun intended).

I'll catch up with you in a bit if there's anything else to report.


FXI/ FXP Trade Update

Yesterday FXP was entered as a long (2x short FTSE/ Xinhua China  25) Trade Idea (Swing to Position) FXI short / FXP Long with the intention of being at least a swing trade, but if things on a macro basis in Asia and by extension the US markets go according to expectations, than FXP may turn in to a longer held position trade. I liked the trade idea (and still do) a lot, thus no phased in entry, no speculative trading position, but rather a full size position.

The post above was the trade idea which I needed to get out quickly, so I followed that post up with the charts right after in this post, FXI / FXP / NKD-Asia Charts

Today FXI is down -0.80% and our FXP 2x short FXI is up +1.74%.

I PREFER USING FXI FOR ANALYSIS AS IT HAS SIGNIFICANTLY MORE VOLUME THAN FXP, HOWEVER ONCE A NEGATIVE DIVEGRENCE AND SHORT FXI TRADE LOOKS ENTICING, I PREFER USING THE 2X LEVERAGE OF FXP (ESSENTIALLY SHORT 2X FXI).

Here are the charts... I intend to stick with the position through any volatility unless something material changes on the charts, but since this and the Nikkei 225 Futures are two assets I've been looking for to make a move lower based on the charts, I doubt too much will change that will have a material effect on the position, today just served as initial confirmation of the trade idea.

 These two significant gaps up (the second being on the PBoC rate cut Friday, which seems to be poorly understood by many traders as does the difference between the long term policy horizon of the PBoC vs the F_E_D or even worse, the ECB-when they actually take action) both were on heavy volume, both lacked any kind of follow through and therefore both appear as churning or distribution days, especially Friday's gap up which closed well off the intraday highs and below the open on significant volume (which is not always a bullish sign, especially when considering market "Churning".

Remember, our position is FXP, 2x short FXI, so any moves lower in FXI like today's, benefits our FXP long entered yesterday.

The 60 min 3C chart of FXI easily confirms suspicions as we have a stage 1 base to the far left with two accumulation areas (white boxes) , however, the two suspected churning/distribution events both show a clear 3C divergence with price. While I would not expect a long term 60 min chart to confirm price action of a single gap up (it takes a bit longer for a 60 min chart to move that fast), I confirmed in other timeframes the failure of confirmation.

This 30 min chart, also a longer term, heavy underlying flow timeframe shows FXI in line/price/3C trend confirmation at the green arrow, however the first gap up already has a distribution signal in effect and the second has a strong leading negative divegrence which is a lot of downside 3C movement for such a long timeframe in such a short period suggesting intense distribution on price strength.

 The 10 min chart which is still a fairly long timeframe for this kind of movement confirms the 30 min chart's negative bias with a very deep and fast moving leading negative divegrence at both the first major gap up and even stronger at the PBoC rate cut gap from last Friday, in fact 3C is making a new leading negative low while price remains extremely elevated in contrast to where 3C is in the recent past vs. price.

 The 2 min chart is fast enough that it can easily make a higher high with price in a single day, in fact in a m,matter of hours or at minimum show the intention by moving in that direction, but here we see none of that.

 And the near term 2 min chart's action is leading negative at a very tight, very flat price range. These are the ranges I warn about as they tend to have very active underlying trade. While most think that big market moves are evidence of smart money buying or selling, our experience over nearly a decade of using 3C is that it is these tight ranges in which institutional activity is heaviest which makes perfect sense as institutions use VWAP to grade a market maker or a specialists fill of an order they place with them, that typically means keeping price in a range (VWAP) for the fill at a pre-determined average price. By the time price makes large moves, smart money has long been in place.

Just for confirmation, this is FXP, the inverse of FXI above. Note the 2 min chart is leading positive whereas FXI's is leading negative and also in a tight range.

We not only have multiple timeframe confirmation with the long strategic probabilities in place and the shorter timing charts in place, but we have multiple asset confirmation as well.


UNG/UGAZ Heads Up

Our UGAZ long added +9.25% today, this is another that I wouldn't chase. Yesterday's update can be found here, UNG / UGAZ Update.

I see a lot of good stuff in UNG and UGAZ, they have done many of the things expected to complete the pullback, however they are still very low in the base when considering the big picture so I would not chase them. There is a possibility of a near term pullback, although I will deal with specifics below with the chart.

From yesterday's post linked above, this is an excerpt from it with a chart and commentary from the  UNG Follow Up posted Thursday...

Remember these are Thursday's charts and comments in "Italics"

"Expected minimum pullback at the top of the orange range and a full gap fill at the bottom."

As of yesterday, we met  the minimum target and halfway through the lower, secondary target...

 UNG as of yesterday's close, hit the minimum target and half way through the secondary, lower target. This is why I have maintained the UGAZ long position rather than try to trade around some tight corners as I trust its long term probabilities and that's what this position is about, long term probabilities, not a trade.


 As of today, with a UNG  +3.25% gain and a UGAZ +9.25% gain (putting our UGAZ long at a gain of +15.70%.

The volume recently since the head fake-like failed breakout (yellow arrow), which we posted that day, "If it didn't make a clean breakout on increasing volume, then it would quickly move below the range, accumulate shares and make a full hearted attempt to complete the breakout which it did November 6th, with clear signs of a pullback coming, I gave you some tools to not only spot the pullback, but to know where to enter as the pullback just about touched range support on 11/13 and 11/14.

Yesterday's update also included this chart (from yesterday's analysis), *"excerpts in Italics"*

"The daily X-Over screen that recently gave a new buy signal was one of the potential pullback areas at the blue 22-bar moving average which isn't far from a gap fill as well."

As our "X-Over" screen to follow trends, while avoiding false moving average cross-overs or whiplashes, gave us a long signal at the white arrows, one of the higher probability pullbacks using this screen, would be to the blue 22-bar moving average as posted yesterday (above).

And as of today...

 We clearly touched the 22-bar/day moving average (blue) and maintained all 3 signals/the long signal.

For those of you who may have been following along on a simple ROC signal/tool that I gave you for pullbacks/entries specifically in UNG, you may have seen a long signal yesterday in UNG...
From the intraday (from 5 min to 60 minutes this works, in fact even better on the longer 15, 30 and 60 min charts), you watch for the divergences between price and price's ROC which occurred while clearly at yesterday's move off intraday pivot lows on increasing volume.

An example using a 30 min chart instead...
Not only does this simple and severely overlooked indicator call both pullback highs in the chart, but gives a clear positive divergence/buy signal yesterday.

Although I have posted many times about using ROC on different indicators as well as on price, here's the specific posts regarding its use with UNG... UNG Update

As for the current charts and the possibility of the remaining gap being filled, I'd say it's not a high probability. Again, considering our long term secular outlook on UNG, this was not a position I was interested in trading around at all and a such, left the UGAZ long in place this entire time since the failed breakout attempt back in September, it's just not worth looking back a year from now and knowing I missed the trade over a percent or less (the AAPL lesson).

 In several updates I have said that the negative divegrence which pointed to a pullback on charts like this 5 min, would be repaired by the time UNG was a long candidate, it took less than a day to repair this chart as 3C not only repaired, but gave a leading positive divegrence yesterday in the flat range.

As always, stay alert in dull market ranges as this is where the most underlying action tends to occur, giving rise to my motto re: dull or flat markets, " They are dangerous...They are like the kids in the next room being a little too quiet, you know they are up to something"
 I said the 15 min chart would be repaired by the time UNG was a long, look at this amazing leading positive divegrence as well as the positive divegrence in yesterday's range on a 15 min chart! That's a lot of movement for a single day and  this is one of the reasons I doubt UNG comes back to fill what's left of that small gap. However, I would not chase UNG/UGAZ long, they will pullback and offer a low risk entry.

This intraday 1 min chart confirms UNG's price move to the upside today, but as you see it also shows a negative divegrence in to the close. Right now, this negative at the close is only on the 1 min chart, ALL OTHERS ARE POSITIVE ANDSD EITHER LEADING OR IN LINE.

My guess is that this is some late day profit taking on a strong 2-day move for UNG, certainly for UGAZ which has the exact same signals.

If you are interested in a potential UNG pullback, I can say with a lot of confidence that if you see it finish filling the gap on a pullback, which would be an ugly 1-day move, I'd feel very confident that it would still be a buy without even needing to consult the 3C chart as all of the other charts are so amazingly strong.

However, if there's some slow-down/consolidation and you are interested in an update as to the possibilities of the remainder of the gap being filled or another pullback entry/add-to long, feel free to email me.

I will continue updating UNG/UGAZ as we are VERY low in the overall picture, I suspect a year from now we'll look back and even an entry at $28 will look like a bargain.


FXP Heads Up

Yesterday's trade idea, Trade Idea (Swing to Position) FXI short / FXP Long is already in the green. I believe there's a lot more to come, but I WOULD NOT chase this trade, There's a decent chance of a pullback, but this is part of the Asian meltdown I expect.

I'll have more shortly

Russell 2000 Map- IMPORTANT POST

We rarely spend enough time on the broad market overview, which is the most important. Any time I look at a new asset I start with weekly charts and work down to intraday charts. Market cycles are reliably repetitive and the head fake concept is very reliable, thus every once in a while it makes sense to revisit the macro view to know where we are on the map and where we are going.

I'm specifically using the Russell 2000 for 2 reasons, (1) there are so many charts dealing with one index, I don't think you'd get through this post nor I get it out today if I covered more than 1 index, (2) the R2K is the average that "should" lead all risk on moves, it's a broad index encompassing many areas of the economy and the heart of the economy which is small to mid cap business. If you ever watched Bernanke at his bi-annual Humphrey-Hawkins Congressional testimony, interestingly when he talked about the market he chose to talk in terms of the Russell 2000 which is a bit surprising being the Dow Industrials or the S&P-500 are by far much more common / familiar household names, but Bernanke recognized the Russell's impact as a market lead ing Index and chose to use it as his market benchmark at least in Congressional testimony.

Lets start at the beginning with some long term 3C charts, remember the longer the chart, the heavier the underlying money flow trend or the stronger the implications of divergences. Often many long term day or multi-day charts won't have the detail that intraday charts will have simply because divergences from price or the underlying flow of funds which may be more than enough to move the market, are not that big that they'll move the market in any significant way on the longer daily/multi-day charts, unfortunately watching the market all day every day we tend to watch shorter term action as you can only make the same observation about longer charts so many times while the shorter term charts are more fluid, dynamic and call out shorter term trends, which can be substantial such as the early October accumulation we saw in to the mid-October lows which led to our forecast that we'd see a monster, face ripping upside rally that would change sentiment from full on bear as it was at that point to full on bullish, I'll admit though that while I suspected new highs were possible if not probable as we do have a Broadening top in place with 5 points of contact, the intensity and more so, the length of the move even surprised me, the market is always extreme in sentiment changing moves and this move was meant to be a sentiment changer,, but as I have maintained since BEFORE the move started, it's a means, not an end as too many people were calling a bear market at the October lows, which I had said at the time made me very uncomfortable as bear markets appear when they are least expected and economic information is generally on the upswing; just look at the major bear markets, 1929, 2000, 2007, all new time highs as they topped and turned.

From a conceptual point of view, think about our Head and Shoulders Concept, the 3 areas I'll short a H&S top and the one I won't. Or the recent BABA Channel Buster concept in which we predicted where BABA would pullback to at least 2 weeks in advance and before the first day of pullback, in fact BABA was up +4.59% on the day we posted the pullback was coming, Alibaba (BABA) with the pullback starting the next day.

 These micro versions of head fake concepts are really no different than the macro version. This is why all of our concepts are able to be used in ANY asset class and in ANY timeframe you wish to trade.

Take HLF for a quick example.
 Our H&S concept in HLF, which has given us a short with a -40% gain and we entered on the strongest 1-day move up in HLF's history, over +25% not because of overbought, but because the macro signals were telling us distribution and the intraday signals on that huge move were telling us distribution. A difficult trade to short emotionally, but it was the best entry and lowest risk with objective data supporting the trade, now at a +40% gain.


For all H&S tops, I'll short the head #1, the right shoulder #2, I WILL NOT short the initial break of the neckline as this is where most traders go short on confirmation of the H&S, this is also where most shorts are shaken out. I'll only trade this area with good signals, but the concept is to wait for new shorts who have placed their stops above the neckline that is now resistance, to be shaken out with a volatility shakeout ABOVE the neckline. THIS IS THE 3RD AND FINAL PLACE I'LL SHORT A H&S TOP.

The point in this concept is not a H&S top, it is common price patterns that all technical traders know being used against them and using that to our advantage.

Just like the BABA pullback (linked above), I posted the idea on 11/10 when BABA was up over 4.5%, it was a "seemingly" bullish move above the channel, a "Channel Buster", but these are almost always red flags of a quick trend change and in this case, it almost always leads to a fast move BELOW the channel which was our prediction on 11/10 and EXACTLY what happened. It's using momentum against traders, this is the same thing we see in the market on a macro scale.


 There's a clear change in the SPX's character from a clear up trend to a choppy, volatile lateral trend or top. Most traders will recognize this as a Broadening Top. All H*S tops first start as Broadening Tops or Mega-Phone tops.

The break below at the October lows is when everyone started calling for a bear market, the moment in which I said there are too many people on the same side of the trade in a zero sum game, "I suspect a big move to the upside is coming which will then lead to a bigger move to the downside" and this was before we had any evidence of either, just Mass Psychology.

The move had to be strong enough to overcome the overwhelming bearish sentiment at the time which you may have forgotten, but I even posted that we'd see a face ripping rally, when no one believed we'd even see an upside correction and that the job of the rally is to get retail to believe in the market, again something that seemed impossible at the time with EVERYONE calling for a bear market and as the Fear and Greed Index was hitting ZERO for multiple days, the strongest bearish sentiment on record. I even challenged you to bookmark the post, that the move would be so strong that even with advance notice and bookmarking that post, you'd be scared to short the market as emotionally it would look that strong and seem that crazy" and here we are.

Now a closer look...

There are usually FIVE points of contact before a Broadening top fails. The move below the trendline at the October lows dragged everyone to the short side, so no different than HLF's initial break below it's neckline of BABA's initial break above its channel, this head fake was no different and was the first reason I suspected such a strong rally BEFORE we had evidence of accumulation for the move.

In much the same way as the downside move created momentum via a series of short squeezes at various stop levels and a long amount of time before traders trustted the move enough to go long, we are at a similar momentum building area ABOVE the Broadening top which causes traders to think that just like the failed break below the top, the breakout above makes this an invalid chart pattern, it is not.

The last move below taught traders no matter how strong the move down is, BUY THE DIP, so expect the next move down even stronger not to be met with full bearishness like the October lows, but a renewed sense of the deeper the correction, the better as retail will BUY THE DIP, this time the market simply won't come back

THIS IS THE SAME HEAD FAKE, MOMENTUM, MASS PSYCHOLOGY CONCEPT AS HLF AND BAVBA.


 As for the IWM, this is a strong 2-day chart showing strong accumulation at the 2009 lows, I point this out with a rolled back chart because the size of our divegrence now will make this almost invisible.

The green arrows are 3C confirming price and the red box is a large leading negative divegrence on a head fake move that came just before the downside move that erased a 5-year bull market + another 15% and most of that in 8 months!

 This is the full 2-day IWM 3C chart. Note how small the 2009 positive divegrence looks now!

The green arrows shows near perfect confirmation of price. There were large divergences all along the way, just not large enough to reach a 2-day chart, thus any divergence on a chart this long, shows HUGR underlying flow of funds.

At 2013-2014 the negative divegrence is clear and the IWM has been essentially flat all year. I can't count how many times the Russell 2000 has closed red for the year over the past 7 months or so, it's a large, flat range/top while the SPX is a broadening top.


 This is the weekly Russell 2000 futures, notice they also go leading negative at 2013 end of the year in to 2014... and price moves laterally in a huge range.

 The 4 hour chart shows 3C negative divergences (like the elevated SKEW at each of these tops posted last night like now). There's only 1 positive on this chart, the October lows as it needed to be the strongest, most convincing rally and a last chance to make a big trade.

Note 3C is at a near leading new low as price approaches new highs, the worst divergence of the year.

 The 60 min chart shows a negative at 1 and in to #2, the decline in price since the divegrence at #3 and you can't see it, but a positive at the lows last week as the IWM threatened to move lower in to the most important week for retail stores.

 A closer look at the same chart above shows last week on Thursday a positive divegrence, not a huge one, but enough to move the IWM as much as it has. Looking back I suspect this is ALL about this week and Black Friday and Consumer Sentiment in the shopping season, hearing the market was down 300 pints will not inspire confidence in the economy.

Since, this one has gone negative too in to this week.


The 60 min IWM chart with a positive divegrence at the October lows. As I said back then, the divegrence started early October and as always, no matter where the divegrence starts, if you enter the trade right there, price will surpass the area of the first sign of the divegrence which was early October, we have well passed the area and you'd be at a large gain if you bought even at the start of October.

The current signal like all others is leading negative.

This market has done everything from the shakeout to the upside, the head fake above the Broadening Top, all of the negative divergences, SKEW rising, breadth falling apart, and VIX accumulated.

We are beyond the point of a break because historically we've never seen such bad divergences and dislocations which fits with what I said BEFORE the October rally even started. "That we'd have an incredibly strong rally meant to change sentiment followed by an even stronger decline to a new low below the October low", so far everything has happened and the signals are off the chart so to speak.