Friday, August 9, 2013

Final Update

Much like we saw earlier in the week that set up the first round of calls that did pretty well, there's what looks like either closing or early Monday intraday weakness like there has been every afternoon the last 3 or 4 days now, behind that there appears to be the signals for a bounce like we saw earlier in the week.

It may be that an op-ex pin today kept a lot of stocks from moving low enough in to the accumulation zone and thus it continues Monday, I suspect that because there were so few decent looking candidates except ones that were already knocked on their butt like FSLR.

Then there's the "Playing with fire" warning chart I'll include and it's not just on this one chart, but I figure one should do it. It's fine to take what the market offers, but we can't forget why we are here, what the risk is and I don't want to get crushed chasing pennines in front of a steam roller.

 Typical afternoon weakness on the 1 min SPY, not as bad as yesterday though.

We see it on the 3 min intraday chart too so I expect some weakness in to the close, but probably early Monday too.

The 5 min chart with its positive and this is how the last move was set up.

And a 15 min chart showing a positive, but it's not all that strong so again, be careful

HYG intraday also looks like early Monday downside

At 5 mins though it looks like there will be a bounce and it will support it.

Even here on the 10 min.

This is the IWM chart, there are some even in the 5 to 10 min range that scare me, which I welcome.
This is really the big picture, try to imagine what a bounce might look like and how aggressive you want to get chasing it with this chart in place.

Silver $20 Put Follow Up

I said last night I think both SLV and GLD can rally again, but first they need a pullback and that Silver will probably get hit harder and GLD probably rally harder the next time.

Here are the SLV charts, remember I'm not treating this as a swing trade or anything else, it's a quick move to the downside I'm looking for.

 SLV 5 min chart

SLV 3 min from the accumulation for the move to distribution in to the move.

Futures
 The 15 min SI futures- negative

And the 1 min intraday the same, I'd take the SLV put right now if I hadn't already

PCLN Follow Up

Earlier I started a partial short position in PCLN, the reason for the partial is $1,000 is nearby and that's a psychological magnet, it's also about 2% risk and in a partial position represents about 1.25% portfolio risk.

There's one thing that's a little counterintuitive about an earnings beat, especially a big one. Wall Street is not about fundamentals and if it was, we'd never have the talent and equipment to compete, it's slightly different than the more emotional side we see or feel, I'd say it's about "Perception".

There's no loyalty there either, do you know how many private equity managers and GS board members likely took Steve Jobs and Cook on extravagant outings to the craziest events we can't even imagine? However when they feel the dance is up, they have no problem cutting these CEO's net worth in half.

The difficult thing about high price and really high multiples is the street doesn't care what you did, in fact the most important part of earnings is the forward looking guidance (that's why a company can beat and still get sold off if guidance was weak), the street only cares about Perception toward what you will do.

When Wall St. felt AAPL reached the top of their game and the IP5 came out lagging the Galaxy S4, you see how quickly AAPL went from "Darling" to red headed step child with a 45% cut to their price?

I think the current market and economic environments are also going to make perception a bigger part of the game as funds really look at the growth potential before they deploy their capital, PCLN had great growth, the question is, Can PCLN keep that growth in share price going? My gut feeling is no and there are things on the chart that tells me others have felt that way for some time.

 Starting from the middle, I  can mark all the small divergences at the twists and turns, but what I want to show is the relative stability of 3C and the price trend and then the sudden change. I know this is a longer 15 min chart, but it could have confirmed by now, it could have made an effort and reached up toward price, this tells me the after hours ramp was useful in letting go of positions / distribution.

The 5 min chart has even more detail and there's  pretty close 3C/price trend confirmation and the obvious positive divergence to the left is so easy to see I had to mark it and it's about the right size for the move up to the July highs, coming down off that move there's the first deep dip in 3C and on the earnings gap up, you can see why the 15 min chart didn't even try to confirm, this chart is not showing apathy, it is showing action in to earnings.

 Intraday PCLN seems to be just sitting there, then there's this dip.

If I take the same chart as above and zoom in close enough to remove the dip that changes scaling, you can see most of the time PCLN is just sitting there, when I see a stock sitting above a gap like that and not doing much, I'm thinking "Churning".

The 3 min chart is interesting because I didn't catch this before, there was a very intentional accumulation zone here and I suspect it was to run PCLN up in to earnings, maybe  hope the AH action takes it to $1000, but when we get to earnings, there's a totally different tone.

I doubt any smart money, even if they love the stock and think it's a bargain, is going to buy it up here and let retail sell them shares at an elevated price. So I'll watch for a gap fill and if I see accumulation in to it, I'll cover the short for now as that would tell me there seems to be some interest in PCLN post earnings.

If I see it above $1000 which I think is inevitable unless things go really wrong in the market and like an Ebb tide, takes all boats lower, then I'll be looking for even deeper distribution signals and that's where I'd add the final half of PCLN.


The daily chart too shows good conformation considering a 13 year trend. It shows PCLN on a discount at the 2008 dip and how smart money stepped up and bought a lot of shares, but that too has changed. No time over the last 13 years has there been a negative divergence like there is now.

If you are familiar with the "Channel Buster" Concept and even basic volume analysis, these Channel Busters always "look" very positive, they tend to end very badly as they often break the top channel and quickly drop to fall through the lower channel.

As far as I'm concerned, the charts are there, the risk : reward ratio is certainly there, it just takes the belief and emotional fortitude to pull the trigger.

Not As Many Candidates Thus Far Today

I'm surprised, I believe it was Wednesday there were so many candidates for a bounce that it was a matter of picking through and trying to find the best looking ones. As far as open positions, I still like URRE, obviously FSLR, HYG I still like (these are all still open or just opened), but AAPL I don't like.

The averages right now I'm not excited about (those were closed), AAPL is still open.

I find I had an expectation that today would be similar to Wednesday, but I find it's not and the point is to take what the market gives, if I don't see anything I trust (in fact I see a lot more that are looking like great shorts and just need a little push higher), there's no point in putting dry powder at risk.

Let me show you AAPL.
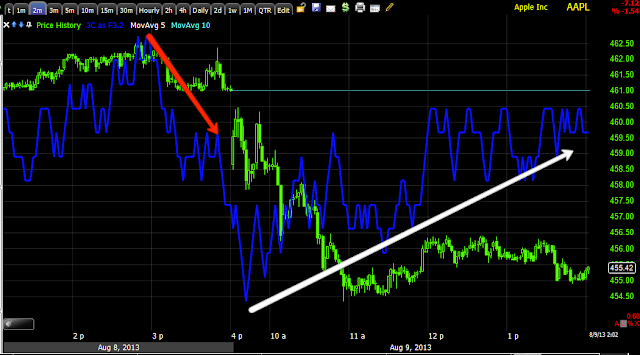
 The 1 min chart looks good and it looks like AAPL will bounce, but I wouldn't enter on 1 chart alone unless it was a day trade.

The 2 min chart doesn't have what I'd expect to see.

The 3 min chart has something like the 2 min, but I'm not inspired at all.

The 5 min chart which is probably the minimum standard looks more like a short on a bounce than risking a long bounce trade.

The same for the 10 min.

There are "some" charts i the averages I like, but there are none that I like enough to take a position, maybe that changes before the close or Monday, maybe it's a sign of more weakness developing here.

I'm just not going to take an OK position to have something to keep my hands busy.

That said, I'll try to show you some of the earlier ones like SLV and PCLN.

GOOG Trade Idea

This is a bounce only, I'm looking for a bounce to set up a larger short in GOOG. I'd personally use options/calls and September just because the Aug monthly is next week, maybe the August weekly for the last week of August would be fine

I will not be entering this one, but here's the chart...
GOOG 3 min

URRE Follow Up / Trade Idea

I'm still holding an open position in URRE equity (stock) long, I do think this is a bounce and not a new leg higher, but still worthwhile.

I only need 1 chart.

Added to FSLR Aug $40 Calls

Here are the charts, not all, but I wouldn't fudge any on you, they look good for a good dead cat bounce, I'd trade this equity only or options, either way I think it's worth it, but it's a bounce position only.

I would have preferred a September expiration, but I think the Aug. will be fine.

 Accumulation zones, note the nice flat range that is proportional with the decline.

1 min leading positive as if the market makers/specialists are stocking up.

5 min showing the trend and that the divergence has hit 5 min, I doubt this is retail.

No, even for an equity long I don't think the small gain today is chasing, not compared to what this can and should do.


FSLR Looking VERY ATTRACTIVE LONG

I have calls open there, I may even add to them, it looks so good right now that I had to get this note out and not waste time gathering charts, but I will follow up next with charts.

Opening SLV Sept (monthly) $20 PUT

You can go short SLV as well, I think there are some leveraged ETFS, but I doubt they have any volume.

Market Update: Setting Up right in time for the post 2 p.m. move

We see it every Friday, the market is pinned until most option contracts are settled, I don't know about you, but my broker would be calling at 12 and 1 p.m. asking what I wanted to do with expiring contracts, by 2-2:30 most are settled, Wall St. has peeled the premium out of about 90% of the people's hands entirely and the market is free to start moving as it wishes.

Right in time for that, exactly what I expected in the last update, a pullback intraday and probably the area and last chance for today any way to open call positions as price pulls back a bit just in time for the post 2 pm move.

 DIA 1m looks like it'w pulling back to that intraday "W" like pattern I mentioned last update.

IWM as well

QQQ 5 min shows strength in a longer timeframe so I think we are headed toward wrapping this event up soon.

And SPY intraday.

Just consider that we have been seeing afternoon negative divergences in to afternoon bounces, I wouldn't want that for Monday's open, but I also think that if we are going to bounce they are going to have to let that happen, I just mention this in case there is an afternoon negative in to any price appreciation, you won't have any problems if you are not regulation "T" compliant and want to get out of a a trade (pattern day trader rule).

I'll be looking at positions, I'll call them out as I see/enter them.

DE Core Short, BEAUTIFUL Chart

You can probably figure out where I opened the DE short based on the 9% gain in the short position and the market hasn't even broke.

If you are familiar with our concepts, DE is like a text book of them and you can probably tell where I opened the position, I just show you this because as you think about what positions you may like and why, you can look for certain concepts and almost be certain that the trade will come to you.

If I entered in 2011 and I do believe we did have a short there in 2011 that was closed mid-year, even at the top I would have waited years and not been much better off today then back then, that's a lot of market risk, instead we look for the events that signal the different stages and the concepts that Wall St. uses against technical traders to our advantage as well.


"A" When you have a triangle like this large symmetrical triangle, unlike the descending or ascending triangles, the sym. triangle has no implied bias, it is a pure consolidation/continuation price pattern and depends entirely on the preceding trend to predict it's eventual breakout near the apex of the triangle.


Concept: Technical traders will treat this like a consolidation triangle and because the preceding trend was up, they'll expect an upside breakout, however a consolidation triangle is rarely larger than a month or two, ANY TRIANGLE THIS BIG IS A TOP OR A BOTTOM DEPENDING ON THE PRECEDING TREND, in this case it's a top because the rally has run out.

*Look for 5 points of contact inside a triangle before a breakout

Technical traders are too lazy to apply their own rules which would tell them "Consolidation patterns aren't this big", yet they see it and think they know what it will do and Wall St. will use that to further their own position.

"B" Technical traders expect an upside breakout, they will buy and upside breakout so Wall St. can use the higher prices and buying demand to sell in to or sell short in to, this is a head fake or false breakout.

This is certainly 1 area to enter short or to phase in to a position.

"C" A bull flag shows up after the breakout, for a technical trader EVERYTHING makes 100% sense, a bullish triangle that broke out to the upside, a bullish consolidation flag that should also breakout to the upside, this is Wall St's dream and these price patterns are no coincidence.

"D" We see a breakout from the flag, that's what retail will buy, even though the flag pattern is WAY too big to be a real bull flag, THIS IS THE SECOND HEAD FAKE and you can be sure Wall St. is selling in to this as well, THIS IS ALSO WHERE I WANT TO BE SHORT AND AM.

Now that smart money has had plenty of time to distribute a large position and go short, who is left holding shares at higher prices?

What happens as those start moving to bigger and bigger losses and who will buy those shares as they try to sell them without extracting a serious price concession?

This is a text book chart to study to understand the relationship between smart and dumb money, how Technical analysis is used against technical traders, how technical traders are largely attracted to technical analysis because of laziness and how it shows above.

Just wait for Stage 4, decline, then we'll talk about "The Snowball effect" of compounding retail losses and a VERY profitable short.


Market Update: Now Change s in the air

Here's the Yen via FXY...
 When FXY breaks under the trendline, the market will likely be ready to make it's run higher, keep in mind the scale or the FXY top/reversal when thinking about the market's opposite move.

 Now we start seeing the process unfold of intraday accumulation, DIA 1 m

IWM 2 m

QQQ 2m

SPY 2m.

I'd guess we'll see one more bottom or intraday low to create a "W" intraday, but the last 3 days have been more like a bear flag with the a.m. decline being the pole and the afternoon trade being the flag that trades away from the morning trend in a sort of parallelogram.

FXY Follow Up / Trade

There's no real great secret that I need to hide from you to try to impress you with foreknowledge of the market, my goal is to give you the tools to apply the concepts to your trading as you see fit.

So if we think about what is driving the market or will create change (whether short term so we can possibly enter 1-2 day calls/longs  or long term to enter shorts) there's either going to be the SPY arbitrage to send the market higher, in which case the relative performance of arbitrage assets vs the SPX and each other is one force that can move intraday trade. In this case you'd look for HYG's price to move up while TLT's and VXX's moves down, for a negative effect on the market, HYG moves down and TLT and VXX move up.

You can watch for that alone or individually with the next driver, ideally both work at the same time, the next is simply the USD/JPY currency pair, but to keep it simple you just need to watch the Yen, if you are charting futures, the symbol for the Yen in TOS is /6j if you are using ETFs, use FXY.

Here's both...
 Yen 5 min futures are topping short term and starting to make that turn, they are still up on a bounce this morning, but when that turns down it will relieve the downside pressure on the market.

The longer 15 min trend is cleaner, as the Yen has been bid, it's effect on the USD/JPY has been negative on the market, I showed this chart several nights ago just starting to go negative and now the divergence is in, we just need to see intraday trade turn down and that will set up the market for some short term strength, but I'd remind you it's so fragile that anything I entered would be speculative, leveraged because I suspect it doesn't hold long and stuff that I can get out of quickly, this is for the hitch-hikers, for those waiting for some price strength to short in to, just be patient, that's the real trade/market gift.

using FXY as a proxy for the Yen
 The 3C 5 min chart in line and then goes leading negative, it's almost like a small H&S at the top and this is part of why I said FXY short is a trade that would work with little risk.

The 3 min chart, I didn't draw on it, but the trend of 3C and the trend of price should show an obvious divergence, a stop can be place above the red trendline, but the less obvious it is, the better.

 The 2 min chart, so essentially this is very close to what might be considered a right shoulder in FXY, looks as if it's about to turn down (relieving downside pressure on the market.

This top of the left shoulder is also one of the only places I'll short a H&S pattern, keep in mind its size when considering the profit potential.

FXY in the trend channel shows a break below $101.25 should be close enough to creating a substantive change in the market that can be taken advantage of for short term action only.

I show the averages as starting to chop around so some of that downside momentum has been relieved, there's still a reversal process proportionate with the a.m. decline, but that's pretty much what to look for right now as far as steering currents and timing.

Opening Indications

There aren't really any surprises, the signals the last three days have been negative in the afternoon, a unique feature of 3C or at least of what 3C shows us in the market, is whatever was planned the day before (no matter what happens overnight), you can rely on that signal playing out the next day, even over weekends.

So the last 3 afternoons have shown negative divergences and the last 3 openings have shown the market weak in a.m. trade as was suggested in the inrtraday 3C signals the afternoon before, today is just a 3rd day of that.

There are some "slight" signs of a little momentum loss or very slight positives developing mostly in the IWM and DIA, but nothing even close to being worth taking action on.

 The DIA's afternoon intraday weakness yesterday and this morning's price weakness on a 2 min chart.

The 1 min shows the same, but with a very slight positive and this is even more slight considering it's on a 1 min chart so I'm not paying much attention to this right now.

IWM 3 min showing the negatives rolling from Wednesday afternoon to Thursday afternoon with price weakness Thursday and Friday morning.

This 1 min IWM chart is the closest thing to a positive in the averages.

QQQ 1 min 3C weakness yesterday afternoon (other timeframes as well) and price weakness in yellow this morning.

SPY 3C weakness Wednesday afternoon, price weakness off yesterday's opening gap, yesterday afternoon 23C weakness and this morning's price weakness, nothing to see here yet as the signals from the afternoon still dominate morning trade.

A cleaner trend of 3C afternoon weakness and this morning's price weakness.

CONTEXT is positive by something like 8 points, also the SPY arbitrage is positive, I suppose that is from early TLT weakness which I have expected to materialize in the short term as signals have developed there the last few days and probably helped by HYG at least holding its ground for the most part.

This is what we expected since yesterday afternoon so we can't really complain, just look for opportunities, signs that a window of opportunity will emerge and stay patient. The slightly longer charts that have also been correct about what to expect after a.m. weakness have also been right on and I showed you the multiple signals and leading indicators, it may just take a bit longer on an op-ex pin Friday, typically around 2 p.m. the market frees up from the pin.