Tuesday, February 26, 2013

Performance

Until the new website is up and I decide whether or not to trade a real money portfolio (it would be great as a model portfolio rather than a tracking one and would have much better performance) as a model portfolio or not, we'll have to stick with the tracking portfolios which are way too many positions, performance is diluted do to the number of positions.

The problems I face with a real money portfolio are : 1) My members' should come first before trades in that portfolio, as you know the market can change in the time it takes me to write a small market update. So in this respect I either don't pay attention to our hard earned money like I should or I don't give 100% to my members like I should. I have toyed around with the idea of a small portfolio of about $1000 because these are the hardest to manage, your risk management has to be spot on, but I think it would be an interesting challenge.

2)  Although I would NEVER do something like this, conceivably if I put out a trade idea and front ran it, I'd be making money at the expense of my members and I don't even want to be accused of something like that.

3) I have concerns that a model portfolio would be an endorsement of a specific position so long as it is listed and as you know, I only endorse a position at very particular areas that rarely last more than a few days, after that the dynamics of the trade and risk:reward relationship change dramatically and while I would hold the position, I would not encourage others to enter the same position unless it came up again as a new trade/add to position in the right place at the right time.

4) This is sort of the same as 3, I would not want members to feel the 5 or 6 positions I would trade at max would be the positions they should take. I put out a lot of ideas because we have an incredible array of different trading styles. I personally am very tolerant of risk, I wouldn't want someone taking the same trade I may have took based on nothing more than timing, thinking it is a superior trade to others put forth. It's important the trade fits you, best of all it's great when member's chose their own trades based on market updates and other information because they are really making the trade their own and trading is not about one style being better than another, it's about what works for you: your risk tolerance, your portfolio size, tour objectives, the time you have available to watch the market and your experience.

These are just a few things I have to consider as I'm deciding what the new website will incorporate.

If you have things you'd like to see incorporated, feel free to send me an email, but several things I'm looking at will include:

-Candidates list-these are positions I'm interested in, but the timing isn't quite there.
-Some sort of open positions, the problem I had with this last time with a Spreadsheet was updating it took hours every day, I prefer to update a position in a post which is more useful and at least I know someone is in the trade rather than updating dozens of ideas no one is in.
-Model Portfolio, however this is my last priority as far as my time goes as well as the issues above
-Specialized custom email filters, allowing you to pick and chose what types of updates and trade ideas you want in real time, the rest you can look over at the site or receive all.
-Risk Calculator so you can easily figure out position sizing
-If I can make the site more time efficient, than I might add a weekly live seminar
-A more complete collection of useful articles/links, I have thousands of posts, some very useful.
-Possibly a Trading system or trend classification system, this will cost a lot of money to do, but I'd like to be able to allow you to enter a symbol and get a 3C perspective of short, intermediate and long term.


There are quite a few more things, I want to avoid things like quotes as you can get them anywhere.

In any case, a new website was one of the New Year's Resolutions for this year, but we have grown so fast in the last 6 months and really exponentially over the last few weeks, we are literally out of space for new members on the Blogger platform. A few things I'll have to reduce like email support, for current members it will stay the same, for new members it will likely be an additional option with a limit per week, unless I can convince one of my longer term members who understands 3C to come and work for me-George, Sam?


Any way, we continue to do very well with the large tracking portfolio, I just looked as of the close today and really it doesn't matter to me all that much, but it tells me a lot about how other traders are negotiating this market and in a way, it's a sentiment/performance indicator.

While I think finding your own style is crucial, I also think there's a right tool for every job and out transition to weekly puts and calls and holding them for 1 to 2 days based on the signals was absolutely the right tool for this market, now that volatility is moving up again, that will change.

Here's the performance of the options portfolio which has been astounding, I think we are somewhere around 16 or 17 trades in February with only 1 loser of -2.5% and 1 possible loser that is still open, everything else has been a big success and I was doing some spring cleaning in there today and closed out 1 GLD option position I forgot about for a 600% gain.

The Weekly Rank is #8 with an overall portfolio return of 12%, that's better than most hedge funds did all last year.


The #8 position means we are in the top 1/10th of 1%. What this tells me is that our tactic of hit and run, not getting greedy, not staying in the game long enough for the house's edge to overcome our position and being selective about the positions we have taken, has been absolutely the right tool for the market environment, which is now changing due to increased volatility.

The Options Portfolio on a monthly basis which is funny, because I'm not a big options fan and I'd think on a monthly basis we'd be near the bottom for lack of trades, but we have had quite a few over the last 3 weeks, so we are at #19 with a nearly 25% gain on the month, boy would I like to annualize that performance!


At #19, we have a lot more competition in the monthly category, but are still at an impressive 1/10th of 1%

The weekly Equities portfolio is where we have been building positions in expectation of some of what we saw yesterday, these are longer term positions, but they have done extremely well over the last couple of weeks, we're at #42 of 1519 with a +6.36% gain on something over 25 positions that are in the tracking portfolio so that's pretty impressive for the week.


In any case, this just affirms that we have been on the right track both short term and long term, the longer term equities is just starting to come in to its own, 6 months from now I'd love to see where we are.

Again if you have suggestions or if you build websites, feel free to email me. If I don't get back right away know it is because I'm either overwhelmed with work or I'm taking an hour to eat with my wife.


The Reason for the last Entry (TQQQ Long)

First let me just throw out there the very real possibility of a larger base, rather than today's "U" shaped as we talked about this in last night's market wrap with regard to reversals being more of a process than an event, there's also the "W" shape which was mentioned last night and today many times; this would take a second day and look more like this.

Follow the green arrows to the right. If that type of base continued forward from here, as long as the 3C signals were growing in strength, I'd look for a break below the red trendline (a shakeout and a move to pull in new shorts) and I'd look to add to the speculative long in TQQQ/URTY because the larger base would have larger implications for a bounce. Wd don't have any evidence of that at this time, the closest thing to evidence would be simple market behavior.

As to why I decided to enter the TQQQ portion just a 20 minute or so ago, here's why (and this is more for those of you trying to learn 3C)...

 The intraday negative divergence that halted upside momentum started to end and go positive, with overnight futures having the ability to change the outlook dramatically, I'd rather enter before the close on the start of this new signal even though it's not quite mature.


In ES, we see the same thing and this is a bit more mature than NASDAQ futures, but that's the reason.


Entering TQQQ

This is the second half of the URTY/TQQQ speculative long position

More Data

This is just more data that backs up my position that we will almost certainly see a correction/bounce to the upside, the thing is, saying that or hearing that right now sound reasonable and most people feel like, "OK, cool, this will be an opportunity like he's been talking about".

However, Wall St. rarely does anything half-tooshied. When they wanted a low volatility melt up to drag dumb money back into the market with no pullbacks to scare them and a bunch of nightly news headlines, "This is the highest the Dow has been since XYZ0!" they did it and did it well.

When they want to scare people out of positions, they do it and do it well, you'll see a downside move like yesterday that sends longs in to a panic, shorts chased it and likely we'll get an upside move that may indeed make that all-time new high in the Dow that CNBC was talking about yesterday morning just before the market crashed.

The point is, be prepared for an emotional assault that is meant to touch on the two things that move the market, FEAR and GREED. 

This is all part of my market Pendulum concept, it swings way too far one way and way too far the other, don't fear it, it truly is a gift/opportunity.

To give you some proof to sustain you, although I doubt you'll recall if we get the kind of move I'd expect, here are a few charts....

 VXX which is the short term futures for the VIX, moves inversely vs, the market, market down, VXX/VIX up. This 10 min chart shows the positive divergence going in to yesterday's bloodbath and the VXX did well on that move, up nearly 14% yesterday.

However check out today's relative negative divergence at new highs, this suggests a near term pullback in the VXX (which means the market moves up near term).

 However if we look at the charts that really matter here, the 30 min VXX chart shows no sign whatsoever of any distribution, it is in line and positive, meaning the move should be short term only and the VXX continues higher after that, traders who have built a longer term long in VXX are not selling it, just some people like us trading around the market, market makers, specialists, traders, etc.

TLT-20+ year Treasuries-The Flight to Safety Trade
 We looked at this yesterday, the 1 min chart (intraday) shows distribution, but that's short term as TLT also trades opposite the market.

At a more importnat 15 min chart TLT is in line perfectly, no distribution. So if we get a very sharp bounce to the upside, try to remember these things (I've put a lot out there) and not react emotionally, but use the gift given as just that.

Going to Open Spec Long in URTY

I see some changes in the 1 min ROC and I really need to focus on the market more than positions.

This will be 50% of a normal position size, if we get some more weakness in to the close, I'll add TQQQ long (QQQ 3x leveraged ETF) at 50% to make 1 full size position between the two, I'm more than hedged on these positions with core short positions built.

Market Update

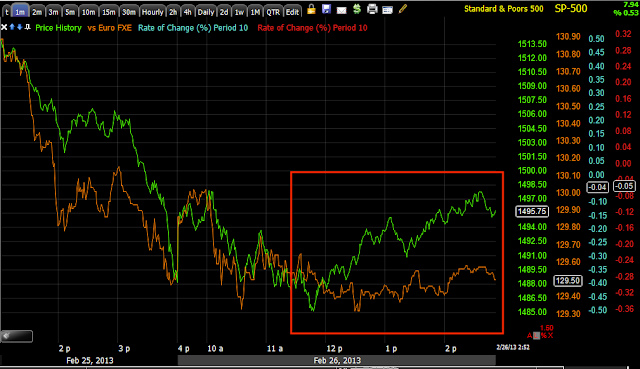
I just wanted to show you what I said earlier, I believe is pure market manipulation.

 Most risk assets are not participating, institutional size positions can't be flipped like we can so CONTEXT is well below ES, making ES rich and not well supported by Risk Assets broadly.

 HYG/High Yield Credit is so liquid that it can be used, this was one of the first hints we had today.

The Euro is of no use at all as far as supporting the market, at best it's just not falling.

This is the kind of move we want to see to sell in to and sell short in to price strength, but underlying market weakness.

It's all about Tactics

Once you have a strategic view, everything else with regard to entries, exits and risk is about tactics, this is why I might like a position today, but not tomorrow if you aren't already in.

Here's the market pullback I was hoping to see...
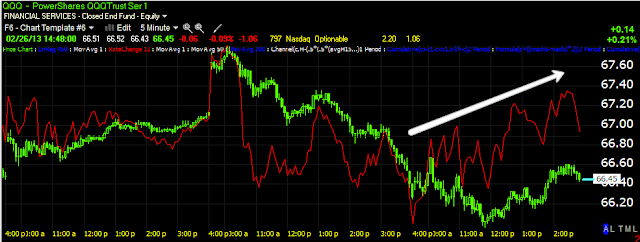
 QQQ 1 min with a simple Rate of Chance indicator...

The larger picture on a 5 min chart.

You'd be surprised how you can make most indicators much more effective by applying ROC to them.

Market Update

Here's the latest...

Starting with futures...

These are the 5 min 3C charts of the S&P and NASDAQ futures, they don't have the positive divergence on them that has been working so well with our weekly call/put positions, although volatility is higher now so we could see a move that exceeds our expectations and if we do get a solid move, I expect it will, it needs to keep traders emotionally off balance and extremes do that.


However the strong accumulation on the 5 min chart is not there, this is one reason I opt for less leverage, the other is any long trade is already hedged with core shorts so I'd prefer to use less leverage here given the charts.

 ES 5 min slight leading positive divergence

 NASDAQ futures have none.

 As for the market, as I said last night, a reversal which I thought to be likely in the short term is a process, not an event so the white arrows depicting a "V" shape reversal is not what would be expected, but rather a "U" or even a "W" shape if price pulls back toward the lows of the day.

The size of the base as well as the strength of the divergences tell you a lot about it's ability to maintain, volatility is up and options are going to be more expensive to start with, but the point is we can still have a large move just based on volatility and market behavior in these areas.


 2 min DIA negative on yesterday's highs, in line on the move down and positive today with a short term intraday negative divergence, this is why I'm patient about a possible pullback.

 IWM 3 min with all the same features except the intraday pullback, I may look in to URTY long as a 3x leveraged ETF for a quick long trade, that's the IWM 3x Bull.

 IWM 5 min looks pretty darn strong, this is why I'm leaning toward URTY long and maybe TQQQ-long the Q's 3x leverage.


 The IWM 2 min has a small intraday negative divergence so I'm hoping to get a pullback to lower risk.

 QQQ 2 min with a leading positive today and a relative negative recently, this is the probable pullback signal intraday.

 QQQ 5 min leading positive after a weaker relative positive, you recall how today's sentiment was cautious earlier.

 SPY 3 min

 SPY 5 min looks pretty good here too, the long 3x leveraged is UPRO, remember though these are speculative, short term trades.

This is the reason why, the 30 min SPY, the back of the uptrend is broken, the real trade here i selling short in to price strength, that's where the real probabilities are so you can catch a little upside I think, but that's our real objective.

Plan

I'm going to wait a little bit and see if the market pulls back just a bit, the QQQ chart and ES 1 min intraday looks like it will...

 Intraday relative negative divergence among a large leading positive, but still short term.

 NQ futures with a small intraday negative

ES with a small intraday negative

The 5 min charts aren't where I'd want them to be to take on the weekly options trade, volatility is increasing so on a pullback, or you could even start phasing in here as long as it's part of your risk management plan, I'll be looking at a 3x leveraged position like TQQQ or UPRO, this is for a short term trade only. I'll let you know what moves I make, but these will be speculative size (50% of a normal position).

GLD Calls Fill

The fill was $7.69 so this position opened Friday of last week just made 62%

Like I said, I have the feeling we'll be able to open a new position on a pullback.

Closing Out the Rest of GLD April $150 Calls

I think they can be added back at a lower price.

Here we go

The charts are looking good, I think you can probably get away with some weekly calls, it's not my thing here and I'd go out to next week, but if you get some Q's or SPY, I think you can probably sell them tomorrow. I'd keep it speculative.

Leading Indicators Update

This is all intraday only as we are looking for a bounce that we can use as a tactical entry area.

To save time I'm not going to post the charts, but just make this a written update.

Both High Yield Corp. and Junk Credit are performing better than the SPX, this is a risk on posture in the short term.

The $USD and Euro seem to have very little to do with this, if anything the Japanese Yen intraday has the closest correlation to the market, I'm not convinced its the Yen moving sentiment, but it is in the proper correlation. The Aussie is in line, but it's not leading the market.

Yields aren't leading the market either, they are in line to slightly underperforming the correlation.

Basically the only thing standing out is a risk on posture in Credit and the instruments of choice are the most discounted, HY Corp and Junk.

CONTEXT is even out of line with ES rich vs the CONTEXT model...


So what is driving the market at this moment or at least seemingly changing sentiment toward that oversold bounce we talked about last night?

It seems to be Wall Street driving underlying trade as we saw in futures and the averages. From my point of view, that is the best because it means there's no underlying strength behind the sentiment, it's just market manipulation as they seem to be looking to do the same thing we are looking to do.

There still needs to be a process to a reversal in my view, not a "V" shaped move. Also volatility is high and they'll likely keep it high so any move to the upside is likely to be impressive, although hollow, this "may" make it worthwhile to play a very short term move on the upside with one of the averages, I have certain standards that have to be met and they aren't yet so I'd rather miss the move up than take a sub-par trade, that doesn't mean those standards won't be met, they may very well be met before the close.

I'd probably expect some more market chop laterally which may mean a move toward the lows of the day, but as long as 3C keeps moving higher, we are in good shape and thus far it is.

What we are looking at right now is pure short term manipulation, but that' fine with me, whatever it takes to get the job done.


Market Update

I'm not counting any eggs here, but this is movement which we have been sorely lacking this morning, I would not trade this, at least not at this point, but I'm more interested in selling strength. We'll deal with that when or if we have a solid enough edge.

Futures...
 This is a pretty strong leading positive ES divergence -SPX futures.

 The NASDAQ which has been floundering may be playing possum here, it too has a leading positive divergence in the futures.

 DIA 2 min is looking better

 5 min IWM is looking a little better

 2 min QQQ is starting to look very interesting.


 5 min SPY is leading positive, still small, but moving.

Here's GLD, we got out right at the top this morning so I feel good about that.

I'm going to check some leading indicators. I know patience is the hardest part sometimes, but it is your greatest advantage over Wall St., you don't have to be in the market all the time, you can pick and chose your battles on your terms. USE THAT ADVANTAGE.

Quick Update

I'm seeing some strong 1 min upside momentum in ES and NQ, I haven't even checked the averages yet because this is so important, but I'm sure it will be there, this is what I'd like to see, this is how we'll open opportunities.

Market update

If I'm slow on answering your emails today, please bear with me, I'm trying to listen to the Senate hearing, see where the market reacts, keep track of positions, look for opportunities, watch out for traps, etc, I feel like a one-legged man in a butt-kicking contest.

Last night I said (and I say this often),"A reversal is not an event, it's a process", actually last night I said I don't subscribe to "V" shaped reversals, they are usually more "U" or "W" shaped, in that regard, the market is right where it should be, but it is VERY much on the fence here, one slip from Bernie and down we go, otherwise Wall St. needs the market to bounce just as we do to open new opportunities.

Right now is not a time to be opening positions, it's a time to wait this out for a strong signal. We are getting signals, but not strong, they are VERY cautiously dipping their toes in the water and I mean tippy-tippy toes.

Here's a look at the averages and TICK.

 DIA 2 min intraday is slightly positive here.

 The IWM is positive, but very slightly out to the 5 min chart. If you look at the yellow arrows to the left, this is what a typical reversal looks like, it takes about a day, it's not a "V" reversal.

 The Q's have a 2 min positive, this really is telling us there's almost no edge either way, everyone is waiting, when 3C starts moving we'll know and this could happen in the course of me writing a post like this.


SPY 2 min slightly positive as well.

The TICK puts all of these charts in to perspective.

We have no clear trend except lateral with huge swings between -1000 and almost +1000 so it's nearly a dead heat here.

There's no edge at this moment.

GLD P/L & Fill

The longer term charts are what attracted me to GLD, that's also why I wanted to shift from March out to April, however in the very near term this run this morning in GLD looks pretty darn nice, but when the intraday chart (3C) failed to make a new high with GLD, I started considering closing some of that position. Since it is an April expiration, I don't mind leaving some on the table at all with the great looking longer 3C chart which are way more important, but tactically it is worth a shot to try to take some profits here and re-enter at a lower cost basis.


 The fill as you can see below was $7.72 so the gain on this position opened Friday is nearly +67%, you can't sneeze at that.


If I see a good re-entry point, I will of course bring it up as a new or add-to position.