Friday, March 30, 2012

APPLE Close

Changes in character... AAPL posts biggest 2 day drop since late November, about 4 months.

The difference is then AAPL was at the very bottom of a capitulation move on a 3 week pullback, we often see large drops at the end of a move down, it's mini capitulation.

ES Update

ES with the first hint of a positive divergence since late yesterday

It's not much, but maybe we get a bit more Monday, we'll have to wait until then to see. China's Flash PMI on Sunday should make Monday very interesting.

At least I have some positions started as this looks to be the exact same set up we saw Monday-Tuesday this week, negative divergences that were consistent and persistent through the entire time the market was up followed by selling Tuesday and Thursday and quite a sharp reversal giving up all the gains...

Here's ear;y in the week in the SPY.

The difference is now there's a lot more damage done to the underlying picture then this early week rally.

Market Update

This is a very tough call to make here, especially when there's negative divergences as suspected and expected in to any kind of strength, but I was clearly looking for a more spectacular bounce.

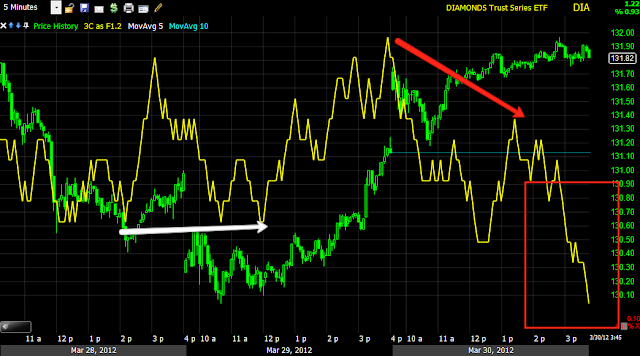
 DIA nega div in to any strength today

 The 5 min looks bad

 Even the 15 min looks bad

 The IWM with a triangle, these can be head faked 3 or 4 times before you get a real move or it could just fall apart which is rare, but a lot of damage was done early in the week. No bounce at all in the IWM?

 There's only a hint of a positive divergence on a 1 min chart today and near the apex of the triangle

 The 5 min is in line

 QQQ same triangle-no gains


 Same 1 min positive

 The 5 min chart is just in line even though the Q's looked the weakest the last 2 days

 SPY negative into any strength, just like early in the week.

5 min negative as well.

I really expected a stronger much more impressive bounce.

AAPL Update

I'm pretty conflicted on AAPL, the NASDAQ and IWM haven't bounced, obviously AAPL is hurting the Q's today.

 The 60 min chart saw a lot of damage this week in to the highs.

 So did the 30 min

 The 5 min is in a leading negative position, but....

 There's a positive divergence there and after an 11 point drop today, a shakeout would make sense on the upside.

The 1 min chart shows the positive divergence too.

I think I'll wait for something that looks more solid, there's plenty of opportunities out there.

Considering AMZN Short Here

AMZN closing below the small red trendline would be a lot of confirmation of that shooting star from Tuesday, being I likely won't have time to enter positions in the model portfolio as we get closer to the close, I'm thinking about just getting some puts right here.

Going to Grab a partial position in IOC Puts

I was hoping for a bigger move up and will add if there is, but this recent candle with the long wick on heavy volume looks like churning.


Market Update

 DIA still seeing that negative divergence n to price strength as expected last night

 ES making a new 3C low in to price strength

SPY still negative all day.

The Q's and IWM can't get off their butt.

The move has picked up some steam right about on time, at least as we have seen the last 3 days.

FXP Trade

I said I wanted FXP (China 25 UltraShort) at the 10-day moving average...

 This is close enough for me.

The recent pullback...

My timing may not be perfect here and there is substantial event risk on the release of Chinese Flash PMI Sunday, so I'm going to take on a small trading position in FXP using calls in the options Model Portfolio.

Risk Layout Update

 Commodities ticked up today as I suspected they might, but still remain pretty dislocated from equities, in white is a positive commodities divergence.

 This chart is a bit hard to understand because of scaling, but all you have to know is this is High Yield Credit and the orange line is where it closed yesterday so it hasn't moved above yesterday's close, the green line is where the SPX closed, it has bounced above the close, thus we have a negative divergence between credit and the market as I expected to see.

 Yields remain divergent from the SPX

 HY Corp. Credit just barely moved above yesterday's close, much is much less inclined to take risk on here as the SPX bounces.

 The $AUD, a great leading indicator is divergent again from the SPX, the last time it was divergent was at this week's early highs and the SPX fell from there.

Here's the $USD dollar correlation and recent trend I talked about last night, there's early strength in the dollar which is a drag on the market and then around 1 p.m. it turns down which gives the market a boost, the key is it happens only AFTER the EU markets close.

So far so good.

Continued Neg. Divergences

A couple of quick examples

 DIA

 ES

SPY

I think the Q's and IWM need to make up some ground before we see the same clear trend in them, the idea is sell in to strength.

GLD/SLV Update

As per yesterday's intraday updates and last night's post, the long GLD/SLV idea from last week (which was always meant to be a short term trade-I thought maybe as long as a swing trade) looks very much like the recent move down this week was what I suspected yesterday, a pullback and GLD/SLV have the opportunity to move higher. Thus far both are up today and up the most since the pullback began on the 27th.

 GLD since the trade idea last week in white, the pullback and today's start of a move higher.

 Here's the 15 min chart showing the accumulation for the idea last week and the reversal for the pullback as well as a recent positive divergence yesterday suggesting this was a pullback and GLD has more to go.

 The 1 min chart showing yesterday's positive divergence and GLD leading positive intraday.

 The same is true for SLV

 The positive divergence after the pullback...

And the 1 min intraday is starting to lead.

Keep in mind, these were meant to be quick trades, you might consider a trailing stop here.

IOC is bouncing

As expected from the earlier update on IOC, these parabolic moves are just too predictable as is a break of major support. I said I would consider shorting IOC anywhere from $50 up to the Trend Channel stop which is at about $57.50 on the close. If you like the trade idea, this may be one to phase in to.

On a normal parabolic move, I would expect IOC to hit at least $54, but we'll need some more dollar weakness to give it some help.

Market Update

Thus far, EVERYTHING is going according to plan.

In last night's market wrap I expected to see a few things, 1) a gap up opening based on ES holding up overnight which happened, 2) the continuation of the recent intraday trend-early morning dollar strength dropping the market a bit and afternoon dollar weakness lifting the market and 3) distribution /negative divergences throughout the market in to any strength.

Thus far everything has happened and now we are moving toward the time the market sees a afternoon bounce after the EU close. I'll want to see continued negative divergences in to that and may have to enter some short positions earlier then I'd like just because I'll probably be too busy later.

Also recall in the market updates of the last two days I have consistiently said the positive divergence for a bounce in the market looks the weakest in the QQQ, look at the major averages today, the QQQ is the weakest, just around unchanged while the SPY/DIA are up nearly .50%

Here's what the market looks like thus far, which confirms the last ES update.

 DIA 1 min negative divergence leading lower through any intraday strength.


 The DIA 2 min which had a pretty nice looking positive divergence, a consistent negative divergence all day thus far.

 DIA 5 min, this is where the 1 and 2 min chart divergences accrue, it is leading negative below the level in which the positive divergence for a move up even started!


 IWM 1 min negative right off the open and negative in to the intraday move higher.


 IWM 2 min also negative on the open and leading negative at the move higher.

 IWM 5 min negative divergence

 QQQ 1 min negative , it looks closer to inline, but inline would see 3C higher near the spike where the last red arrow starts.

 QQQ 2 min negative on the open.

 The 5 min chart  is more in line with price.

 SPY's move up in 3C is over, a strong relative negative divergence.


 SPY 2 min negative


SPY 5 min negative