Wednesday, March 5, 2014

Daily Wrap

I try to give you analogies you can remember so you can apply them to your trading, one of the ones you hear most often is that quiet days in the market make me nervous, they're like "The kids in the room next door being just a little too quiet, you know they're up to no good". Beyond that they lull you in to a sense of complacency, "well nothing's going on, I might as well catch up with my laundry", this is why I try to make sure I'm extra aware even if I'm naturally inclined to be complacent.

What I have found in years of doing nothing but watching the market is there are certain times that correspond with certain events and you get a fleeting glimpse of something really important that you'd otherwise miss if you were to just come home at the end of the day and look the charts over, this happened on September 13th, 2012 at 2:24 p.m. during a Bernanke press conference after the F_O_M_C had started QE3 at a 12:15 announcement. Bernanke had been giving a press conference after that I was watching and for the first time ever (as far as I know), Bernanke had answered a question at that exact moment that had to do with asset purchases and inflation and it was the first time he made clear that this program was "conditional" which the market DID NOT like, the market topped for the day after a strong knee jerk reaction up at that very moment and that was it for the market upside for QE3, the highs were not passed until January of 2013 and the market had drifted down some -8% even though QE3 which it had been salivating for had just been announced, it was what Bernanke said at that very minute that changed the market's outlook and perception and that was the first time we started considering that the F_E_D was looking for a way out of accommodative policy.

In any case, today was easy to fall in to a sense of complacency, the expected or normal follow through from Tuesday's market action has been notably absent. Today was one of if not the smallest range day of 2014 and one of the lowest volume days of 2014, far from follow through buying confirmation.

The range between open and close for the SPX today was 1 penny, that's why you see a bearish Doji, one of the best examples of a Doji (indecision) candle you'll ever see as you can't have a Doji with a smaller range than 1 cent.

The Dow's -0.19% day created a Harami (bearish candlestick) reversal, the NDX's +0.20% created a bearish star and the R2K's -0.19% created a bearish Harami or what we call an "inside day" in the west, the Japanese call it "Mother with baby".

As mentioned, it was also one of the lowest volume days of 2014. I'm not sure if "worry " is the right word, but I am concerned for Technical traders who came in to the market after 2008/2009 as they have missed and never learned the importance of certain principles that I will make sure I share with you to the best of my knowledge like "Price/Volume Analysis" which was already taking a back seat to new fancy indicators before 2008, however as I use to say (it still might be true if the market were devoid of the F_E_D's accommodative policy) that if I had only two indicators to chose from they'd be price and volume, you can learn a lot about the market when the F_E_D isn't [propping things up with QE or the Bernanke put which is ending and as it does, I'm noticing volume playing a more crucial role.

For example, take a look at the bull market from 2002/2003 to 2007  and look at volume for the SPX, it should advance with price, then look at the market since 2009, it didn't matter what volume did as long as Bernanke was a back stop, but that's changing ad as I said, I'll pass on everything I know so you can take advantage of this very telling set of indicators.

As you know, I track the Dominant Price/Volume Relationship for all of the major averages every day, this doesn't mean the volume for the average itself, but the dominant relationship of the 4 possibilities in each of the averages' component stocks.

For example, today there was a Dominant P/V relationship among all the majors and it was Close Down/Volume Down which is not surprising, but of the 4 relationships this is the one with the least bias, actually no bias, but during a bear market it is the defining relationship most often seen. Today the Dow had 14 stocks in the category, the SPX had 210, the NDX-100 had 54 and the Russell 2000 had 1332.  Although this has no next day implications, it does show us just how dead the market was today, at least it seemed that way looking in from the outside at price and volume alone.

As far as Leading Indicators, most of what I showed you earlier today is still in place as of the close, with the exception of a few key indications. One key change today was in our shorter term professional sentiment indicator, it went quite negative today to join our longer term (intraday vs a week or so) version. There were several other indications such as High Yield Corporate Credit, HYG which is used as a market manipulating lever, it fell off badly and I showed the 3C charts as I have done the last week or so showing they are abandoning the position as they don't want to get caught without a chair when the music stops.

Here's what is different and why it matters....
The SPX needed a pump in to the close to get that 1 cent and close green, usually HYG (credit) would fool the algos in to buying and doing the lifting, today, not so.

(All indicators are compared to the SPX in green unless otherwise noted)

 This is HYG, High Yield corp. Credit, an institutional risk asset that the algos read as risk on when it is rising and buy, thus it has been used extensively over the last several months to ramp the market, but today as the SPX was fighting for a cent to close green, HYG could not or would not be bothered, see my linked post of leading indicators from earlier today to see the distribution in HYG.

 The market had to turn instead to a slap down of the VIX short term futures which are in blue vs the SPX, you can see late day if it weren't for the VXX the SPX would have closed red, in the not so distant past the SPY arbitrage was run daily using HYG up and VXX and TLT down to move the market, but now they can only get one of the three assets to move and barely at that.

 What was probably most interesting to me today were the next two indicators, the short term professional sentiment HIO which sold off in to the market's flat drift, joining the longer term sentiment indicator that is already way dislocated to the downside and...

The indicator that many of you have written to me about a lot recently, High Yield credit which is an institutional risk asset that retail traders rarely trade, it's the pros that trade it and it has been pretty much in line with the SPX until today as you can see it sold off pretty hard in to the close.

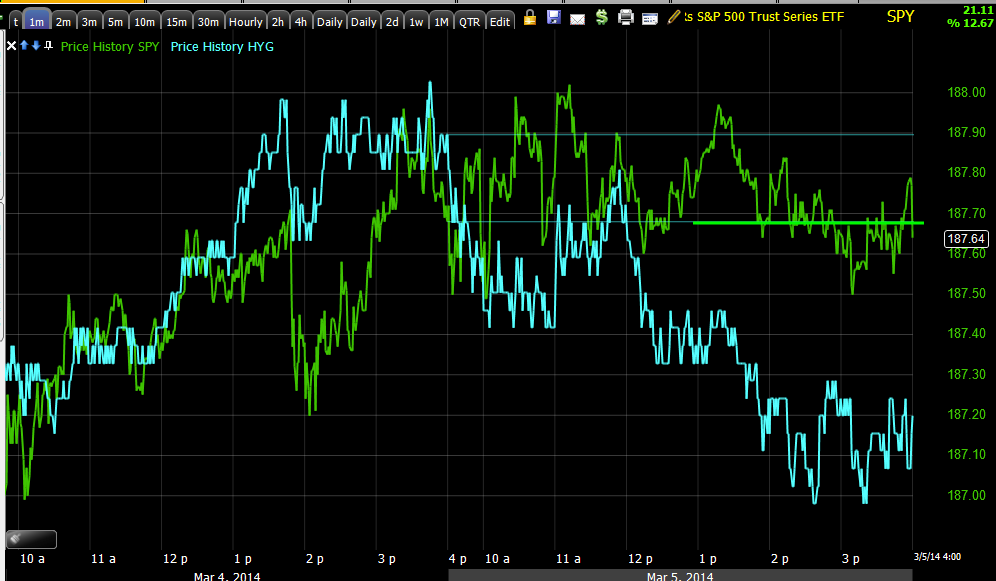
As te Wall Street maxim goes, "Credit leads and stocks follow" because the credit markets are much better informed, much more professional markets than equities so this was an important move in what seemed like an otherwise boring day.

Oil as we talked about today in the SCO posts saw its biggest 2-day drop of 2014, like I said earlier, I'm a bit concerned about some of the short term charts, but the intermediate picture is so juicy, I just don't have the objective evidence to warrant closing the position. Today SCO moved up +4.31% for us and over the last 2-days, +6.86% and I don't think this is even close to a breakout or counter trend run to the upside!

As you know I am very interested in getting a Financial Put in place, but the trade has to come to us otherwise there's always another bus, Financials were the best performing of the 10 S&P sectors today, up +1.05%, I don't know that we'll have that same rotation tomorrow, but we're only about 4 cents away from an acceptable position, the higher it moves in one leg, the better as long as there's distribution which I'm nearly sure there would be, however as I said, that sector is likely to rotate out tomorrow.

However what may be more important for Financial shorts like FAZ is the fact that it was allowed some lateral time today which it desperately needed to form a reversal process. I talk a lot about the reversal process, it's not some abstract , made up concept. Imagine we are like jet skis, we can fill a 100 lot order and not move the market or worry about our order having any major slippage, but imagine you are an institutional firm that's more akin to an oil tanker than a jet ski, you are trading positions that may be the equivalent of the day's entire volume, you can't just pull in and out of positions like that without either driving price against your position or attracting institutional Iceberg hunting algos that front run your order and make you pay up and miss a good entry. As Cramer once said, "Never do anything remotely honest on Wall Street" and these firms don't, they break up the orders (that's why the HFT's are looking for "Icebergs" because only a small portion of the order is visible like an iceberg, the bulk is below the surface and out of sight) and route them through different facilities to hide what they are doing, BUT IT TAKES SOME TIME, THAT'S WHY THERE'S A PROCESS.

As far as FAZ's reversal process, I talked to a member earlier today and had said, "Imagine FAZ just taking off to the upside from here, you've seen enough charts that you know the market doesn't look like that", this is what FAZ looked like at the time on a 30 min chart...

 I highlighted a couple of reversal processes, but to the far right as of this morning there was none.

However by the end of the day, that sideways motion we needed was probably enough, remember this is a 30 min chart as well.

Now (by the close) FAZ HASD A REVERSAL PROCESS IN PLACE, it may not be the end all of the process, but it's a lot more likely to make a move now than it was this morning.

However as far as the broad market remembering that the positive divergences of Monday only reached 2 and 3 minute charts except for the SPY where it reached 5 mins, might have been the move or migration of the divegrence intraday to 10 min charts, for example the SPY which had been the most stable 3C chart and the QQQ.

I placed a red arrow at Tuesday's 4 p.m. close so you can see just how much the divergence migrated along a 10 min chart intraday, again far more distribution than accumulation.

 SPY

QQQ

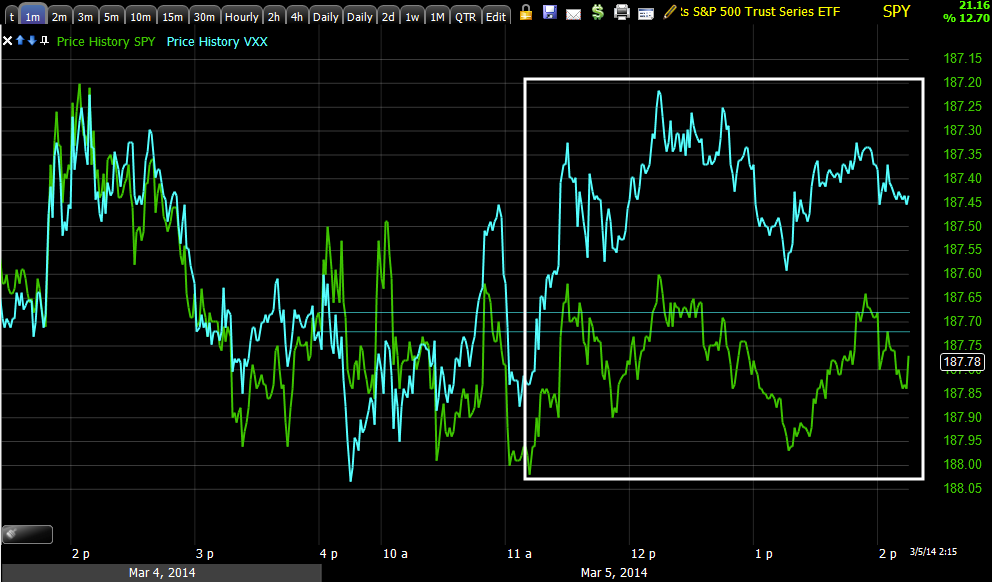
Once again (remembering that all in all the SPX futures are still about 70-80 points richer than their USD/JPY correlation), the USD/JPY v ES correlation was in effect again today even though it looks sloppy due to such a tight range,  which makes me wonder what the market will look like when it reverts back to the natural correlation that was disrupted during the February short squeeze.

USD/JPY v ES

What's also interesting assuming that Wall St. was clued in as to what Putin would say Tuesday morning, is the fact the ES 5 and 15 min charts are so ugly now, they wouldn't go negative right away if a positive divegrence was being put together on Monday and not right away Tuesday, there's no point in selling in to a gain that's not there yet, but now...


 Es 5 min which is the first timeframe I trust overnight

And ES 15 min, note Monday, early Tuesday and then distribution would be in to higher prices and demand as they are selling in size.

I think the biggest changes in character today other than a flat market with no follow through on exceptionally low volume would be the pro sentiment short term going negative, HYG going in to an unrecoverable negative and High Yield Credit going negative, these are firsts for the last several weeks and are definitely denoting changes in character that we find very useful, that's why they are among out Leading Indicators.

I'll be keeping an eye on the Yen and $USD divergences as well that are now fairly well formed and mature being that Index futures are tied so closely to the carry trades.

As far as MACRO DATA... as I mentioned last night, 2014 has seen the worst start to the year according to the Macro economic data surprise index that it has seen since the start of 2008.

Today didn't help the cause, the noisey and otherwise unimpressive ADP jobs data which I usually ignore came in at a significant miss, however considering this Friday's Non-Farm Payrolls and considering this morning's Non-Manufacturing ISM data, it may mean something.

Services ISM came in at 51.6, a miss to consensus of 53.5, but the real trouble was in the employment index component, that came in at 47.5 (under 50 is contraction) on consensus of 56.4! This was the biggest drop from month to month SINCE LEHMAN BROTHERS! Also the lowest reading since 2010.

THIS DOES NOT BODE WELL FOR FRIDAY'S NFP.

Goldman Sachs cut their NFP forecast today based on the ISM employment data from 145k to 125k, that's pretty pathetic.

Early today I said it was quiet overnight in the Ukraine and it was, however today a bevy of headlines hit and some may have some staggering repercussions. First the Ukraine notified Gaszprom, the Russian state controlled energy giant that they would not be able to pay for February's bill, they paid $10 million of an outstanding $1.529 BILLION in debt, this means their discount that puts their effective price for natural gas at $268 per 1000 cubic feet will be revoked come April 1 and they will pay the non-discounted price of $400 per 1000 cubic feet, see how long it takes the new government to go belly up with energy costs nearly doubling.

By April 1 they'll also have another $440 million in debt to the Russian state controlled energy giant bringing their debt to just about $2bn , I don't think their $10 million dollar payment plan is going to cut it.

The E Commission announced $15 billion in aide over the next two years that will be available for the Ukraine, what they didn't say was that number 1 they don't have the money, number two each EU country will have to ratify the bailout and #3 it is largely contingent on the IMF for most of the backing which you might as well say, the US as that is the reality.

However, Russia's Medvedev said they have an immediate $2-$3 billion rescue package for the Ukraine to pay their debt IMMEDIATELY... Remember when I mentioned the Mississippi land grab earlier today, well I think the Ukraine beholden to Russia for a bailout like that will achieve what Russia wants without a shot fired, to bring the Ukraine squarely back under the influence of Russia and out of NATO's prying hands, the Ukrainians might not like it much, but they'll like it a whole lot more than having no heating oil.

In addition the Russian Upper House put forth a proposal to seize EU and American company assets and property if sanctions are enacted, while Russian constitutional lawyers study whether this is legal, they were sure to remind everyone that the EU did the same thing to Russians in Cyprus, did I not say at some point this was going to come back to bite the EU in the butt?

There were a few other events like ethnic Russians overtaking a central bank, but one of the more interesting was a rumor spread by the Ukrainian Foreign Ministry that UN ambassador Robert Serry was kidnapped, however not too long after a companion tweeted they were together in a coffee shop but the door was blocked by armed local militia. In any case he wasn't kidnapped, but threatened and shortly after the UN ambassador went straight to the airport and said he was canceling his mission to the Crimea, hmm... wonder what they told him?

However, by far the most interesting development was a telephone call between the EU's Foreign Affairs Chief, Catherine Ashton and the Estonian Foreign Affairs Minister who had just returned from the Ukraine. In the released phone conversation the Estonian Minister said that he had seen evidence while there that the protestors and riot police that were shot by snipers who were supposedly acting on orders of Yanukovych were actually all the same snipers and apparently hired by the new Maidan Coalition government to usher them in to power by portraying these atrocities as being committed by Yanukovych which Putin specifically denied yesterday, now there's actual phone recording evidence of the two ministers talking about the affair and saying the people don't trust the new coalition government, ALL OF THE SUDDEN THE PLUTONIUM TEA WIELDING PUTIN DOESN'T LOOK LIKE SUCH A MAD MAN, THIS ALL COMING ABOUT A MONTH AFTER (actually 1-day before the Olympics) A CONVERSATION BETWEEN THE US Assistant Secretary of State, Victoria Nuland and the US envoy to the Ukraine talking about who will be in leadership positions in the Ukraine and who will not be, if the US is implicated in this terror in the Ukraine of mass sniping on both sides of the protest, Putin will look like an angel even though he still serves radio-active tea to his enemies.

Finally after 2 Russian Warships and a Ukrainian Warships passed through Turkey's Bophoruss Straits yesterday, an American Warship was granted passage to enter the Black Sea as well within the next two days, we're not sure which ship it is other than to say it is not the US Aircraft carrier George HW Bush. Well, that should be interesting, 3 different navies all prancing around the Black Sea during a period of heightened tensions.

I'll keep an eye on futures tonight and bring you anything that may arise, but I'd say it's pretty safe to say Putin had an agenda Tuesday that we don't fully understand and this thing is a long, long way from deescalation. why does that matter? Because the market HATES uncertainty, look how it reacted this week when it thought it had some certainty.


Trade Idea : XLF April Puts or XLF short...

I already have a FAZ long position (3x short Financials) and I'm fine with it, what I'm looking for and it would work whether you were interested in XLF puts, SKF (2x short financials) or FAZ (3x short financials) or even just XLF short... is this...

We are SOOO close to a natural and large head fake move, I'm setting alerts for this move and upon an alert being triggered, I'll almost certainly open an XLF April $22 Put position. I just hope it will trigger in time before it loses ground as divergences are setting in fast there.

 This is the main underlying trend in XLF/Financials on a 4 hour chart, distribution in to a pullback and accumulation sending it higher in to even heavier distribution, the yellow trendline is where I'm setting my price alerts, it's an obvious resistance level and as such, the more obvious a resistance level the more likely it see a false breakout or failed move/

The 4 hour chart's divergences already tell us that the probabilities of a breakout move being a false or failed move are very high, likely in the 85% area, the same as one of our first head fake trades, BIDU short as we figured out how Wall Street was playing the game and why.

 The 30 min chart has exceptional damage like the averages from the Feb run, still look how close we are to that breakout level, I can enter FAZ or another equity short with no problem here with a little rroom on the stop, but for an options position I want to buy a put in to price strength so the premium comes down and so I get the best entry, above that yellow line is where that happens.

 15 min XLF, again compare the relative divergences (even though they are leading, but this is the heart of divergence analysis no matter what indicator you are using), 3C at A and B which are nearly identical price levels shows a VERY large difference.

The 5 min chart is making me a little nervous I might not get this chance, but it's so close I can't see how it can't be run, especially with the same in the IWM and a few other averages...

*By the way, the IWM April $120 puts just moved to double digit gains.

 This 2 min chart is what is left from Monday's divergence, but as always, new divegrnces (since Monday) start on the earliest timeframes, this divergence just never made it to the 5 min charts like most averages.

 That means this 1 min leading negative is the newest divergence and obviously it's fairly strong, there are two areas, one at $22.14 which is intraday resistance above and the other 2 cents higher at $22.16 which is the long term breakout that you saw above, that is where my price alerts are set for, above $22.15 and $22.17 and that's where a put position in XLF makes the most sense.

If that were to happen, it's hard to say exactly because it looks like FAZ is holding up better than it should, but you might get something like this which may make for a slightly better FAZ entry.

A move below the yellow trendline, although for FAZ, I'd have no problem taking it here, options are different, the premium and what price is doing as well as volatility are what determine price, I need that move above to make XLF puts worthwhile.

FULL UPDATE

The head fake move I have been expecting hasn't materialized yet, but there are some signs it may be about to. Leading Indicators have improved quite a bit through the week, there are some very impressive signals and the USD and JPY are on track for taking the carry trade down and Index futures with it, I'm going to try to fit as much as I can so I can get to other things.

QQQ
 3 min Leading negative


5 min leading negative

10 min charts are putting in deeper leading negatives, some where there was none, see yesterday's 3C lows vs today's.

QQQ 30 min, this is where the probabilities have always been, it's almost like a guarantee that prices are coming down with these longer timeframe divergences, they expose the underlying trend without all the noise of intraday moves.

SPY
 SPY 10 min leading negative mentioned earlier, quite a bit of downside on this timeframe today, rather impressive.

SPY 3 min with Monday's positive divegrence we saw.

A closer look intraday at the 3 min chart has a small positive relative divegrence and a very flat, obvious resistance area, this is the area I thought we'd se taken out by about now with a negative divergence in to a head fake move, acting as a timing flag. I'm guessing this is still the scenario.

IWM
 3 min , it's important to compare to relative areas in the recent past like highs. pivots, etc.

5 min leading negative, you can see what's left to the far left of the Jan 27 to Feb 5th accumulation zone, a massive hitch-hiking position like we do.

 IWM 15 min, worse than the 10 min leading negatives.

IWM 60 min, again this is the underlying trend, forget day to day, this is telling us what happened during that move up, it is exactly as we suspected before the move up started, in fact the move up was a means to kick start the next larger trend down and the chart above was a way to confirm we were on target with that analysis, all before February 6th.

 Again the 3 min intraday IWM looks like a relative positive and a VERY clear line of resistance, that's where I expected a head fake move to take place by now and that acts as a timing flag, also an area where I'd likely be adding to any positions I'm still looking in to.

This is what the market has needed though, I've talked to several people today about FAZ as a long, what I said in all cases is "It's not the divergence that I'm concerned about in entering now (this morning), it's the reversal process, FAZ needs some lateral time to put in a reversal process and allow 1-5 min charts to strengthen and that's what today has done so far for a position like FAZ (3x short financials)...

It's the yellow arrow rounding or reversal process that wasn't there earlier and is now showing up a lot better, otherwise we would have had a very unlikely "V" reversal, this was part of what told me we needed some more time today.

$USDX
 The 5 min $USDX continues to lead negative, if the $USD falls and Yen gains, the USD/JPY falls and you've seen the correlation between the market and the FX carry trade, it's 1.0 so this chart is essentially a market negative chart.

Yen
 Last night in the Daily Wrap I said the Yen needs some time (even though it was putting together a positive divegrence) to form a reversal process and I thought it would be ready today, it looks pretty darn mature, and it's positive, again Yen up, USD down is a market negative via the USD/JPY.

VIX futures...
 5 min leading positive VIX futures with a nice mature rounding process, they trade opposite the market, it's interesting that a lot of these futures 5 min charts are on the same page.

Leading Indicators, VXX 
 I have inverted the SPX's price (green) so the correlation between VXX and SPX can be seen, once again VIX short term futures are outperforming the correlation, apparently demand for protection and this is in fairly large size at this point.

 VXX / UVXY 2 min

3 min with nice migration

5 min

And the large position mentioned in an hourly chart.

Short term this looks similar to the averages 3 min charts for a head fake move.

HYG High Yield Corp. Credit
 This is the asset used as a lever to ramp the market, the intraday chart shows distribution, I think HYG is all used up to ramp and support the market.

 A longer view shows the same on a more serious note.

This is the intraday trend of HYG, distribution as can be seen in price action.

However this is the real important chart, HYG was accumulated enough to help move the market, but that has turned in to deep distribution, the position has been abandoned so I doubt it will be seen in late day ramps or even average ordinary daily moves as a lever of manipulation, apparently they aren't willing to take the risk holding HYG any longer.

If I could find a decent April Put here and get an intraday bounce, I'd consider HYG for a Put position, as an equity short I don't like the beta, a little low for me.

FCT-pro sentiment...
 This is one of two we use, this tends to show the longer term or larger play among pros, they have not been willing to chase this rally, in fact they are going the other way.

Our second Pro sentiment indicator, but this one on a near term basis...
 HIO has quite obviously fallen out of bed with the SPX (green), this doesn't look good for the market near term, the chart above doesn't look good for the market longer term.

And of course one of my favorite leading indicators as it is so accurate in calling pivots, it called all 3 on this chart (well the 3rd is waiting) and the 3rd is by far the worst, this has been one of my favorites for a good year or more.


Yen is getting ready to make a move

That means USD/JPY will likely see down side.

Leading Indicators which I just captured are looking very strong for a downside market reversal

SCO, USO and Brent Futures (Charts)

As mentioned I do like SCO and if I felt there was a VERY high probability of a significant pullback I'd close the position just because it would be opportunity cost and then look for a new entry, I do see intraday charts suggesting some downside or a pullback, but they aren't enough to cross that threshold for me.

I think if we do get a pullback in SCO, it is VERY likely to make for a nice add to or new trading position, it IS NOT a long term position however, I have too much respect for USO's longer charts to think otherwise.

SCO...
 Remember our concept regarding high volume especially as it relates to key candlestick days like the bearish Shooting Star to the far left on huge churning volume, the body of the candle shows that price barely moved from the open to the close, but intraday higher prices were rejected on heavy churning. To the far right we have a small star that is right at or under the channel, depending on how you draw the trendlines, but the large volume even at the bottom of the channel is a bullish hint for that candle and since, as I had written to a few members, it looks like it may be going for a Channel Buster which would also probably be a counter trend rally and those usually have quite a bit of momentum.

 On an intraday basis you can see the increased volume specifically at the lower channel, it is a likely Channel Buster which also means that when it's done, it should set up a nice trade in the opposite direction.  Remember this is SCO,  2x short crude.

 As for SCO's Trend Channel and RSI (I like to use the 6 period as its more sensitive, many conventional indicators I use very long periods to reveal trends like 26/52/9 for MACD or 50-100 period for Stochastics, but with RSI (Wilders, not the Relative Strength Index), I like 6 period. You can see at the top of the SCO run RSI was divergent and has remained below zero actually 50, which is one of the 3 key components in our X-Over Screen to avoid false/whiplash crossover signals. Now we also have a positive RSI divegrence and a move above 50 in RSI as the Trend Channel is so very close to stopping out the downtrend with a stop on a closing basis at $29.09.

 This is what I mentioned in the earlier SCO post as far as intraday highs possibly being reached as the 1 min chart is going negative here, however a 1 min chart in and of itself doesn't scare me out of a position, but if I was trading a more leveraged asset like calls, I'd probably want to take the gains (or close out the position) as it's likely there's little left for today other than profit eating theta decay (time decay).

 The 30 min chart is positive too, I just think the 15 min chart shows the trend better overall from top to bottom with a leading negative divergence as SCO makes its highs and a larger relative positive then leading positive (as is often the progression with larger divergences) in SCO. Remember the concept or analogy of "How much gas is in the tank", the larger duration a divegrence or base/top, the more it can support the move expected to materialize from the base (in this case). While we can have strong positives like we did Monday intraday, it's only a day thus not much gas in the tank, however here we have nearly a month, this can support a significant move which would be on par with a counter trend rally.

Remember I use yellow to denote a head fake move, they are there a lot more often than you think, we just fail to recognize them, also note that it was one of the last things to occur before a reversal as is often the case.

 5 min SCO also has a decent positive divegrence in its own right, again note the little Island bottom head fake move that hits stops, remember the increased volume at that area, a large part of that is a stop hunt which allows smart money to pick up a lot of shares very quickly and no one ever seems to question who took the other side of the trade.

 This 2 min chart is actually leading positive in a big way, but I wanted to scale it to price so you could see the confirmation, this is one of the main reasons I haven't closed the SCO long, a 1 min divegrence is one thing, if it were through 5 min charts that would be another. It still may fill the gap, but I don't have enough objective evidence to close the position.

USO
 Note the daily USO Trend Channel with a stop on a closing basis below $36.45 as well as the same volume concept and RSI divegrence.

USO's 60 min chart shows a large positive divegrence we have been tracking for months, I think it has a lot more upside, but for now it did go negative recently along the lines of a counter trend move. Also note the two head fake areas, both were just before a reversal in trend and this is why head fake moves are so useful in acting as timing flags as well as getting the best entry and lowest risk although they are very hard to enter emotionally at the time, you just have to study a lot of charts and see that the probabilities are with you as long as you have an edge to distinguish a head fake move from a real break down or breakout, the 3C positive divergences made it clear these were head fake moves and therefore tough, but awesome entries.

 Although there are other negative USO charts, I didn't want 25 charts, I skipped ahead to 5 min which is also showing a head fake move with a negative divergence to confirm it making this an ideal area to short USO.

 While the SCO 1 min chart and the lack of a negative on a 2 min chart give me some comfort in holding the position, USO's 3 min positive is the reason I have to keep the gap fill scenario in mind, this also means that if that happens, there's a nice entry for those who may like the trade but didn't have an opportunity to get involved.

As I'm big on pointing out, note the reversal process for the timeframe, it looks like it should, there's a difference between a reversal process which is what we see 90% of the time and a reversal event which is much less frequent, usually "V" shaped reversal events are on information that Wall St. had no way to discount, take Putin's 180 about face Tuesday morning although Monday's charts seem to make clear someone knew about this, however it is these kinds of events that cause reversal events and they are fairly rare.

Crude Futures
 Here we have a 1 min positive in /CL (Crude futures), it's really not enough to swing me on the very short term, however what is more important to me considering the size of the SCO positive divegrence is the 60 min Crude futures...

This in line uptrend going negative and leading negative is why I think SCO or USO short is a trade that will last more than just a few days or a week or so, I think it can be a trade that last several weeks with some breaks along the way, therefore I value the position and don't want to give it up based on some 1-3 minute charts when the potential and probabilities of the position are so appealing.