Tuesday, June 30, 2015

DAILY WRAP

This obviously is not all of them, but a good sampling. I think one of the main pieces of evidence were our expectations for today from last night's Daily Wrap,
"Everything is pointing to a 1-day oversold condition in which a bounce or next day green close is highly probable, however in the current situation, it  would seem some small 1-day reversal process such as a Doji or Star candlestick would be in order and perhaps with that, a positive divergence."

That would be this closing candle...
This meets the Star candle criteria for the Daily chart as well as a Tweezer Bottom and a Harami Reversal (or inside day).

As for the divergences, you've seen them throughout the day, but here's a run down ...
 SPY 3 min
IWM 2 min.

I obviously thought the IWM looked better. The speculative call position here is the most minor of trades, I'm really looking for some upside to re-open the QQQ puts closed yesterday, the VXX calls closed yesterday, maybe TLT calls and we'll see with USO.

HYG-High Yield Corp. Credit is the first lever they'll pull in trying to support/bounce the market and today's gains in HYG were confirmed if not better.
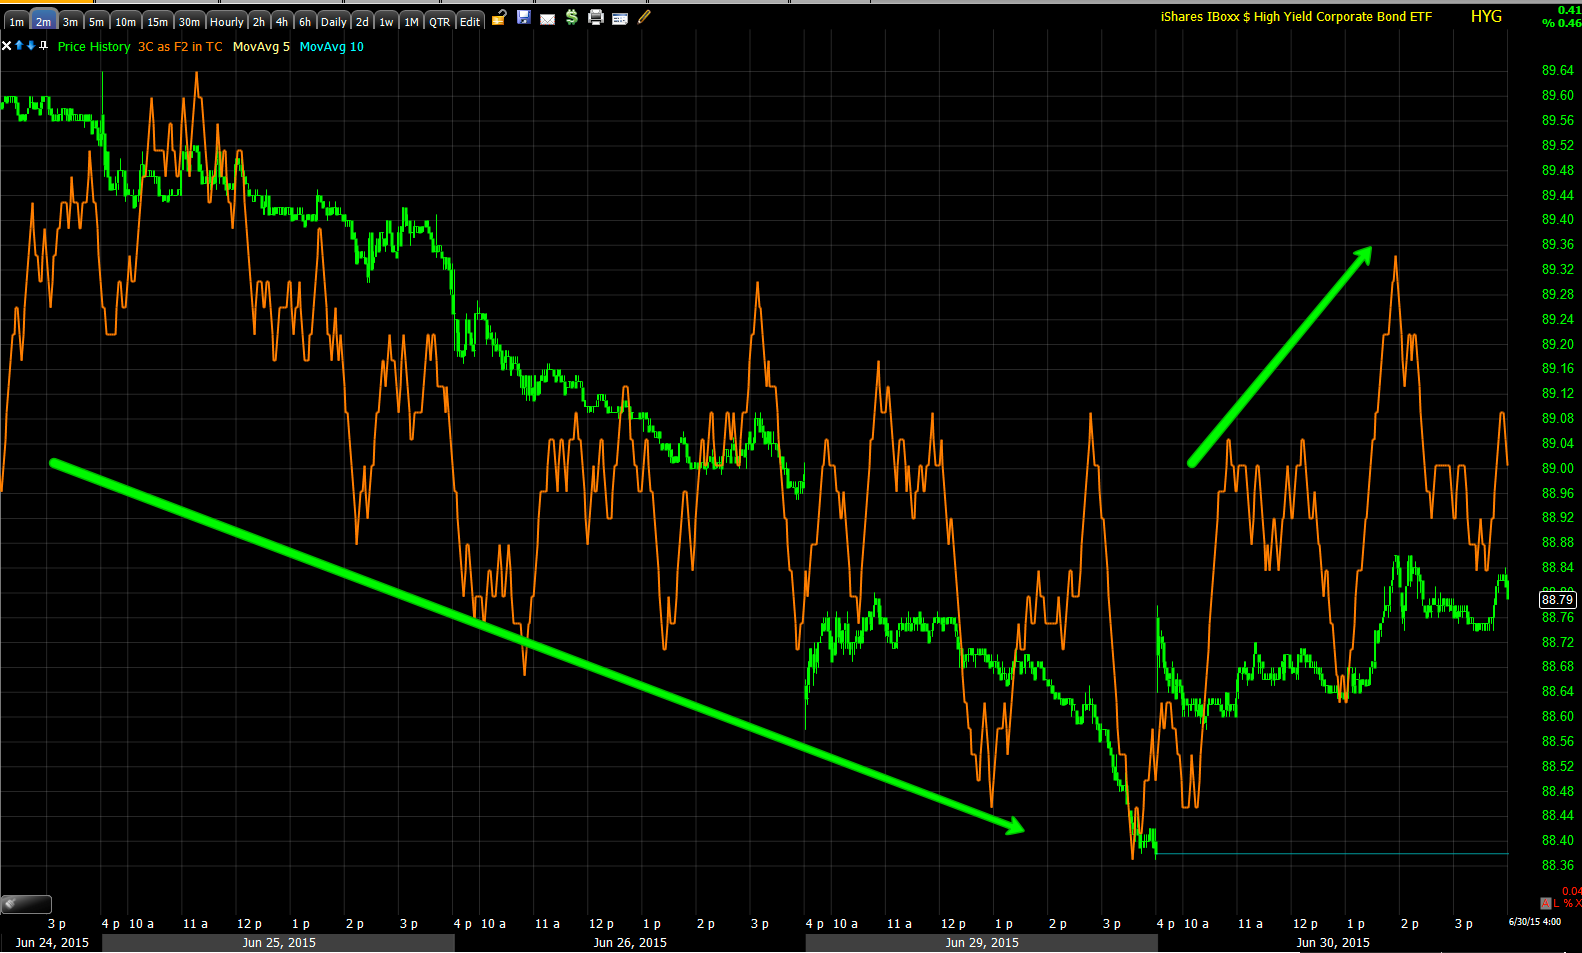
HYG 3C chart in line, maybe a bit better on some timeframes.

As for Leading Indicators...
 Our custom SPX:RUT Ratio showed several intraday divergences vs. the SPX, but closed strong.
 The main signal from Leading Indicators that we don't see very often, but has an excellent track record is our VIX inversion indicator (white = inversion), this is on a 15 min chart showing signals yesterday and today.
This is on a daily chart of the SPX and you can see where past inversion/buy signals (white) have led to bounces.
 The Pro sentiment Indicators that have been leading the market lower since May are slightly positive for the first time in probably just about as long.
 High Yield Corp. Credit is leading the SPX as I showed above, it looks like that lever is being pulled for market support as is the norm.
And High Yield Credit which has also been severely leading negative vs the market is positive as well.
Between Leading Indicators, short term oversold conditions, the reversal process and reversal candle put in today with 3C positive divergences, it looks like we'll get the bounce that we saw hints of yesterday which is why we took QQQ put profits, VXX call profits and several others. Basically we closed all of our leveraged, time sensitive trades while leaving our core / trend positions in place and we'll be looking to re-open those leveraged/options trades in to some price strength as the underlying tone for the market is where we expected it with the slice through the SPX's support yesterday at the 150-ma as we have expected.
Biotechs in particular look like they may offer us a nice second chance entry.

Yesterday we closed out our crude/USO July put, Closing Out USO July 17, $20 Put for a +26% gain, USO Follow Up and Update. As the previous update showed, there are some charts that may be just transitional in nature and may come back down in underlying trade toward our intermediate term goal of a larger pullback in to the base's range (approx. $16.50-$20), but with July 17th coming up and the charts a little fuzzy, it made sense to take the gains off the table. As for the USO equity short, it is still at a +5% gain and will be left open until I feel pretty certain that these charts are more than transitional noise.

Speaking of Crude, the last 4 weeks we have been rallying in to or just after the Tuesday 4:30 p.m. API inventory data and then selling off in to the 10:30 a.m. Wednesday EIA inventory data. API just came out a little bit ago and surprised after 8 weeks of inventory declines, API registered its first build of 1.9 mn bbl. The reaction in crude futures...
api
Oil futures reaction to API.
Even though the USO near term charts were a bit positive as seen in today's update, there was an interesting bout of distribution in to the close which makes me wonder if we are getting inventory data leaks again...
u 1
USO 2 min chart in to the close going negative. Tomorrow I'll update USO again after the EIA data comes out, perhaps today's movement was a gap fill and we actually do get the anticipated move lower in to the longer term stage 1 base's range.
As for Index Futures, being we fulfilled the events expected in yesterday's Daily Wrap, I'd expect a bounce tomorrow as today served as the reversal process for yesterday's 1-day oversold condition that usually ends up with a bounce, I reiterate this is not expected to be anything more than a bounce and should be used as such to enter new positions such as the new QQQ puts (or perhaps SPY/IWM) and VXX calls as an example. Core shorts remain in place and will remain in place as the next major event for the market should be taking out the October lows.

Index futures right now look like this...
eurusdEUR/USD has been pretty flat since Merkel's "NEIN" this morning to the proposed Greek 2 year ESM bailout, essentially throwing all rumors to the side and all possible last minute deals until the Greek referendum on Sunday July 5th or unless the referendum is cancelled, but being it's past 5 p.m. EDT, I would think that Greece is now in default on their June IMF payment of $1.6bn Euros with the EFSF also running out today as confirmed earlier.
Which reminds me of the misguided well intentions of the "Crowd-funding movement" who said enough of this Troika bickering, "We're going to take matters in our own hands" and raise the $1.6bn euros Greece needs and they were up to $100,000 euros as of this morning, the problem being is Greece needs $1.6bn Euros to make their June IMF payment which is now past due, to really raise the money the campaign seeks to raise to get Greece out of trouble, that $1.6bn figure needs to be re-adjusted to $275 billion Euros. Well it was well-intentioned and did pretty well for 1-day, just missed the mark when they did the math.
es 1ES/SPX futures intraday are about in line as you can see above, although as posted earlier, the 3 and 5 min charts which I consider necessary for any bounce and for even the shortest term trade, are positive.
Beyond that, things are pretty quiet right now, but I suspect we'll soon have news of Christine LaGarde informing the IMF board that Greece is officially in default. Given Merkel slammed any possibility of any deal making before the Greek referendum this morning, I don't see rumors having the same impact as they did the last month or so, which would give the market a nice peaceful little area to pull off its oversold bounce, but who knows, it is the EU and if there's one thing they are exceptionally good at, it's bungling the unbungable.

If anything should pop up before I turn in for the night of import, I'll bring it to you.

Have a great night.

Just Took a Quick Look at Leading Indicators

Again they are middle bullish, but for the second day our VIX Inversion buy signal has posted another signal, this has been extremely accurate, thus the IWM calls along with some better looking charts in to the close.

Entering VERY Speculative IWM July 17, $125 Call

VERY SPECULATIVE

Quick Futures Update

This is NOT an affirmation of taking the trade mentioned as a possibility in the last post, Market Reacts to Suspension of EFSF, this is simply a view of Index Futures, ES/SPX futures specifically.

 ES 3 min positive divergence.

Usually a 5 min chart has to have a divergence in Index futures before I'll even consider a trade in the direction of the divergence.
Above we see the leading negative divergence in ES on the 5 min chart at the red box. You may recall yesterday in the cash market, price reverted down to the 3C 5 min chart's divergence and for a brief period was in line (green box), this is an area where it's more likely that we have a transitional moment such as a bounce from a 1-day oversold condition. Today you can see a small, but real 5 min positive divergence. This is not as strong as I would usually require for a trade and the conditions from the last post which to me would indicate the market is ok with bouncing despite nothing happening re: a Greek rescue until after the referendum on Sunday have not been met as of yet nor would I expect them to be so soon after the move lower, but I thought I'd throw these charts out there, especially as a follow up to price's reversion down to the leading negative divergence and how that can often open up a transitional moment.

Market Reacts to Suspension of EFSF

Who can explain the gyrations of the market? I suspect there's a bit more to it that's a bit less random than it seems, but in any case, the European Financial Stability Fund has confirmed that the Greek bailout expires today... the reaction to these things seems to be best seen in EUR/USD...

 Earlier EUR/USD this morning...

Close up after the EFSF confirmation ending today, meaning no more anything for Greece, at least not until either the referendum scheduled for July 5th is cancelled, assuming the Greek government has the finds to even carry out a vote or until the referendum is cancelled as European leaders would love to see as it seems they are more afraid of the referendum/Democracy than anything.

I set alerts about 30 mins ago for the Q's and SPY to come down, if they do so as they are now and there is stronger evidence for stronger divergences, I "may" consider a VERY short term bounce call position in QQQ, SPY or IWM. I doubt that I'll take such a speculative position, but as it seems nothing will happen until after the referendum, if the market puts in a stronger divergence on this news with prices coming down, knowing nothing will happen until after Sunday, it may be worth the risk as the risk should be less as nothing will happen in Greek talks until after Sunday and if the market is still fine with bouncing knowing that, the wildcard risk is somewhat diminished. I'll of course let you know before engaging in anything this speculative.

TLT-Volume Does Matter

And will continue to matter more and more as the F_E_D's market distorting intervention grinds to a halt.

Once again, objective evidence from earlier today caused us to close the TLT call position at a near +50% gain, Closing TLT July 17th $117 Calls - Looking to Re-open at better price and the reasons why weren't because we had a near +50% gain and were afraid of losing it, they were objective, TLT Follow Up / Update.

Since then, this is what has happened in TLT...
The warnings in volume as well as the 3C charts have turned TLT to the downside as we exited right near today's intraday highs at the red arrow. The 3C chart since the last TLT update today has taken a very obvious short term turn for the worse which should allow us to re-enter a new position, better suited to our goals while booking nice gains. The TLT calls that we closed out for a +46% gain would now be worth +26%, a loss of +20% on the position in just 2 hours.

As the F_E_D normalizes policy more and more, volume analysis will be more and more important and there are very few traders left that believe in volume analysis or know how to conduct it. You just saw evidence of its value today with a +46% gain vs a +26% gain.

Market Update-Oversold Bounce and NOT Letting Emotions Derail Your Trading Plan

I think sometimes we abandon the larger picture in an emotional panic for very short term jiggles in the market and lose good positioning, good gains and great opportunities.

Today on an intraday basis we have a small example of what I'm talking about. Yesterday during market hours I took several actions like closing QQQ puts, closing VXX calls, USO, etc. based on the price action and the probability of a 1-day oversold event and then I showed you leading indicators with one we haven't seen trigger in a while, our VIX inversion buy signal in yesterday's Daily Wrap.

Earlier today I even posted EXACTLY what to look for on a daily candle basis and in the 3C charts from last night's Daily Wrap, that excerpt can be found in today's earlier, Market Update***. At the time this was posted, EVERYTHING I was looking for last night for a reversal process on a 1-day oversold event was in place and then things went south today and probably caused a little panic...

 SPX intraday today looks ok at #1, looks good for our scenario at #2, but then looks like things may go wrong with a lower low and break down at number 3, then before you know it, we have an even stronger case by number 4. Watching the intraday trade too closely today might have led you to some emotional panicked actions that were not among our highest probability outcome.

As of now, we have an even stronger case for a reversal process and a short term oversold bounce.

 The daily SPX 500 chart with a Doji daily candle today, also a Harami reversal as the candle's body is inside yesterday's or what is called an "Inside day" in western vernacular and thirdly, a "Tweezer" bottom reversal with yesterday's and today's intraday lows creating the bullish reversal candle pair called a Tweezer Bottom. In essence, we have an even stronger confirmation of the projection from yesterday.

As for the 3C charts which were the second part of what we'd be looking for today in addition to a candlestick reversal signal of which we now have 3 strong contenders...
 That move to intraday lows gave us a stronger accumulation area on the 1 min intraday chart as you can see at the lows.

There's more migration of the divergence on the 2 min chart as well.

And migration on the 3 min chart which should be plain to the naked eye as it is jumping off the chart.

However we don't want to get emotionally carried away in the other direction either and keep the big picture in mind, the 3 min chart's trend...

And while the 5 min chart is seeing migration/strengthening of the short term positive divergence, along the lines of the reversal process and oversold bounce which I want to use to re-open new QQQ puts, VXX calls, and perhaps several others, the 5 min chart's trend remind us that any price strength on an oversold bounce should be used to sell in to or short into.

The basic point I'm trying to make is don't abandon your objective evidence too quickly because of some very short term movement that "seems" to go against it. In this case, it actually strengthen our case for an oversold bounce with all of the conditions we were looking for today and then some!

The market may crash to new lows if something big goes down in Greece, but unless you Technical chart reading skills include fortune telling, there's nothing you can do about that. We play the probabilities, as I said in this morning's A.M. Update-Default Day

"It will be tempting today to take positions in a bet or gamble based on rumors as to how this whole bonanza in Europe will turn out, perhaps a long position looking for a relief rally on some rumor. I WILL NOT BE ENTERING ANY POSITIONS WITHOUT EXCELLENT OBJECTIVE EVIDENCE. This is NOT a time, it's never a time, to make bets in the market, go to Las Vegas for that."

TLT Follow Up / Update

I just closed the TLT July 17th $117 call position at a decent gain,


The P/L came out to a +46% gain on TLT calls.

Again this is a July 17th expiration and I'd like to re-open the position at a better price on a pullback with a longer dated expiration as well as having the opportunity to confirm accumulation in to any pullback. 

The TLT charts themselves look pretty darn good, however some of the 30 year Treasury futures don't look quite as good which is all the more reason for me to protect the gains, look for a better opening and longer expiration and have the objective evidence of accumulation of a pullback which is one of my favorite trade set-ups as you are entering at a better position, but you are under no obligation to enter the trade if the charts don't confirm our expectations of accumulation through a pullback, giving us evidence of continuing bullish tone and letting us chose the time and place of the figurative "Battle".

Once again to get the big picture idea of the trade set-up, see the original Bond Rally / Swing and to understand the Channel Buster Head Fake move, please see  the post above and for more details on Head Fake moves including Channel Busters, see:

Understanding the Head-Fake Move... How Technical Analysis Went From an Asset to a Trap

and

Understanding the Head-Fake Move... Motivation

Here are the TLT charts.

 TLT Daily chart channel buster or trend line in this case. Friday's lows were a head fake/stop run (yellow arrow) on increasing volume,

However despite today's intraday 1min chart's confirmation, look at volume on the move., it's falling off through the day, not very inspiring near term when you have a near 50% gain that can be wiped out in a day.

 Here's a closer look at volume on the intraday chart today.

The ZB/30-year Treasury futures intraday chart also didn't look good intraday going from confirmation to a deep leading negative divergence.

The 2 min chart in TLT also went from a relative negative divergence to a stronger leading negative divergence so I didn't feel now was the time to take chances with calls expiring in a couple weeks.

 3 min chart showing the head fake accumulation on a stop run and a negative divergence in to the price gains short term.


The stronger 5 min chart shows the head fake/stop run below former support which saw increased volume and a nice positive divergence so near term, I'd expect a pullback in TLT in which we can use it to confirm TLT's short term accumulation as well as get a better entry and longer dated calls.

The 10 min chart shows the same and looks good for the bigger picture.

As does the 30 min chart.

And even though I wouldn't expect it for a counter trend move, even the 60 min chart has some decent positive divergences.

The Treasury futures charts don't look as good, but the futures' timeframes are much faster and more temperamental than here in the cash market so they may very well be reflecting the pullback I hope and expect to see that allows us to re-enter a new position with a longer expiration while locking in nice gains in the mean time, allowing us to do it again, but with confirmation that the pullback is accumulated.

Since starting this post or at least since posting the closing of the position, TLT's price chart has gone flat, opening the door to a downside pullback. I'll be setting price alerts below as a reminder to check out the charts in looking for a new entry/position, no different than the QQQ puts yesterday or VXX calls yesterday and perhaps even the USO puts.

Closing TLT July 17th $117 Calls - Looking to Re-open at better price

Market Update***

The latest is an offshoot from an offer made yesterday by European Commission President Jean Claude Juncker, probably the least trusted man in Greece (Schaueble, the German Finance Minister likely being the most hated man in Greece). Apparently after Juncker's emotional plea yesterday which can be seen here he sent a proposal without Troika approval which , it is said, the Greek government rejected, then it was said they were considering it again this morning and would submit their own proposal.

That proposal was submitted about an hour ago in which Greece asked for a 2-year bailout via the ESM mechanism, Financial debt restructuring and all within the Euro. The immediate response was Merkel shot down the proposal, you can see it here in the trade of the EUR/USD...
Merkel shoots down Greek proposal.

However moments later, Greek press conferences and various EU engagements were cancelled all at the same time for "Emergency meetings", so it seems there may be something going on. Then the head of the Eurogroup, Dijsselbloem announced on his twitter feed,


This being Europe, events are moving faster than you can type, the EU leaders who apparently are VERY AFRAID of democracy at work have called for the cancellation of the July 5th Greek referendum, saying that talks can resume quickly IF the referendum is killed and that the airing of the Greek proposal can happen only if the referendum is cancelled.

OK, so the rumor mill, the news is insane as expected so we'll continue on with what we see in the market from sources that have much better information than we do.

Last night in the Daily Wrap I said:

"Everything is pointing to a 1-day oversold condition in which a bounce or next day green close is highly probable, however in the current situation, it  would seem some small 1-day reversal process such as a Doji or Star candlestick would be in order and perhaps with that, a positive divergence."

Thus far, looking at the SPX daily chart, guess what...
We have EXACTLY that, a Doji Star/Harami candlestick pattern, a reversal candle/pair just as forecast last night based on the simple concept that reversals are a process, not an event and based on the fact we had no positive divergences yesterday, but a deeply 1-day oversold condition. So the second half of last night's post/excerpt from above are the divergences...

 SPY 1 min positive divergence through today as highlighted on the time axis.

SPY 2 min chart seeing migration or strengthening of the divergence through today once again as yesterday was in line with the downside.

We even have slight migration over to the 3 min chart, but once again, to keep things in perspective...

The 3 min chart zoomed out and the divergence is barely noticeable, that's because that's about the appropriate size for 1-day oversold condition's bounce.

On the 5 min chart, we have a very ugly chart that represents the highest probability/path of least resistance despite any 1-day oversold bounces no matter how strong they might be and that is quite obviously, DOWN.

I could show the QQQ and IWM, but the charts are nearly exactly the same as the SPY above.

The intraday TICK has been between + and - 1000 with a few spikes above and below that range.

And the custom TICK indicator shows a little breadth improvement.

All in all, this is pretty much exactly what we expected yesterday and the reason puts in QQQ were closed, calls in VXX were closed and I am looking to re-enter both positions on some price strength, but before we get that, the conditions as set out in last night's Daily Wrap as posted from an excerpt above, take shape which they are doing now.

As I said earlier, I wouldn't be interested in trading this long unless the signals were unbelievable, the reason is the path of least resistance is also the path that the market will follow if there's any uncertainty in the Greek situation, essentially the smaller/shorter term divergences are much more likely to be run over than the longer, very negative ones. It's not a matter of probabilities because the probabilities say a bounce is probable, it's a matter of a High probability trade, an excellent entry, LOW risk and decent reward ratios. That doesn't exist right now.

However for the moment, we are EXACTLY where the charts pointed to yesterday.

USO Follow Up and Update

Yesterday I closed the USO July 17th $20 put position, Closing Out USO July 17, $20 Put. The idea was to take the puts' gains off the table and let the USO equity short (+5%) carry on for now, but once again options have different dynamics effecting price than just underlying price alone.

The P/L from yesterday's closure of the USO puts ended up looking like this:


The P/L came out to a 26+% gain, today that would have been barely above breakeven.

As for USO itself, it's important intermediate charts are changing character and a pullback deeper in to the base area under $20 is looking less likely with the more recent change in the charts. I'm leaving the USO equity short in place just to make sure these aren't transient moves, if they continue to strengthen, I'll close the USO equity short and start looking at the next trade which would be a USO primary trend long, or at least that's what I expect.

Charts...

 Just when USO breaks below the triangle at the base's upper resistance trend line and on volume suggesting stops were hit, the charts seem to be changing.

I've expected a break lower in the the base area around $16.50 to $20, then to see the base finish work with large positive divergences and switch positions over to a long term, primary trend long position.

 USO 1 min intraday looks to be pretty much in line as does the CL 1 and 3 min Oil Futures (Brent) charts.

 This 3 min USO chart is leading positive at yesterday, a good reason to close puts that expire this month as the time decay eats away at gains. However this isn't a concern as far as the bigger picture I've been expecting.

Remember tonight is the Crude inventory API data and tomorrow morning the EIA inventory data, both of which have been a sort of good cop/bad cop recently ramping in to the API and selling off on the EIA.

The USO 5 min chart is nearly identical to the 3 min chart so this is strong confirmation for near term trade and a good reason to close the USO puts yesterday and preserve those gains.

It's around this 15 min chart that I see changes that are a bit bothersome as this has been the chart suggesting USO pulls back deeper in to the base area. Note the recent change to the right, although not a leading positive divergence it is a change in character.

 The 30 min chart which has been the most spot on as far as previous/historical confirmation, still shows a negative tone so I'm waiting to see if the 15 min chart's recent tone migrates to the 30 min chart before making any decisions on the USO equity short and certainly before deciding to consider a primary trend long position.

As for Oil futures, these are Brent so there's a slight difference between Brent and USO which is WTI crude, but in the past they have held the big picture together.
 While the 1-3 min charts are in line with price, this 5 min chart, like USO is leading positive, the thing that causes me some caution is the bulk of that leading positive divergence happened in the low volume of overnight trade.

 The 10 min chart shows the same, also in the low volume overnight hours primarily.

These charts weren't part of my concern yesterday.

However around this 30 min chart, the negative divergence that had been supporting my view has turned positive to the far right.

 As well as the 60 min chart which had also been supporting my view of more downside.

This is a close up of the positive area on the 60 min chart above this one.

So I'm going to remain a bit patient, but I'm not very hopeful at this moment. The charts have not gone definitively against my expectations, but they sure look like they are moving toward that direction.

As far as the longer term primary trend long, this is the CL/Oil futures daily chart. You can see the H&S top and distribution last summer leading to the slide in prices and then a positive divergence and lateral trade like a stage 1 base. That saw a bounce out of the base just like USO and still reflects a divergence suggesting a move back in to the base so all hope as far as expectations is not lost, but that's not the reason I post the chart. The reason is, before I would enter a long term long in oil, I'd want to see this daily chart show a much stronger positive divergence than we currently have at the far right where there's still a negative in effect.

More on USO as it develops.