Friday, March 1, 2013

You Won't Believe This

What did I just say about the Q's in my last post? I'm going to leave that to you.

I went to one of those calculators that figures the Max Pain, where the asset would have to be pinned to put the most number of cash valued contracts at a loss.

Here's what the calculator spit out for the weekly expiring today...

The level of max pain, $67.50!!! The section to the left shows how many calls/puts were out, orange are puts so to make money you'd have to had overcome the premium, transactions costs, etc and be below $67.50 on the put side.

On the Call side, you'd have to do all the same and have the price above $67.50.

Lets look at the QQQ today.
Other than the early gap down, which most options players who hold until expiration are hoping to hit a lotto ticket and that the Q's will head lower, they never did so those put players would be caught with worthless options, the close was $67.41, but most people are hounded by their broker by 2 pm to close out the positions. The range highs for most of the day? $67.47, three cents aren't going to make those options worth anything.

The VERY HIGH of the day was $67.50 and it was only there briefly so $67.50 calls... worthless. 

And that's how an options expiration pin works, the house wins 90% of the time, we did pretty well though.

That's #18 of 983 and a fairly decent return, most hedge funds didn't do that last year, but it's been hit and run, hit and run, taking singles and doubles and not getting too crazy trying to swing for the fences. It just goes to show, there's a right tool for every market.


Futures

Based on the 5 min chart of the Futures we have been using for our signal, there are no new futures (actually QQQ/IWM/SPY) weekly trades.

NQ intraday still looks horrible which I imagine it would if you had to lift price to pin option contracts you wrote so you would not have to pay up, but rather make money, while at the same time having the ability to use higher prices to sell in to as I did with GOOG today.

 ES futures 1 min leading negative in a flat range, hmm why do you think it's so flat?

NQ/NASDAQ futures intraday leading negative divergence and deep, again, very flat, the Q's expiring just under $67.50, I wonder where max pain was?

Adding to GOOG April $810 Put

It will now be 75% intended size.

This may be of interest

As they rarely do at the time, this 3C signal makes no sense; with the VERY dovish Japanese PM, Abe and the board of governors he nominated for the BOJ (Japanese Central Bank) leadership, to think they will do anything other than try to destroy the Japanese currency is almost impossible to believe.

Why coud we possibly have a signal like this? I didn't know at the time, but saw this happen with the $USD and found out several months later and after the move in the dollar (which we traded as we took the signal) the reason; it happened with oil, it happened with the change of management at RIMM and tons of other places, it makes no sense, but it's here.

 It's no coincidence that the market is dead flat on an options expiration day, but the same could be said for the Japanese Yen futures and the market being dead flat.

 Here they are on a 1 min chart with a positive divergence, that's short term not good for the market, but the market and futures will be closed soon, still someone is positioning for something involving the Yen higher near term, which is bearish for the market.

 The 5 min chart shows a huge positive divergence in the Yen, again, it makes no sense, but there it is.

Even a 4 hour chart has a huge leading positive divergence, someone is betting big on the end of the trend in the Yen and it moving higher, killing a number of FX carry trades, forcing liquidations in stocks.

Remember to compare, compare, compare.

The Game is Afoot

Really quickly, my gut feel is this price action is more than just the weekly option expiration pin (which never use to be an issue), my gut feeling is something is going on. VIX futures are higher, the spot is lower (tip of the hat Japhy), as we see VXX/UVXY higher-they're based on the VIX futures not spot and futures are bid.

There are a number of individual stocks that give me the feeling this isn't over yet and although I was just about to fill out the GOOD April Put, I held off because of that. Believe me, there are still very negative signals and damage that has been done that is astounding, we're not even talking about anything that large, we're talking about timing or tactical.

I see credit is down from the gap this morning, but intraday is making some moves higher, not close to a leading positive signal, but interesting for tactical reasons (talking about a day, maybe less typically).

Of the (3) FX pairs I mentioned, EUR/USD is taking a break like the market, so is EUR/JPY, but AUD/JPY looks to be turning lower. The Yen itself is no longer heading lower supporting the market, but is flat, the $AUD is losing ground (negative for the market), which between the $AUD and Yen, explains the move in the pair (AUD/JPY). Although intraday the dollar is leaking gently lower, it gapped up today which helps explain the market's gap down, but not the market's price now, which again is ahead of all correlations which means manipulation.


The model ES is worsening as the differential expands again between ES and the CONTEXT ES model.

Yields are down and not buying what the market is selling, commodities are not inspired.

It seems to me something in the realm of manipulation is taking place beyond option expiration's max pain pin, which is manipulation in and of itself which we apparently saw last night budding.

The new Dow high has never been far from my mind since I mentioned it and its effect on retail, I'm just writing thoughts as they pop in my mind, but that is among them.

The point is the fleeting glimpses have all bee toward large positioning for a nasty market event, the short term has some signs that are not VERY obvious, but can be found if you look around enough that we are not done with this volatility zone.

However beyond the deterioration in risk assets and what has been said about currencies, most of that is gut feeling. I'm going to keep watching for hard evidence as the last hour of Friday seems to produce some signals, I assume it's because most options contracts are closed by now.


Correction re: volatility

I said there was nothing remarkable about price, I guess the VIX being down -1.35% while the VXX is up +1.59% and UVXY is up +3.29% and XIV down -1.74% is remarkable.

GLD

GLD is looking interesting here, all of the same positives that started the April $150 call are there and some nice fresh intraday ones.


Fleeting Glimpse- Volatility

There's something known to professional traders or anyone who has spent enough time watching the market, every once in a while you get a big hint in a very fleeting glimpse, usually so much so that if you were to look back on the charts say after you got home from work, you might never find it.

One of my biggest fleeting glimpses that is most relevant to the market since 2009 and since QE3 launched on September 13th of 2012 and EVERYTHING that has come out of the F_E_D and sentiment that it has created subsequently came at 2:26 p.m. on September 13th 2012 during Ben Bernie's press conference, this set the tone for everything I thought would happen with the F_E_D since and it disturbed the market a great deal ever since as you might recall, QE3's announcement created about 6 hours of rally.

It was a question asked of Bernie, I just was lucky enough to be listening and watching the market's response, it had to do with QE and inflation and the whole dynamic added to F_O_M_C statements, "Within the CONTEXT of PRICE STABILITY", because before that the F_E_D never gave a poo what inflation QE created. Bernie answered by saying that they would make adjustments to the size and composition of the purchases if inflation became a problem and for the first time since 2008 the market had its first, "Conditional QE", that answer marked the high of the day and it only got worse from there. The F_O_M_C also talked about changing guidance from date driven which is sure, to economic data driven which is unsure, then they started talking about whether QE was appropriate in the minutes and it has continued from there as the F_E_D is signaling they are considering their exit, which is another first for the market since QE started.

In contrast, this isn't such a big deal, but still likely a fleeting glimpse.

As you know, for the most part, volatility (VIX, VXX, UVXY) moves opposite the market, the move in volatility today is unremarkable, so are the following charts...
 VXX 1 min has positive divergence where you'd expect and moved as you'd expect, today there have been some small intraday ones causing the movement I;d expect, nothing more, it's unremarkable.

 UVXY is the same way

 The 5 min chart of VXX or UVXY or XIV looks a lot like this, green arrows mean price is moving in concert with 3C, there's no divergence, that's what today shows, nothing bad, nothing good, just unremarkable.

Then out of nowhere...
 The VXX 3 min chart goes strongly leading positive today

 I checked UVXY, it did the same.

I even checked the inverse XIV, it did the same. Why all 3 did the exact same at the same time seems to me as if there's only 1 reason, someone is making a move.

When large orders need to be filled they are broken up in to smaller orders so the predatory HFT's don't find "an Iceberg" and front run it, which is one of the most costly things for hedge funds and institutional traders. Of course they don't want the general trading public knowing either for the same reason.

It would appear to me that 3C in this timeframe with the same look-back period caught one of these chunks going through.

If so, remember, that's positive for volatility which is negative for the market.


Market Update: Speaking of Tools

In this update are at least 1 or two others... Not looking great here, I think I'm going to be looking in to some shopping in the area, GOOG made a nice move.

 The ES intraday negative divergence is worse, it's clearly leading negative now.

 If it could get worse, believe it or not it did, the NQ intraday chart

 Using TICK alone, this isn't matching up well with the SPX trend is it, breadth is falling apart. This is one of those tools.

 SPY vs TICK with a linear regression trendline.

SPY intraday negative divergnce is worse as well.


And so are risk assets everywhere as CONTEXT moves to a deeper differential between ES and the model

3 Pairs to Watch

Most of this is based on the yen so if you can't pull up FX pairs in real time or don't care to, you can always watch FXY vs the SPY, as long as FXY is falling, the currency is supporting the market, as long as these 3 pairs are rising, they are supporting the market.

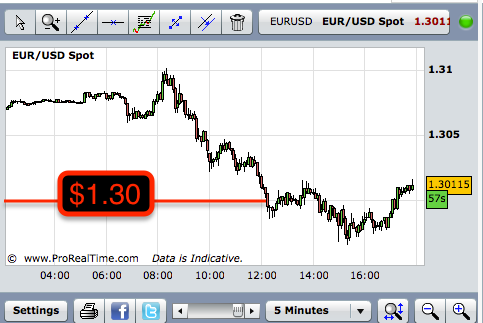
 The EUR/USD, less because of the correlation and more because of the stops that would have been run at <$1.30 and how the $USD reacts which has so far been losing ground.

 EUR/JPY- typically there's no one Carry Trade, but the spread the risk out in a basket, the Yen figures prominently in that basket.

The AUD/JPY.

Just another early warning system you can put in your tool box for now.

WAY POINT: EURO $1.30 XXXXX

Just because it's important psychologically, I would think there's some kind of bounce after hitting stops , but I'm not sure it matters to the market as the correlation was broken to the negative side a while ago, I do think this is what caused all of those negative divergences everywhere as it happened around the same time...
 ES was just one of the negatives...

 I'm just noting how they've kept the volatility up and reminding you of how many times I have warned that once the Trend Channel is broken, there may be additional gains, but that's if you play it perfect and I never find it worthwhile as the volatility makes those small extra gains VERY dangerous to go after, it's like 80% is easy money with 20% risk and 20% is hard with 80% risk, the 80/20 rule.

 The Euro vs. the SPY intraday

 The Euro vs the SPY on a daily basis, as I said, the correlation of these two moving together as risk assets is broken, it use to be so tight you could tell what the market was doing by looking at the EUR/USD.

 We first started tracking trouble in the Euro a while back when the very first lower highs/lower lows were in place, this trend is unreal in how clean it is.

 Today the Euro broke the psychologically important $1.30 level, so much for Goldman's call for $1.40

Here's the daily trend line in the pair

Important Market Update

Important ones usually don't have charts because I need to get them out fast. Every major average and the SPX and NDX futures are now negative on the intraday chart, I need to look some more, but this is suggesting a possible reversal, if not that, then weakness, but this is where I really want to sell price strength before we lose the opportunity

GLD Update

I've had several emails about GLD today so I figured I'd just show you what I've been telling you.

First of all I'm not making any changes in the April $150 Calls, this is one of the reasons I opted for a longer expiration, there's a chance this is bigger than we think.

Here the SPY is green and GLD red.
 30 min chart, I've noticed more and more in recent days that Gold and the market have had an inverse relationship moving the opposite direction of each other, you can see it wasn't like that earlier this year, the trend recently seems to be something like that, but I really don't know if that is just coincidence or not, I've seen the relationship flip flop several times over the past several years.

 On a multi-day 1 min chart you can see the inverse correlation between the two, but the last couple of days it has been even tighter.
There are a few areas this doesn't hold true, but for the most part it does, today the market is up a bit and GLD down a bit.

 Intraday the 1 min chart is following price almost exactly so there's nothing wrong with that, the 1 min trend is leading gold/GLD so longer term it's bullish, today it's neutral.

 The 2 min chart showing recent positive and negative divergences and it's currently positive

 5 min chart is very positive with a leading divergence in what looks like a probable "W" base.

 The 60 min chart hints at the same, thus the longer expiration.

The history on the gold Futures (YG) is not as long as my other charts for GLD, but the 60 min chart here too is leading positive.

So I have no problems with GLD today.

Quick Market Update

This certainly seems to be manipulation, but it is missing even the smallest traces of manipulation like small intraday positive divergences. I don't know if that means the locals don't want to have any money on the table at all or what, but it's interesting and fits well with the leading indicators and the view that today is a tactical gift like yesterday.

We did have that accumulation last night as I mentioned in the post, "One More Time", who knows, I can show you what we have now.

Using the SPY as an example...

 There's no positive divergence at all on even the fastest of timeframes, the 1 min chart, we have a bit of a negative here that has pulled back as it should on that signal, I don't see why it can't move a bit higher, but it does seem to have a roof.

 The 3 min chart would be interesting as well to see what's in the middle between 1 and 5, again, no positive divergence, not even a hint of one at the lows/reversal and more importantly there's some larger damage being done this morning.

 At the 5 min chart and this is why I say there seems to be a roof on this, there's nothing but damage, no hint of anything positive today or otherwise, leading at a new low. This is the kind of market I want to sell in to or short in to.

 I figured maybe the DIa would be different if they were going for the Dow headlines, but again, no sign of the smallest positive divergence and if they were taking it to new highs for the head line and to suck in retail over the weekend, there's no reason they wouldn't take a small position and ride it.

 DIA 5 min also leading negative at a new low and no signs of anything positive.

 QQQ 1 min is the closest to a positive divergence, it would be a weaker relative positive, but truthfully it's not even that as it would have to be flat, not sloping down.

QQQ 5 min also no sign of anything positive and hitting a new leading negative low in to some price strength, a gift tactically.

One More Try.... ? / Leading Indicators Speak

As was asked in last night's post, One More Try based on some Futures movement...

"This could be nothing (although I doubt it), it could be the start of a move for an options expiration pin or it could be that new Dow high I think Wall St. would love to have, especially on a Friday, but there's some movement in futures."

In any case, whatever it is, it doesn't bother me, I think yesterday and today are shaping up to be key tactical days.

Leading Indicators are quite interesting, especially when it comes time to pull the trigger on some trades that are emotionally difficult to pull the trigger on like a put against a rising GOOG today.

First some of the lesser known, but still useful indications...
 HIO High Income Fund was moving as it should with the SPX, but then a big divergence and a smart one, why risk money in a market that is lateral and volatile, still a useful signal.

 Yields are like a magnet for stocks, the longer term view of Yields in a deep dislocation.

Today Yields dropped quite a bit on the open and intraday they are diverging from the SPX as well.

Credit
 HYG is in line to the left near term the last couple of days,  but this morning saw a nasty gap down.

 It's also diverging intraday even from that gap down.

 Junk Credit does the same as HYG, it's doing the same, gap down and everything.

 High Yield Credit was moving down with the market as they should, but it has no interest in following the SPX north.

 The $AUD with a long term positive divergence before the SPX even bottoms in November, now a nasty long term negative dislocation.

 Intraday it's lagging the SPX.

 The typical risk driver, the Euro is also lagging the SPX intraday, but worse...

 On a longer term basis, this is a big red flag.

 Interesting the market is up despite the $USD being up intraday here too, again, it goes back to last night's post and the truth about the market, they want to move it somewhere for whatever reason in the short term, it doesn't matter what the dollar does, short term as in "One more try".

 The Yen moving down is more or less good for the carry trade which is more or less good for the market, but something has been changing recently in the Yen that can cause a lot of trouble to the highly leveraged carry trades which in turn effects the market negatively.

Intraday however, I don't know if they Yen or the SPX came first on this move, but they are in the right correlation for the move, the only currency of all above that is.

Bottom line, this looks as I said last night, some manipulation, whether op-ex, Dow new highs or something else, but I see it as a tactical gift.