Monday, November 28, 2011

Closing Trade

I'm not sure if there was a sugar rush rumor in to the close or just algos trying to jump start momentum in to the close, however, credit make me very comfortable and if  had time I would have used closing trade to add to shorts.

Look what credit did in the final minutes of trade vs the S&P

Credit sold off to new lows on the day, which is signifiant, even more so is that it gave up all gains on the day.

The late day push was on a small positive divergence on the 2 min chart, which has been leading negative all day (below).


The 5 min chart was throughly unimpressed as it continued making new parabolic lows in a strong leading negative divergence.


It appears that today we finally got an opportunity that we had been looking for. Any further upside would be appreciated so long as the internals stay weak like they were today, however if today is all we get (and I did mention there was a gap from 11/23 that could be filled), well then hopefully you were able to take advantage of what the market offered today,  did.

PEIX Update

PEIX is a C&D trade that many members have made a lot of money on and have been eager to re-enter the trade on a pullback. Just last Tuesday I updated PEIX and said that it had NOT pulled back to where I expected and urged caution and patience and wait for a proper pullback before entering this trade.

It turns out, that was good advice and we still may get a decent entry.

Here's the original and current long signal, still a good entry reduces risk and increases probabilities, we bought the first pullback to the 10-day yellow moving average and saw a 100+% run, I said the next pullback should be deeper and close to the blue 22-day moving average, the pullback to the 10-day simply wasn't deep enough. As you an see today, PEIX lost over 6% and 3C is confirming the move down. Perhaps somewhere near the blue moving average accumulation will build and we'll get another 100+% move up. PATIENCE PAYS!

Credit/Risk indicators confirm

 Commodities

 The Euro

 Financial momentum

 High Yield Credit

 High Yield Corporate Credit

Rates

All started falling apart much earlier then the market.

Some Model Portfolio Positions

In the last post I showed how rapidly some of the 3C timeframes were falling apart in the SPY/S&P. In confirmation, I took a look at several of the model portfolio positions and found that as fast as 3C is falling apart in the market, it is gaining momentum in the Model Portfolio positions which are largely inverse ETFs.

Here are some examples.

 EDZ Short Emerging Markets 2 min is leading positive.

 EDZ 5 min is strongly leading positive, the opposite of what we saw in the SPY/S&P

 ERY-Short Energy 3x 5 min leading positive very strong.

 ERY 10 min, strong leading positive.

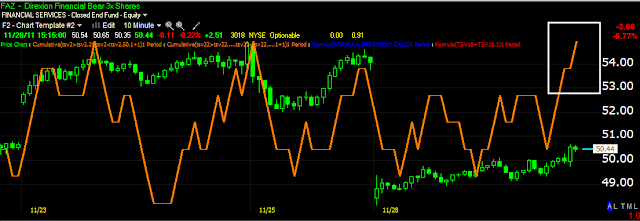
 FAZ 3x short financials, leading positive 5 min

 FAZ 10 min

 SDOW UltraShort Dow-30 5 min, exceptional leading positive divergence

 SDOW 10 min

 SPXU UltraPro Short S&P-500 5 min very strong leading positive signal.

 SPXU 10 min

 SQQQ UltraPro Short QQQ 2 min leading positive

 SQQQ 15 min very strong

 SRTY UltraPro Short Russell 2000 1 min chart leading positive.

 TYP Technology bear 3x 1 min leading positive

 TYP 5 min leading positive

 Even my long positions, UNG 2 min is looking like it is turning around to the upside with a strong 3C signal.

As well as URRE on a 30 min chart!


Market Update

I'm still very happy to have added to my shorts today.

Here's the SPY and it appears to be falling apart at a faster pace.

 SPY 15 min, not only negative, but now hitting new leading negative lows.

 Here on the intraday chart, volume jumped as the most obvious support level was breached.

 The 2 min chart couldn't even confirm today, even worse, it has been leading negative all day.

 The 5 min chart just fell apart very quickly to a leading negative position and is virtually moving straight down right now, it would seem that distribution of this gap up is very heavy.

The 10 min chart shows the same speed of deterioration as the 5 min above.

Bottom line, everything seems to point to today being as I had hoped for, a good opportunity to start and/or add to short positions on some strength.

Traders Flocking to the Safe Haven Trade-Treasuries

Treasuries and the market have an inverse correlation, when the market is up treasuries are usually down and when the market is down, traders flock to the safety of treasuries, which is why today's action is not only unusual, but seems to be an indication of things to come as almost every metric we have seen today show this gap up as a weak move and thus an opportunity to consider entering shorts on strength.

 Here the SPY still is holding, albeit laterally, to this morning's gains, however, treasuries in red, "should" be holding near their opening lows, instead they have rallied all day and are now in the green, completely at odds with the normal correlation and seeming to indicate that traders, the smart money ones, are preparing for a "risk off" environment or in plain English, a market move down.

 Here's TLT since the opening gap down, it has rallied all day in to the green.

 The 3C TLT 1 min chart, unlike the SPY chart is confirming the strength, showing both a positive divergence on the open as well as confirmation on the move up and a leading positive divergence currently.

More importantly, the 5 min chart is leading positive, even above treasuries recent highs when the market was falling last week.

NYSE Short Interest

NYSE Short Interest is out this afternoon and if you are short, it's good news, short interest fell to a 3 month low!

Why this is good news? Having shorts in the market is actually good for the market and helps prevent massive crashes, as the market moves down, shorts will cover and take profits, when they cover they are buying and providing some support to the market, however, when those eventual buyers are not there and the market falls hard, there are fewer shorts to take profits by covering/buying and thus there is far less support for the market during a decline, making the delcine even worse.

USO Update-Possible Trade.

USO has finally made it to the original upside/bounce target that I was looking for. While I am a little skeptical of adding to my USO short because of geo-political events in Syria, 3C shows a pretty bearish outlook for USO which has me considering adding a small quantity of additional short positioning, I will continue to hold my USO shorts already in the model portfolio.

 Here's the daily USO bearish Ascending Wedge that broke and the small red trendline which was the original bounce target, which is more or less, a "kiss the apex/wedge goodbye bounce".

 On a 60 min chart, the target has been met, it is offering some support and there's a small gap below, a move below the yellow gap area should confirm the probability of the reactionary bounce being over and the next leg down starting.

 My daily Trend Channel/Stop sn't even close to being stopped out today.

 Bollinger Band which were also used to estimate a bounce target have met that target at the upper bands, since USO has fallen to the median, a move lower will also be bearish.

 The 2 min 3C chart shows distribution on the open and a slight bounce intraday.

 The 5 min chart shows the same.

The 10 min chart is clearly negative, especially at today's gap up open.


 The more important 15 min chart is even more bearish with a leading negative divergence and a horrible negative divergence on today's gap up open


The long term 60 min chart continues to look bad.

If you can deal with the geo-political uncertainty, you may want to consider a USO short via USO short or long SCO/DTO.


Market Update-More Confirmation

I loaded the Credit/Risk indicators and as 3C and CONTEXT suggested, there's a dislocation between the S&P and risk assets broadly, which for me, makes for a good short entry point or add to point for current short positions.

 Commodities (This is a broad average of commodities) are taking a plunge and really more in line with the Euro, however if this was a strong risk on rally/bounce, commodities should defy the Euro as the S&P has done this morning, since they haven't, it signals to me a weak bounce and thus a good opportunity to consider adding to or initiating new shorts.

 Here's the dislocation between the S&P and the Euro, which typically trade in lock step with each other.

 We saw this earlier, momentum in financials is definitely falling behind momentum in the market, this is not a good sign, especially for the financial heavy S&P-500.

 High Yield Credit has also dislocated from the S&P and is now selling off.

 High Yield Corporate Credit is doing the same. You can see the current dislocation to the right and a recent on to the left, notice what happens to the S&P right after a dislocation like the one to the left, it plunged the next day.

The market not only follows credit but rates as well and they are leaking lower, you can seem in virtual real time how the S&P is following rates lower.

Given the 3C charts and the confirmation in the risk/credit layout, this does look like the opportunity many have been looking for to use some strength in the market to short in to.