Thursday, April 14, 2011

Large Caps in AH

As you know I'm not a huge AH fan or indications, but I can't but notice that the averages regained lost ground after GOOG, yet the large caps seems to be still underwater-remember the BGZ trade in which we were to use any pullback in BGZ (strength in the market) to get your feet wet in the trade if you like it.

Interesting that large caps are not keeping pace with the AH recovery, just makes the BGZ trade look all the better.

Some intereting market behavior

The market dipped a bit in AH when GOOG missed, but GOOG doesn't seem to be having the impact one might suspect as the market has regained some lost ground in AH, furthermore, our last market update showed some consistency in positive divergences, I don't know if this has to do with BAC tomorrow a.m., but rock, paper, scissors (GOOG vs BAC), it doesn't really add up, so it seems like something else may be in play, what that is, I don't know yet. Like I said in the market update, the accumulation has been of short duration, but we can't rule out the possibility that it's just started, which would make for a very interestingly volatile market as earnings continue to most likely come in worse then expected, but something behind the scenes may want to push the market higher. There's dozens of possibilities I could rattle off both semi-bullish and bearish. For the time being though, there is that positive divergence that developed today and GOOG came in short on earnings as did JPM and AA, both of which have been crushed since reporting. So it may very well be ( at least in the short term) a stock pickers market.

Don't get too worked up one way or the other though about what I just said, we have 1 day of presumed accumulation and 3 major stocks that have blown earnings and we haven't even really gotten into the heart of the margin squeeze stocks yet. In any case, as we saw with GOOG today, I think you need to be ready to move fast. Check out the video on GOOG at Trade-Guild, the volume on that EOD move up was incredible, they really socked it to a bunch of retail. I don't think I've ever seen a stock as big as GOOG reverse character so quickly throughout 15 min charts, but with the volume that was flying around, I can see how it was possible.

GOOG Misses in one of the most amazing last minute distribution cycles I've seen

It looks like GOOG missed on EPS, earnings are embargoes with news outlets so it may have been there was no leak in GOOG heading into earnings until an underling at a news outlet got ahold of the embargoed release. I've never seen distribution this quickly, through all 3 versions of 3C all the way up to the 15 minute chart.

This was yesterday's theory, but today was extremely difficult to verify it. It's well know that Wall Street trades the close, this was an aggressive move up that was negatively divergent everywhere you looked.

 1 min

 5 min

 10 min this chart is interesting because until the last divergence, from the $574 low, GOOG was trading in line (confirmation)

 15 min and this chart, the explosive price move at EOD didn't tick 3C up even at the very last zig after the end of the red arrow

 1 min -after the 3pm negative divergence, GOOG again was in confirmation, that aggressive move up couldn't budge 3C even close to confirmation.

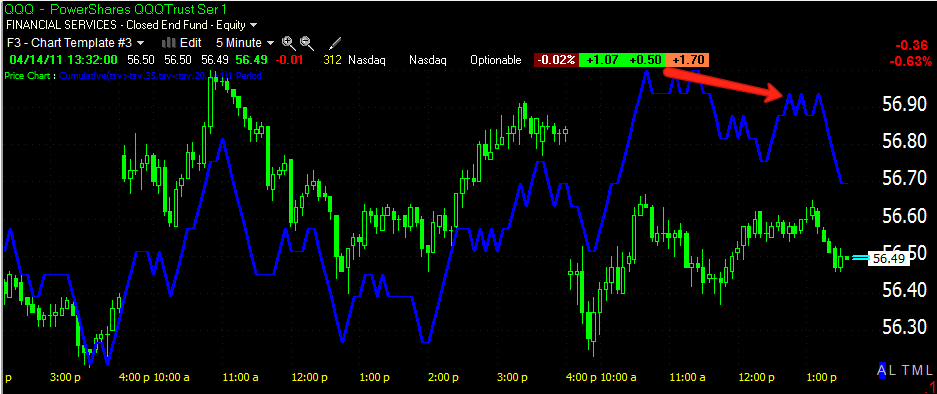
 5 min The large red arrow shows the bigger divergence, but more interesting is the small red arrow that was totally negative into a pretty extreme price move. I suspect some last minute buyers, buying that price action really got left holding the bag.

 10 min again, it didn't even budge so there was aggressive distribution into this late day move up.

 15 min the small arrow on the 15 min chart ticked down on this move up in price

 1 min

 5 min

 10 min again the 10 min didn't budge on such a heavy price move.

15 min and the more important 15 min ticked down.

This is one for me to keep in the scrap book, I've never seen such an aggressive price move so thoroughly and heavily distributed into with so much confirmation.

Now, to see what the plan is for BAC tomorrow. The market has had some reaction, not too bad, except the Q's which looked the worst in the last market update.

GOOG

The only thing of real note today in GOOG has been some very recent late day negative divergences in all 3 versions of 3C in 4 timeframes, it's very recent.

MArket Update

Now I'm seeing some confirmation. These are the charts for the DIA, QQQ and SPY in 1, 5, 10 and 15 minute format. I'm getting the same impression as I got with BAC, there's positive divergences, but short in nature.

 DIA with a slight negative  1 min

 DIA 5 min in confirmation

 DIA 10 min in confirmation

DIA 15 min in confirmation

 QQQ slight negative

 5 min QQQ a little stronger then confirmation

 QQQ 10 min negative

 QQQ 15 mi negative

 SPY 1 min negative

 5 min in slightly better then confirmation

 Positive SPY 10 min divergence today


SPY 15 min positive divergence today.

Again, these aren't huge positions and suggest perhaps some early strength in the a.m. Jobs data is out as well tomorrow so that could be a bit of a wild card after today's strange number.

BAC

Tomorrow a.m. BAC reports before the open, there are some interesting charts here.

Below are the 1,5,10 and 15 min 3C charts for BAC, all positive, but interestingly, all pretty much positive only since yesterday, mostly today. This doesn't suggest a large position was accumulated and if I had to guess, I'd guess it would be a similar event to JPM with Wall Street spinning earnings into a pure "Headline" beat. Remember, JPM beat in the headlines, but for those who read the report, EPS were up on falling revenue, there were accounting gimmicks to produce the beat and later JPM fell, but the point wasn't to do anything more then gap the market up, what happened to JPM later was irrelevant. We could be seeing the same in BAC, otherwise why not accumulate a bigger position?


SLV Chart Request

 SLV just turning negative on the 1 min which is to be expected after a 3+% gain today

 The 5 min chart showing the same

 The 10 min chart, which is part of the new cycle up is in confirmation so it seems that SLV will just see a corrective pullback as was suggested yesterday (GLD having bigger problems, SLV just a correction)

And SLV broke out of the resistance level so it also makes sense to see a pullback here.

Market

I intentionally left out update, the truth is, I'm having a darn hard time determining what is going on today. there's signals here and there and then where I expect to see confirmation, there's none. This raises one possibility, that no one knows what GOOG's earnings will be and that may be why the market looks so disjointed.

There are a few observations that make some sense, but none have enough confirmation that I would feel comfortable making a call on them. Perhaps into the close, we'll see a burst of confirmation. 3C picks up on the quiet underlying action of smart money and I know from years of looking at this, there are plenty of leaks, but not everything is leaked and when there's no leak, there's no strong 3C signals. In those cases, I just look for the next stock. Google is a big market fulcrum, it's possible that there hasn't been a leak there, or it's possible that there is known information that may be offset by another release like say BAC's in the a.m., this is one of the toughest market days I've had and frustrating as well.

As soon as something breaks here I'll bring it to you.

Market Update

I can't decide if I'm baffled or this is what I expected, I think I need to take a good long look at GOOG. Here's the market.

 DIA 1 min leading negative

 DIA 5 min negative.

 IWM 1 min leading negative

 IWM 5 min negative

 QQQ 1 min negative

 QQQ 5 min negative

 QQQ 10 min VERY negative

 SPY 1 min leading negative

 SPY 5 min negative

SPY 10 min negative.

This seems like a continuation of yesterday's selling into strength, which causes me to think about GOOG reporting tonight, which is a biggie and could easily take the market down hard.

So, I suspect what we are seeing is short selling into strength, the same thing I advised a day or two ago.

PMs update

 GLD 1 min with a slight negative divergence

 The 30 min chart shows the problem for GLD, I still believe SLV is stronger and GLD at this point is in a simple corrective move to the upside, but my mid-term expectations are for either outright downside or volatility within a zone, bouncing back and forth.

 SLV is being difficult today, the 1 min chart doesn't tell us much right now, it could go into a leading divergence if it keeps moving up.

 The 5 min chart has fallen behind and is in a relative negative divergence

 The 10 min chart is still in confirmation. A basic explanation would be that it can still survive this and move higher if that 1 min chart gets more positive as the 10 min hasn't failed yet.

There is a 15 min negative divergence, but I suspect part of that is left over from the last down cycle (4/11-4-/13).

USO Update

USO 5 min leading divergence. It's rare to see a leading divergence into higher prices, meaning accumulation is happening even into a rally.

 We see the same thing here on the 10 min chart (and these charts just a few days ago were headed straight down).

USO 15 min leading divergence

 And even on the 30 minute chart, it seems accumulation is being accelerated.

I still believe there's a decent probability that this will still be the zone in which they try to accumulate shares of USO, we're seeing a little pullback right now. This is why I said yesterday to start building a position if you like the USO trade idea.