Friday, March 18, 2011

Quick Market Update

Mission accomplished! $129-$130 Calls on the SPY were pinned today-the reason 90% of options expire worthless.

Now for the end game, as I mentioned earlier, I think we may have or most likely will see an up day on Monday, possibly that will be the "scary" head fake.

 After keeping the SPY in check for options expiration, we're seeing some late day accumulation, I assume for a move up through $129 on Monday as options expire worthless.

So far we have distribution on the 5 min chart. If it bleeds into the 10/15 min charts on Monday, then our bounce should be over. It my take until Tuesday, we'll have to see what 3C says next week and see how the markets react to world events over the weekend.

Quick Update on USO.

USO looks like it could see a little more downside on Monday, however any events in Libya over the weekend could change that outlook quickly. Today USO hasn't shown a great deal of commitment to a downside move, I believe it is reacting to the PBOC's RRR hike today as speculative money is being drained in China. I don't see anything yet to change my mind that USO should go on to make new highs above the March highs.

There's quit a bit of accumulation in USO since the reversal call on Tuesday and it should support new highs for the month. In the meantime, a pullback here and there is totally normal behavior.

GLD/SLV

So if you remember, we were looking at bear flags in GLD and SLV-both bearish consolidations. Earlier I showed an email in which I had said I'd expect a false breakout from the obvious flag pattern and it seems that is what we saw today. Both are looking bearish still, but slightly different. SLV appears to maybe have another day in it, GLD appears it is close to or is done.

 GLD 1 min chart has gone into a leading negative divergence, not a very sharp one, but it's still there and volume today has been noticeably large and red.

 The 5 min chart looks very similar

 As does the 10-min chart

The 15 min chart is leading negative, I'd say probabilities re this is the false upside breakout of the obvious bear flag and GLD is done or just about there, possibly Monday it puts in a day that is similar to today in the same price area before tumbling down.


 SLV, unlike GLD has had a strong afternoon suggesting there's perhaps another day of upside in store on Monday.

 However, the mid term charts are bearish with slight leading negative divergences, so it looks like there's been distribution into today's gap up and note how SLV didn't do anything beyond the gap up further strengthening the idea that distribution has been underway into the gap up.

The negative divergence hasn't reached the 15 min yet, but it's on the 10 min. Note the price pattern of a continuation triangle, this will suggest to traders that SLV will move up on Monday which it may very well do. However, I'd be watching for the bulltrap on Monday. Both charts still have a longer term bearish outlook and this is just the market doing it's thing, taking advantage of traders who refuse to adapt to the changing dynamics in the market.

CCJ Chart Request

CCJ is in the nuclear energy sector so it was hit hard recently with the bad PR for nuke companies.

Over the last week or so, it's fallen by about 25%.  This is part and parcel of the market's pendulum effect.

The downside event and volume associated with it is reminiscent of a capitulation event meaning all those who wanted to sell, sold, but usually that is after a prolonged sell-off so we are dealing more with a knee jerk reaction. Still, the oversold condition sets the stage for a decent bounce, whether it be a dead cat bounce or whether the company returns to more reasonable valuations. Today's candle pattern taken with yesterday's, forms a Harami Reversal in Japanese candlestick charting (that's slightly ironic) and suggests an upside reversal.

 However, as you can see by the daily 3C chart, distribution in CCJ started sometime ago before Japan. There was a 7 month uptrend so the size of distribution (remember the point is to sell into higher prices) seems about right. So irrespective of a bounce, there are some problems with CCJ and it was headed down anyway, it just got there  lot faster after Japan.

 Remember I mentioned the 2-day candlestick reversal pattern (Harami), so seeing accumulation on the 15 minute chart yesterday and today isn't surprising, it's exactly what I'd expect to see on an ideal chart. Furthermore, 15 min divergences are about where we expect to see 3C based reversals.


 The 10-min chart is confirming the last two days of accumulation as well.

The accumulation period here is rather short so this points to a bounce, not a sustained recovery at this point. Still, for those of you who have the risk tolerance for this kind of trade, there seems to be an edge there and I'd guess that it would take 3-4 days to distribute the position, so we could see a decent bounce here. Longer term, I probably wouldn't consider this stock as a position trade.

Regarding Japanese Sensitivities and the Rift Between Nuclear Scientists and Japan

Earlier today I wrote about the trade in EWV and the sensitivities of the situation in Japan and how the government obviously wasn't being entirely truthful with the people. It seems the imminent arrival of independent assessment teams has caused Japan to finally start to come clean.

BROWSING CHARTS

There's really no better way to get a feel for the market then browsing through charts. I try to look at several hundred a night. I just took a quick browsing break and noticed something that may be relevant.

First of all we know that the market acts like a pendulum, it swings too far one way and then too far the other. Secondly today is options expiration, there's a chance that a price level is being pinned, if I had to guess, I'd say $129 on the SPY-$129/$130 have heavy open interest. Finally, as I noted at the start of this bounce, "it's likely to be scary on the upside move", that's a big part of why we see these violent bounces; to shake out traders and get better positioning for the next move down.

Looking at the SPY today, here's what we have...
 Some decent looking 3C action has developed into the afternoon, but still not a major threat to $129.

A bit longer on the 5 min chart, it's starting to enter the distribution cycle. The 10-15 minute charts aren't there yet and 15 minute is where reversals most commonly occur when the negative divergence shows up there.

Taking all of that into account, I looked at probably a couple hundred of charts and noticed, while many don't look good (and I'll be compiling a list and charts for some of those this weekend for next week), there are some heavy hitters or bellwethers that just aren't showing the kind of distributive action I'd expect to see before a reversal. Here's a list of some of them as I started writing them down after noticing how many of the bigger stocks weren't deep into distribution.

I'm not saying I think these are buys, I'm just getting across the point that if we were very close to a reversal (like today), I'd expect these to look a lot worse and many still look good, meaning they are not deep into the distribution cycle.


INTC
F
MCD
RIMM
ADM
GOOG
ORCL
DELL
C
GS
IBM
COST
JCP
BEN
YHOO
WMT
GE
AMZN
DD

As you can see, they are important stocks and a pretty good cross section of the market.

So the point, news still rules, but I am of the opinion that today's action has more to do with options expiration and there's still room for that "scary" move up.

Also understand we are talking about very short term action here, the bounce, not the intermediate or long term outlook which is significantly damaged.

So Much for the Ceasefire

Gadhafi is one strange bird. I saw a video in which his personal security forces were all women. I have nothing against women in any position they wish to take up, but an all woman force seems a bit strange and for whatever reason, reminds me of the Eunuchs. Then of course his insistence that Al Qaeda slipped the youth of Libya hallucinogenic drugs and that's who they are fighting.

Today is another example of how off the wall this guy is, a seemingly brilliant ceasefire announcement was promptly followed up by the shelling of the city of Misrata killing dozens of civilians.

In any case, I suppose the ratings this weekend on CNN will be quite high as folks tune in for the aerial bombing camera footage.

More from Retuers

TSM Trade Idea (long)

A subscriber mentioned TSM, I don't know much about the company's technical capabilities, but as the subscriber mentioned, it's possible they may take up some of the slack from Japan.

 At first glance the chart is ugly, but recent events may cause a turn around.

 In approximately the same timeframe as the Japan crisis, TSM has sen a strong 10 min positive divergence

 The 5 min chart today just went into a leading positive divergence, this runs counter to most of the market averages-at least 3 of 4 so there's some 3C relative strength today.

Unfortunately 2.5 days is as far as I can go back for 1 min. historical data, but there's been a positive divergence the entire time and I suspect before the 2.5 day chart above as well.

I think the highest probability trade is a long order at $11.92 with a stop at 11.30.

This may become a very interesting trade.

Trade Alert, EWV long

EWV is a leveraged inverse ETF on Japan. Because the events in Japan could in no way be discounted by smart money, it's not likely they had any meaningful position in the ETF when the quake hit. EWV did respond with a major knee jerk reaction move up, but just as we saw with oil when events in MENA started to unfold, institutional money will eventually bring EWV back down so they can accumulate a position. It's clear there's a lot of confusion about what is happening in Japan and given the culture, it's not surprising to see the rift between US nuclear experts and those in Japan. Obviously I think US experts are less biased as the Japanese government has to deal with panic and try to calm the country as much as possible. Thus we have seen many contradictory statements arising from different Japanese agencies and the US having a much more dire take on events.

In any case, EWV has pulled back, accumulation appears to be present and I believe that smart money has taken up a position and is close to letting it rise once again.

Here are the charts. I do think this is a trade worth your serious consideration, even if only for a swing trade.

 EWV goes ballistic on events in Japan and since has pulled back, much like oil did while the controversy in Egypt raged-at the time, it made no sense considering the implication for oil with a Suez closure. However, smart money isn't going to let a position take off and make tons of money without them having a piece of it.


 The crossover screen has all 3 signals for a long, but more importantly, it has pulled back to the typical area for a first pullback after a big move, near the yellow 10-day average.

 Here the 5 min chart shows positive divergences

 As does the 10 min.

I saved the 1 minute for last as I believe it is showing the market maker, specialists and HFTs now taking on stock for a move up. This divergence is occurring into a relatively lateral trend which is where we typically see them as they try to establish a low and stable cost basis.

AAPL Bounce-maybe not

AAPL hit our downside target recently and showed some early signs of accumulation, however the advanced components made in Japan that go into several key Apple products such as the I-phone are now in short supply and the status of factories in Japan is unknown. What is known (as of my last check) is that ports in Japan are shut own, meaning the raw materials that they need for manufacturing aren't getting to factories even if they are open. Japan is a country that has few natural resources and depends largely on the rest of the world to import raw materials for the advance components manufactured there.

AAPL is one of the first I've seen and know to come from Japan, but as I pointed out in my XLK post, technology stocks aren't looking good and Japan's situation may be the root behind that.

Here's the latest on AAPL which is in a very dangerous position technically speaking.

 AAPL very close to breaking any remaining support. Remember that this is a stock that nearly every fund owns. Should there be a mass exodus by funds, the manipulation of top patterns is of very little concern. Once a major fund starts liquidating, they will all follow suit as we recently talked about in the herd mentality of hedge and mutual funds.

 Here's the last 2 days in AAPL, yesterday seems to be when this problem started being discounted as AAPL saw distribution into the local highs. This morning's gap up was hit by a negative divergence and right now is resting near some support, some of the last support before it breaks the top completely.

 The 15 min chart is just as alarming with a leading negative divergence. In fact the 30, 60 and daily are all negative as well. If  was managing a fund, I'd be using any strength to short this stock ahead of the hedge funds as they have massive positions. They need to liquidate a bit more slowly as to not drive prices down too fast. That being the case, I would give an AAPL short serous consideration. The parts manufactured in Japan cannot be rapidly set up in China, these are advanced technologies that China imports to assemble I-phones.

Here's last ditch support and the trend channel stop that will hold a major trend, it held the September 2010 trend up and just stopped out on 3/15. I'd consider adding a larger position below $325.

This is what I believe is coming-NKE

We have been talking a lot about the manufacturing reoirts, many of them with positive headlines, but digging into the reports, there has been a consistent theme, that of rising input costs There's only so many ways to deal with rising input costs, to absorb them which hurts your EPS, to try to become more efficient, which generally leads to lay-offs or to pass them along to customers-usually as a last resort.

NKE reported earnings last night, but what really disturbed the market is that NKE has reached the action of last resort, to raise prices across the board. On a macro basis, this can lead to stagflation as prices rise and consumer demand drops, we have perfect breeding grounds for stagflation.

I expect as more and more companies have grappled since July with rising material costs, many are reaching the option of last resort.

Here's what it looks like when it arrives.


The fact is, there's no easy solution. The Federal deficit requires that the debt ceiling be raised unless we are willing to lose all credibility and default on our debt. Which means the Fed must keep easy money policies in place, which leads to speculative inflation-the kind China is moving against right now as they continue to hike banks reserve requirements in an effort to absorb excess money. The US is in the opposite situation in which we continue to flood the market with cheap money which fuels speculative bubbles.

This is but one example, but as earnings come in and companies are forced to the measure of last resort, you can see what the consequences will look like and the threat of stagflation will only multiply the bearish effects in the market. This is a large part of why I believe we are near a stage 4 decline in the market. So my strategic plan is to keep adding to short positions that look good and decrease any exposure to long side risk, while keeping cash on the sidelines, ready to deploy at a moment' notice.

I believe NKE is a preview of what is coming down the line for the market.

Updated Market Analysis

Remember that our bounce was called to the day, but it hasn't been strong in terms of 3C backing, I've mentioned that yesterday. So this morning we talked about the possibility of the locals re-establishing their positions, the other option is the end of the bounce which we are also on the alert for. Here's how the action is shaping up.

 DIA daily chart and the next resistance zone. Typically before reversals we see that false move, it would likely be into the resistance zone if it came.

 The DIA so far has been the best acting as far as 1 min confirmation goes.

 The 5 min though looks a lot worse, remember that the action filters through to the longer time frames and around a5 minute charts, when we see a negative divergence we are usually near or at the actual reversal.

 IWM daily resistance, a higher high today would form a bear flag, so far we have an odd pattern which is a bullish ascending triangle, I believe this to be a random pattern, their success rate in a down trend is VERY low.

 The IWM hasn't pulled back much to fill the gap, but there is distribution evident on the 1 min chart; it's also starting on the 5 min chart as well.

 The Q's in the same pattern as the rest of the averages, resistance is near $56

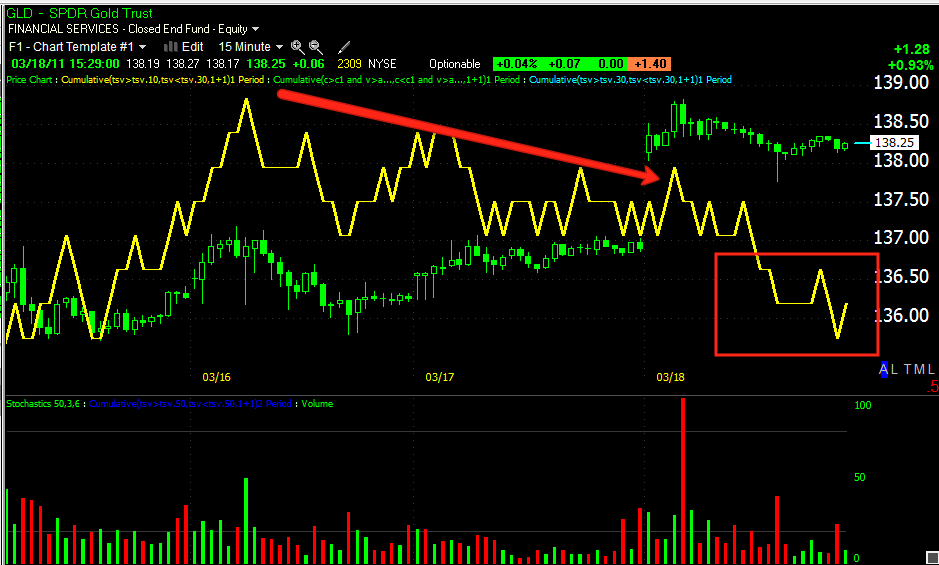
 The Q's have backed and filled (this was opton 1-that trader would re-estblish positions let go of last night near the same area, however, we don't have any accumulation as of yet, so we could be looking at option 2 in which the bounce may be ending. Before the market was heavily manipulated by black box pattern recognition patterns, the daily chart would look very much like a reversal. However, now the new reality is the patterns are manipulated.
 The Q's 5 min chart looks negative as well. The opening gap was sold off heavily.

 The SPY daily resistance zone

 Here we have the SPY at least in confirmation at the green arrow. However, there seems to be no sign of option #1

The 5 min chart is deteriorating.

So now we watch for the 10 and 15 to show signs of negative divergences and we may have an actual reversal at hand. This is a little bit of a change of character being the news today hasn't been very bad, should the market start to sell-off on a day in which the news isn't very bad, we know that we are approaching stage 4 decline-similar to what you saw in yesterday's charts of MSFT

GLD/SLV

Here's yesterday's GLD/SLV analysis 

And this is what I wrote yesterday in an email to a member regarding GLD:

"I meant that the bear flag doesn't appear to be falling apart yet so it could/should rise a little longer, but ultimately it doesn't look good overall. This is just a bearish consolidation, I don't see it turning things around, but there will probably be a 1 day event that makes it appear as if the bear flag has failed as it's obvious to traders, so an upside breakout (or false breakout rather) would be likely if we get another day or two of upside. You may be early on DZZ."


We commonly see false breakouts or breakdowns of very familiar technical patterns like a bear flag and even more so in an ETF like GLD which is a hot trade that everyone is watching so as you can see by my email yesterday, today's price action is not at all surprising. However, we need to put it in context of several major events that have changed the picture overnight: The PBOC RRR hike by 50 basis points, The USD, JPY intervention and events in MENA and perhaps most influential today is Goldman Sachs buy rating on Gold just issued (I always am suspicious of these type of announcements-I do believe they are self serving, but to what end?)


Lets take a look at the action thus far.

Resistance on the daily chart of GLD

This a.m.'s initial move was confirmed, there's a negative divergence now with very high volume

It's also showing up on the 5 min chart, so this "may" be what I was referring to in the email. Right now itcertainly looks that way, making me wonder if GS's buy rec'd was to sell into demand?

SLV's daily resistance level

And the same action this morning in SLV

Here the 5 min chart doesn't look as bad, but it's not confirming, once again making me suspicious that GS used the buy red'c which was specific to gold, to sell into demand.


We'll just have to keep watching to see if the divergence spreads. Even though I had this expectation, emotionally you doubt yourself on a move like this, so I rely on the charts. My opinion isn't of any consequence, what happens on the chart is and thus far it's confirming the expected outcome.

The G7 interventions have started

Japan moved to intervene in the FX markets and the Fed just confirmed it too has intervened for the first time in 11 years (supposedly). However, the desired effect is not being rapidly acheived. Japan needs the USD/JPY to stay above 80, it has already started slipping.

The red arrow is 80 on this 15 min chart, it would be important for support to kick in at the lower channel line just above 80.  If that line fails, expect to see even more intervention very quickly.

GLD/SLV coming up next.

USO Update

USO is lower this morning, primarily due to the RRR hike imposed by the People's Bank of China, from what I see so far, I doubt this will be a major pullback, although Gadhafi pulled a fast one that may also cause oil to pullback a bit. He declared a ceasefire so it makes it a bit hard for the UN to bomb him out of power which of course was the end game. We'll have to see how this plays out, there's no doubt the decision has been made that his time is up, but he made a very smart move. In the short term, this should also have a calming effect on oil.

 This morning's negative divergence, or probably more aptly, 3C confirming the move down.

 The 5 min chart doesn't look too bad yet, but there was a lot of volume early on, we'll have to see if it catches up-the quicker it catches up, the more serious the distribution in USO/Oil

Still the longer term view is bullish. There will always be bumps along the road, you can't get too caught up in the daily gyrations, but rather use them to enter or add on strength, so long as the trend remains intact.

Right now, I'm thinking we'll see a downside target in the $39.50 area.