Wednesday, May 14, 2014

EOD Wrap

Interesting day, as stated earlier I think a large part of the afternoon dump was the reversion of ES back to USD/JPY as we've seen happen about 4 times this week already, and it never takes very long.

I still think we have a bounce coming, although the deterioration is now reaching a level in which trades are realistic as before the signals were always missing something and luckily as we'd just be chewed up in a choppy a sideways market for a couple of months. However, now I believe is the time to use price strength (bounces) to enter decent looking shorts or broad exposure inverse ETFs like SQQQ, SDOW, SRTY, SPXU, etc.


The main reason I think we get a bounce that is driven by USD/JPY which remained pretty flat all day under $102, is the 5 min Yen chart and it suggests bounce and that's about it as all of the Yen timeframes above 5 min are positive unlike last week BEFORE we moved above USD/JPY $102. I'm surprised how quickly those FX charts turned, almost instantly after $102 was crossed, but maybe it shouldn't be surprising considering the amount of damage in the averages since stage 3 of the February cycle started.

 Yen 5 min negative divergence, but only 5 min, not beyond. If the Yen falls and the $USD remains relatively flat or moves up, the USD/JPY bounces and takes Index futures and the market with it, our bounce.

 The 1 min USD/JPY lost a little on 3C intraday, but the 5 min chart gained.

This 5 min USD/JPY further suggests a bounce, again, limited because of the Yen positive divergences beyond the 5 min charts, ideal to sell short in to.


Some other indications that suggest a bounce...
 This is HYG (blue ) as a leading indicator vs the SPX green intraday, it is leading very short term suggesting a bounce.

 The same can be said of sentiment, but remember what the bigger picture here looks like...

Longer term sentiment from the Feb 3rd Cycle.

Here's TLT vs the SPX (green) w/ SPX prices inverted to see the correlation, TLT has run way above it. I'm not sure the market understands TLT's new dynamics, it use to just be a "Flight to Safety Trade", but with the F_E_D ending QE, it may be taking on a new relationship.

 I stuck with the TBT (short TLT 2x) position mostly because of charts like this, even though we saw this coming on the 12th (15 min TLT negative).

This is TBT's confirming 15 min positive.

Also TBT's 3 min positive near term as far as timing and...

A 5 min leading positive, thus we'll see what TBT brings and evaluate the position as we get a move which I think is very high probability.

 Yields are a favorite leading indicator as they pull equity prices (SPX) to them like a magnet to revert to the mean as we saw today, but again, don't forget the bigger picture.

Yields are significantly lower than the SPX correlation, the SPX has a lot of catching down to do.

 We also have an EOD SPY inrtraday positive divegrence forming at the close and stronger ones in the IWM.


IWM 5 min positive, but note how quickly the IWM turned negative once the USD/JPY moved above $102 on the 12th, this kind of negative activity turning quickly and strongly is seen market wide.

We do need to be careful shorting into price strength or bounces because the market is so weak here...
Note how weak the character of this 30 min ES chart is suddenly.

And as far as the candlestick picture, not pretty either.
This daily SPX chart shows a classic shooting star reversal formation with confirmation today.

To put it another way, the only thing right now that supports a bounce is a single 5 min Yen chart, one that I think is important, but everything else we have is pretty darn ugly.

It looks like we are finally going to be able to move out of this...
A choppy meat grinder and in to some real positions. You may have noticed I haven't put out a lot of trade ideas lately and that has been because the signals were not there, it only happened after that we saw this choppy lateral range that we would not want to be involved with anyway, but now the signals are there and they are in line with the probabilities, not counter trend like the Feb 3rd longs or April 11-15th longs, but in line with probabilities to the downside.


Looking for a GDX/NUGT Pullback

I just wanted to get this out quickly in case it was needed, this is not the kind of pullback that would move me out of an equity long, maybe options, but not an equity long, furthermore it looks like it will be helpful in repairing the 10 min chart and allow us to enter or fill out the NUGT long to full size at slightly better prices.

Market Update: A Bounce is Likely

I'm pretty sure I know what we just experienced, I've mentioned it numerous times this week, the disconnect of ES from the USD/JPY correlation, it happened 3 or 4 times earlier and each time was brought right back to the USD/JPY correlation. I showed this on a chart in this post, Time to Start Looking at Trades... USD/JPY Update,  this morning and talked about the probabilities for reversion to the mean.

Here's the chart from the post linked above from this morning...
 This morning's 5 min chart of USD/JPY vs. ES (purple) and the disconnect, there have been at least 3 or 4 incidents that were similar and each reverted back to the USD/JPY correlation, the downdfart in the market since just after 2 I believe is likely part of reverting back to the correlation, especially if USD/JPY bounces as I suspect.

Here are the same charts from just a few minutes ago.
 The 5 min ES (purple) vs USD/JPY, it's not at reversion to the correlation, but a very good start.

This is a 15 min example and at the red arrows you can see past incidents, none as big as this, but there was even one yesterday with ES running above the correlation only to be brought back down.

 The USD/JPY wasn't part of the move as it hasn't moved much, but the 3C indication intraday suggests it will test $102 as I suspected this morning.

Here's why...
 The 5 min Yen has a nasty leading negative, that "should" be enough to send the Yen lower and USD/JPY higher to test $102, it will probably hit the reversion correlation with ES on the nose.

On the same 5 min chart, the $USD which was already in a bad position, but was improving a bit earlier this morning has lost that improvement, so once the market lets go and USD/JPY comes down, I suspect it will be a nasty drop.


The 15 min Yen chart is positive which would support the fall of USD/JPY and a nasty broad market drop.

Essentially everything is pretty much the same as this morning, except the reversion to the Carry Trade correlation (that was expected) seems to have taken place to some degree.

As for the signals in the averages, nothing very strong right now, but a few suggesting a bounce in line with the Yen 5 min chart.
 ES 1 min


NQ 1 min


TF 1 min

The 5 min charts are horrible, VERY negative.

 IWM 1 min looks like it wants to bounce, this would be in keeping with this morning's analysis of the Yen 5 min chart.

And IWM 2 min, but other than that, things are really starting to look bad, so it is finally looking like it's time to start entering shorts and any bounces along the way would be very helpful.

SPY/Market Update

The market doesn't like something because the $USD nor the Yen moved very much, for that matter neither did the USD/JPY, perhaps it's because they have not moved, but the intraday 3C charts sure have moved quite a bit.

We may see the Yen start to fall soon and interrupt this draft down, if so, get ready for some real volatility. Since the market is moving so fast, I just captured the SPY charts.
 Intraday 1 min is in line with SPY downside

 However, note how much leading negative action there was today in the SPY 2 min

It can be seen migrating through the 3 min charts here as well

And even though we've had a negative divegrence migrating through the 5 min chart, there's additional migration from today specifically, but very fast.

 The 15 min chart is where the migration was at this morning, it has obviously added to that today as we'd expect...

And the cycle charts are already in position for a move lower.

I have quite a few things to check out.


FXI Charts

I'm not going to get in to the bigger picture in which I do like FXP long (UltraShort China FTSE 25), however FXI was a long equity position for a FXP pullback so I may be looking at FXP long equity in the very near future, but for now, FXI which has much better volume looks like it's about to come down and a put here makes sense to me as far as leveraging the profit potential.

Here are the charts, FXI always gives better signals than FXP because of the volume difference.

 I recently closed the FXI long equity position because of some charts I didn't like, this 1 min intraday is leading negative which is an excellent timing indication.

The larger 3 min has been leading negative, it's hard to hold a long position that is really only meant as a trade with a divergence like this.

The 5 min after having been in line is also turning down.

The 15 min is leading negative


However, these charts are the reason that trading FXI on anything more than a trading basis is against the probabilities...

30 min FXI

This is the reason I've been looking for a short on China, note the FXI trend, the last move that was to the upside on this 60 min chart that has gone negative looks to be a countertrend bounce, that's why we exited FXP and entered FXI and recently exited FXI, all trades at a gain.


Trade Idea: FXI June (monthly) Put *Speculative

It looks like FXI is going to be coming down, I'll have some charts up in just a moment, but I'm going to go with a small FXI June monthly Put with a strike of $36.

NUGT 10 Min Chart Improving

There may or may not be a pullback in NUGT, if there is, the way things are going now, I'd definitely add and bring NUGT up to a full size position. The only reason NUGT long (trading portfolio) was at a half size spec position was because it looked so good everywhere except the 10 and 15 min charts which were so instrumental in forecasting Gold Miners for us a week ahead of time.

As you know all of the recent GDX/NUGT posts have been centered on the 10 min NUGT chart that had not yet improved, unlike all of the others. Earlier today I saw and posted the first signs of improvement on the timeframe, Quick NUGT Update.

Here's what has happened since... (which is actually quite a bit for a timeframe as long as 10 mins on an intraday basis)

 The earlier improvement didn't have the kind of vertical 3C movement we are seeing now.


There's still work to be done, but at least we are seeing the improvement. I'd consider entering NUGT or rather filling out the position to full size on either a pullback with the 10 min chart in good shape or even NUGT in this general area, maybe even a bit higher with the 10 min chart in good shape, it's really all about the 10 min chart .

Even GDX which had a better looking 10 min chart, but wasn't confirmed with NUGT or the inverse DUST, has seen improvement on the 10 min today.

And as for confirmation, I said I'd need to see it on DUST as well which is the inverse of NUGT so today's leading negative movement in DUST is the confirmation I'm looking for and is actually pretty impressive.

FAZ

FAZ (Financial Bear 3x leverage) is a long trading portfolio position at full size, it's how I want to play Financials short initially, first I want to be in place with the sector move, then I want to look more specifically at individual stocks because I'd hate to be right on the Financial sector and wrong on the specific stock selection, plus this gives 3x leverage over XLF, except inverse meaning XLF moves down and FAZ moves up. The FAZ long right now is down about a -4.5% which is no big deal to me considering the market chop and the 3x leverage, if I could add to the position, I would 
(at the appropriate time, but that's why we are looking at these right now)...perhaps options.

Since this morning's post, Time to Start Looking at Trades... USD/JPY Update in light of the set-up and positioning of the market, I've been furiously thumbing through watchlists and I can see the difference between the signals last week in which I thought, "These aren't ready" and what the trend among the watchlists looks like now, there's significant improvement toward entering positions.

FAZ is one of the positions I like because Financials look so bad (XLF).

At the end of April the F_E_D 1-day fixed rate reverse repo had the second highest amount ever at somewhere over $200 bn on April 30th. Why is that important? Because it's month's end and banks were obviously borrowing the 1-day loan to prop up their cash position/balance sheets in an attempt to make their financial situation look better than it really is for both investors and regulators, that's called "Month End Window Dressing" or "The Art of Looking Smart", the money goes back to the F_E_D as soon as the month's end reporting period passes, but THE SECOND HIGHEST AMOUNT EVER? AFTER 5 YEARS OF NEARLY RISK FREE POMO PROCEEDS, THE BANKS ARE STILL IN BAD SHAPE?

It has been my opinion that ONE of the reasons the F_E_D engaged in QE was because the banks needed re-capitalization and as you may recall around 2008/2009 when they were getting it, it was deeply unpopular with the American VOTERS. However, POMO or Quantitative Easing is an easy way to give the big money center banks, most of which are Primary Dealers and participate in POMO, risk free profits and this was done for nearly 5 years.

Outside of the US, China's biggest banks are raising cash through new offerings, this isn't just a US situation which is important because all of these banks interact and counter-oparty risk is what made 2008 so volatile and destroyed so many banks over a period of a couple of years including the nearly century old Lehman Brothers. In any case, that's just some thoughts and I don't base analysis on thoughts, here are the charts.

 This is the 4 hour XLF/Financials chart, the white area is the February 3rd cycle, this is the one we saw coming as early as Jan. 28th as accumulation built, t ran a bit higher than expected, but it had a large short squeeze to help out. You can see that things have turned even worse since then.

 This is the 60 min XLF chart, negative at the same area in to Jan which is around the time of December Window Dressing when I was saying, something doesn't look right here and the market lost ground after Window Dressing for the year and quarter were done.

Again you can see the Feb 3rd cycle, this time because it's a shorter chart and thus less underlying flow (but still very significant), you can see a positive divegrence in to the Feb 3rd lows and a negative divegrence in to stage 3 and a leading negative that I didn't draw on as it took something away from the chart.


I included this 5 min chart that is the first REAL sharp leading negative divegrence because it matches up with another 5 min chart and the timeframe is significant because of timing/entry/exits.


FAZ-3x short XLF/Financials
 This is FAZ's 4 hour chart, quite a bit different than XLF's.

I didn't think I needed to draw in the leading positive divergence.

 Here's the 60 min FAZ chart, leading positive in this area, the red negative is Feb 3rd.

 Again on a 15 min chart, Feb. 3rd is clear as it should be being this is an inverse or "short" ETF. The positive divergences in MArch are interesting, but what is really a great example of a word I type more times than any other word, "Divergence".

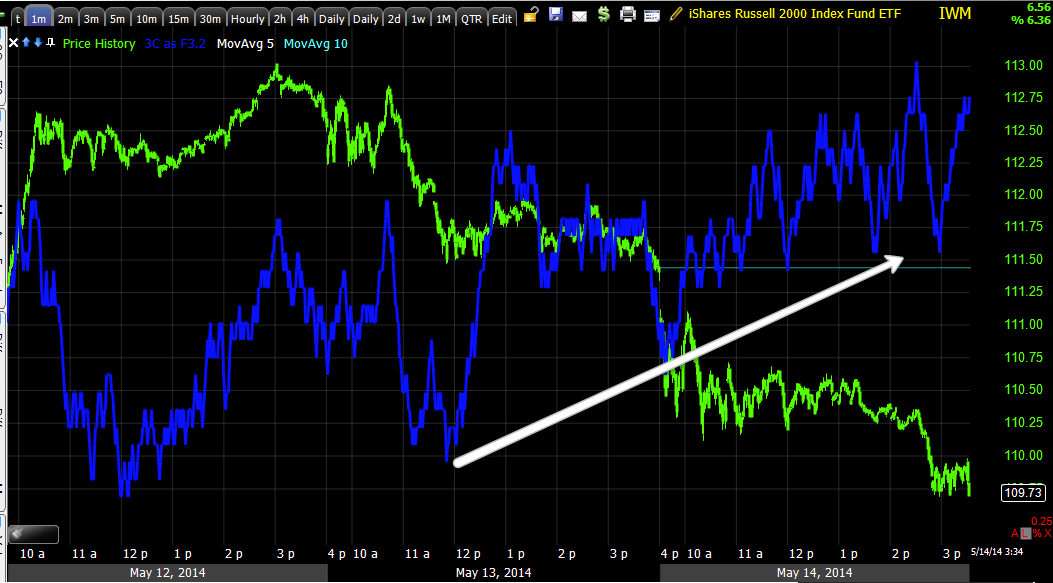
To the right look at the direction/trend of price marked with a green arrow and the direction/trend of 3C marked with a white arrow, that is a PERFECT example of a divegrence, this is the edge that we are looking for and then use multiple timeframe analysis as well as concepts that are tried and true to find the best entry with the lowest risk, highest probabilities and best timing.

Starting from the intraday 1 min charts...
 FAZ looks like it is set for a pullback which would make sense if we got the USD/JPY test I expected from this morning's posts, thereby giving us a better entry in to FAZ long, this is not a bad negative, just an intraday.

The 3 min chart shows the recent trend of a positive and a move to the upside and a smaller negative as this is a longer timeframe.

Remember that XLF 5 min chart I included above?
XLF's 5 min had a unique leading negative 5 min that hasn't been seen in a while, it is confirmed by FAZ's 5 min leading positive, thus with all of the longer term charts and this as well, a small pullback (1 min/3 min charts) should offer an excellent entry in to FAZ long.

You might want to set some price alerts to remind you.