I just returned from a board election for our community, it was my first time running for the board and we've only lived here for little more then a year, I had the second most votes and am the new Secretary!
On to the market, after digging around a bit after market, there's pretty much one word, "Bernanke". I mentioned earlier the strange timing of his comments (considering how much he has been in the public eye over the last week) and how they were ambiguous enough to have plausible deniability and this coming from JP Morgan.
Internally today volume and advancers/decliners looked like this,
Today's market action came on lower than avg. volume (NYSE 755 mln, vs. 802 mln avg; Nasdaq 1560 mln, vs. 1727 mln avg), with advancers outpacing decliners (NYSE 2302/743 Nasdaq 1955/605).
The high ratio of advancers/decliners can often create a quick overbought condition, we saw something last week like this as well. By quick, I mean generally the next day or so there's a reaction the other way. We also see this when the Price/Volume relationships are very dominant.
The only dominant P/V relationships today were in the DJ-30 and the SPX.
Dow dominant P/V relationship
SPX dominant P/V relationship
Both relationships are the most bearish of the 4 possible relationships. This can also create a one day overbought condition.
GLD which was a short term trade idea from last week came in with the largest single day gain in two months, although the original divergence seemed to have enough steam behind it to carry GLD higher, because of the fact it is at the 100/200 and near the 20 day moving average, I posted earlier on considering a trailing stop in the area.
(200 day=white, 100 day=yellow, 20 day= blue).
GDX and GDXJ were also trade ideas from last week (short term long plays) posted the next day on 3/21
GDX was up 1.79%, GDXJ up 4.26% today. I would be looking at trailing stops on these as well, these were meant to be short term trades, perhaps up to a swing trade.
GDXJ
Commodities in general were strong in the metals, but less so in Energy, Crude specifically.
DJP (commodity index) closed up about .49% lagging the overall market.
USO closed up only .17% today weighing on the commodity complex.
USO
Interestingly, yesterday USO moved about as you would expect vs. the dollar (white), today crude didn't capitalize off the move lower in the $USD.
There was some interesting trade in the market vs. the FX/Currency correlations.
Here's some long term daily correlations from some important turning points such as the 2009 bottom, the $AUD has acted as a leading indicator quite often and on multiple timeframes. Above the $AUD/USD was making higher lows several months in advance of the bottom in stocks, it also topped first in 2010 before the market went lateral and started trending higher before stocks coming out of the 2010 lateral trade before QE2 was announced.
Here's the current daily chart between FXA and the SPX which is clearly leading down after having been in lockstep for most of the rally.
This is a closer view of the same.
Today going in to the afternoon session it was clearly less enthusiastic then equities as judged by the early intraday highs (FXA in orange, SPX in green).
As far as the Yen correlation/Carry, generally speaking there's an inverse relationship between equities and the Yen, the Yen has long been a carry trade favorite and a risk on/off indicator. This chart is a little confusing at first, but in the red box to the left, the Yen rises and the market falls as the cost of the carry trade becomes more expensive and forces margin calls. In the green box, the Yen is falling and the market bounces off the 3/6 pullback as would be expected. As the yen goes flat, the market starts the roll over from last week in yellow, the Yen rises once again in the small red box and the market hits its recent lows. Today however in the orange box, the Yen was relatively stable, it did lose some ground but was flat throughout the day, making the afternoon rally a strange break in the correlation.
Here's a closer view, as the yen hit local highs at the green arrow, the market hits last week's lows, the move down today was small and along the lines of the positive divergence I mentioned in last night's "The Week Ahead" . What becomes more strange is the afternoon rally as the Yen is totally flat. More or less a small move up was what 3C was showing in last night's post, the Yen correlation along with other indications make clear that today was one of those "F_E_D surprises" I mentioned last night with so many F_E_D speakers this week.
Here's the USD/JPY today traveling along laterally for the most part, hinting at the strangeness of the afternoon rally.
Yields are another interesting leading indicator...
Many indicators in T.A. are fractal in nature meaning they tend to work on long term or short term charts. This is Yields vs the SPX in 2000 at the Tech Bubble, Yields were a leading indicator on the downside and counter trend rallies, which in a bear market tend to be some of the sharpest rallies we see.
Here's the 2007 top, again yields led the way and also led the way at the 2009 bottom months in advance of equities on a daily chart.
Here's the 2011 top that declined 20% in late July/early August, again yields led the way as well as calling the October low about a month in advance. As of now, they remain severely dislocated from the market.
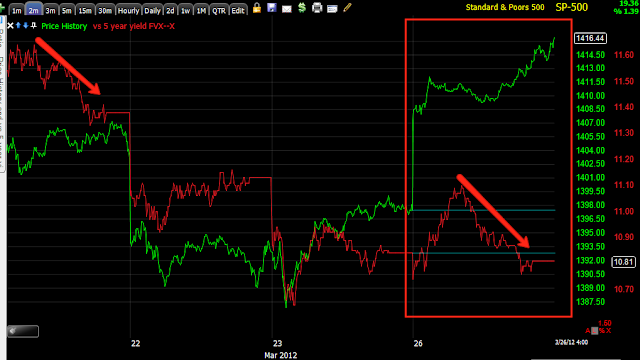
Over the last week or so, yields also were declining before the market gaps down we saw last week. Today they were very divergent with the market, typically they trade with the market until there' a divergence in which they tend to be leading, although today they made no effort whatsoever to move with the market.
Here's closer view, gain they were divergent before the closes last week that saw gaps down the next day, today, only a brief bump early on and then headed the opposite direction from equities, another strange divergence.
Today there was no confirmation in the averages in 3C suggesting that there was underlying selling by smart money in to the price strength.
3C has done a good job with divergences in the QQQ, today there was almost no effort to confirm the price move, leaving the Q' in a leading negative position
The same can be said of the SPY
However no where was it more evident then in the IWM.
Even the 1 min chart was way out of whack.
Even ES which has been doing a good job on intraday moves, just moved lower all day as ES moved higher.
This is a time series as I can't fit it all on one chart...
This is overnight last night and a positive divergence on the EU/German data moving ES higher, but it quickly went negative.
After the gap up on the open it continued lower and as ES and the market leaked gently lower until around 1 pm where there was a relative positive divergence, but still within a leading negative environment. ES took off from there and 3C quickly started leading negative in to the rally, again seemingly smart money selling in to price strength, ES closed at the highs while 3C was near the lows for the day.
Into after hours, the same condition has continued as ES has been relatively lateral, the divergence is now much deeper. We don't see this kind of action very frequently in 3C/ES.
Today was definitely a strange day in many respects. I would have to say that there has been enormous smart money selling in to today's strength.
The recent trend in money flows are also a bit whacky for such a strong market rally. Not only are domestic equity funds losing money flow hand over fist with 23 out of the last 27 weeks seeing money flowing out of these funds, the last 4 weeks have been consecutive with ICI reporting last week alone Domestic Equity funds lost $2.9 billion dollars. Insider selling is picking up as well even as companies announce stock buy backs. During January insider sales to purchases were 5:1, then 14:1 in February and 35:1 by mid-March.
Well it looked to be a dull week with few US economic data reports, but it's off to a big bang, however suspicious. Tomorrow is the last day for window dressing, Ben speaks at 12:45. We also have S&P Case Shiller, Consumer Confidence, Richmond F_E_D Manufacturing Index at 10 a.m. as well as a 4 week bill and 2 year note auction.
As mentioned last night, the bulk of the important reports will come Wednesday-Friday, so this week still has a lot of market moving events coming up.
For now, I'm not too surprised the market reacted the way it did, I am surprised that Bernie spoke out today as his speaking schedule was heavy last week and I am surprised at JPM's take on what Bernie said, being there seems to be a close love/hate relationship between Bernie and Jamie. Maybe even more interesting is that JPM even released their analysis of what Bernie said (linked above).
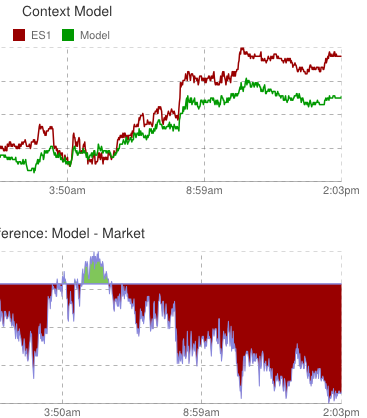
As for ES overnight, if I see it I will post it, but for now, the CONTEXT Model is showing what I'm more or less seeing.
Another HUGE divergence between CONTEXT's ES model and ES itself, ES is depicted in this model as being severely overvalued or negatively divergent. Look at the lower graph between 10:48 this morning and 9:52 tonight! This isn't my model, but just about every where I look, this is what I would expect to see in CONTEXT.
Is interest rates about to start going up?
-
Yes, I know - it does not make any sense - FED is about to cut
rates...but....real world interest rates are not always what FED wants it
to be.
6 years ago


