Monday, December 9, 2013

Daily Wrap

My first thoughts to myself for both today and Friday are, "What the heck is this about?" and not in a good way for the market. Whenever there's doubt I always try to go with the highest probabilities and there are tons of places to look that all confirm each other, as far as the short term trade, it would be nice to understand what's going on, but I'm more interested in just being on the right side of what's going on.

You saw the credit situation and the market's desperate need to rig up $.60 of SPY arb to hold $/44 in gains. Not to mention today was the lowest ES (non-holiday) volume day of the year, it seems just last week we were talking about the exact opposite.

The oddities don't stop there...

Take the Dow-30 for instance, remember how many times today I said, "This seems like a market caught in 'indescion' and that's generally not good, especially after a day like Friday?"

Sometimes we look at the ATR or Average True Range to get an idea of changing character, for instance...
The ATR of a rallying asset should see by pure mathematical function alone a higher ATR as it advances, here we see the Dow-30's 10-day ATR go from over 200 to under 100 in about 6 months, that's not a healthy sign.


However today's was even more stunning...
 We have the range of the open and close on a candlestick to the left, to the right we have the day's range, high  minus the low gives us the range the asset travelled during the day.

Today's Dow -30 saw the smallest range it has seen since August 17th, 2012 (yellow arrow above).

This is my indicator that shows the day's range, today the Dow had a range of 43.11 points, the lowest since Agist of 2012.

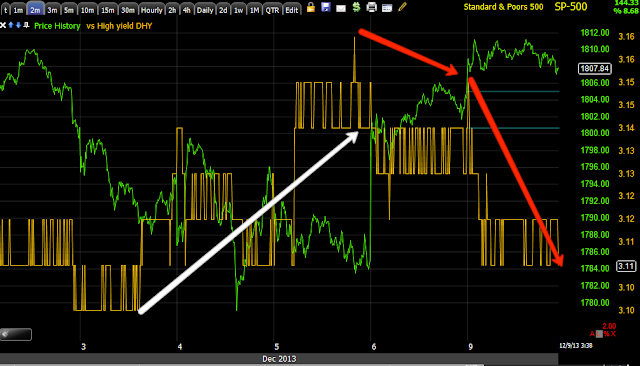
None of the JPY crosses seemed to work very good today, perhaps that's why HYG and the SPY Arbitrage got extra support in to the close,
EUR/JPY vs ES (purple) during regular hours, the AUD/JPY and USD/JPY didn't fare any better and talk about smashing the VIX in to the close...!!!
VIX in white vs the SPY, SERIOUSLY? That little EOD 1 min candle and the VIX smashed like that in to the last minute of the day?

Just for some context...
VIX range intraday

The Absolute Breadth Index I showed you about a week ago remains extremely low which is consistent with the topping of a market, the McClellan Oscillator has a negative divergence stretching from September to present.

You know how I'm fond of breadth indications BECAUSE THERE'S NO INTERPRETATION, THEY ARE HARD FACT...

From 10/22 to present the SPX has gained +3.06% while the Percentage of NYSE Stocks Trading Above their 40-Day Moving Average ....
 (Indicator in green vs SPX in red) Has seen the % fall from 82% to 47% and this while the SPX moved up 3%

The same indicator, except momentum stocks as it uses the Percentage 2 Standard Deviations Above the 40-Day Moving Average during the same period has fallen from 42% to 6% Thursday and just below 11% today.

The same indicator using 1 Standard Deviation instead went from 66% to 29% in the same period and 21% last Thursday.

While the Percentage of Stocks falling Below Their Moving Averages rises, over the same period Stocks 1 SD Below their 40-day increased by 400%, Stocks 2 SDs increased 400% and Stocks 2 SDs below their 200 day doubled.

There are some wicked changes in character going on and not too many people are aware of the breadth readings, but that's the actual number of stocks falling apart in to the advance, remember what I said about Index Weighting.

So far I don't see anything strange in futures and there was no Dominant Price/Volume Relationship, but based on the strange occurrences through the month or so as well as the week and the day like needing the SPY Arbitrage to keep the DOW within a tiny range on an extremely low volume day (futures) see above, I'm sure we'll be seeing some things "out of the norm" and unexpected.


Credit and SPY Arbitrage

I'm sure I'll find all sorts of other levers if I spend the time, but it's not really material, if one lever is needed then there's a clear reason, the market doesn't have the demand to lift itself.

HYG (High Yield Corp Credit) is one of smart money's favorite assets to express a "Risk On" position in the market. Smart money use to use real credit, however after the 2007 top, banks started writing credit off their balance sheets and just like when you go to short a stock and your broker doesn't have it available to lend, more and more large institutions that wanted to diversify a credit position were finding the banks didn't have enough to lend and certainly not enough to diversify a credit position.

 (High Yield tells you they are long risk and positive on the market / Investment grade tells you they are looking for safety and bearish on the market)

As such, algos read HYG (created as a High Yield diversified Credit proxy that smart money uses like we might use an ETF) moving up as smart money being bullish the market and algos buy stocks.

The rest of the SPY arbitrage includes two other assets, this is straight from Capital Context's explanation of the construction of their SPY Arbitrage model...

"In much the same way that a company’s valuation varies due to business condition uncertainty and its cost of capital, so the broad market can be modeled based on its capital structure. Through years of ‘capital structure arbitrage’ experience in the credit derivative markets, Capital Context has created the ‘SPY Arb’ model which identifies a tradable relationship between the stock market (SPY) and its value implied from interest rates (TLT), credit risk (HYG), and volatility (VXX). "

As for VXX, it represents short term VIX Futures, it's not an actual VIX future contract, but a blend of the forward (closest months). Algos read VXX being down as traders confident and not looking for protection, conversely a rising VXX (we must distinguish between 3C and actual price as only we see 3C) tells algos that investors are fearful and reaching for the safety of a VIX hedge.

Finally TLT represents 20+ year bonds, traditionally and in the model, a rising TLT meant a flight to the safety of bonds and out of stocks (that relationship has been skewed by QE), but algos still seem to take that cue as we saw Friday. Conversely rising rates and falling Treasuries are interpreted to mean money is flowing out of bonds and in to stocks and the algos see that as a buy signal.

In reality the week previous to last we saw a huge move in domestic equity Mutual funds (which tells you almost immediately that this is dumb money) out of Bond funds and in to stock funds, essentially dumb money feels they are missing the party and leaving the safety of bond funds in what has been termed the F_E_D induced "Reach for yield", after all, if your bank account was paying 6% interest (I remember when mine paid 12%) you wouldn't be so eager to take risk, however the F_E_D has created an artificial situation forcing investors to reach for yield.

In the SPY arbitrage modeling (although HYG has been used alone a lot more often recently, HYG up, TLT and VXX down means "Risk on/buy stocks" for the algos, conversely HYG down and VXX and TLT up means risk off and sell stocks.

This is why I noted last week the 4 days of the market trying to hold HYG together while the last 3 of those days they spent time trying to suppress VXX. As you saw in Friday's daily wrap, the market didn't move until 11 a.m. when the 3rd asset, TLT moved down. In any case, short term manipulation can be accomplished as smart money has largely left credit in droves from late May through June.

Here's today's SPY Arbitrage Model, clearly activated but you could tell that just from HYG and VXX's price position.


The SPY closed up +0.24% or +$.44, but nearly +.60 of SPY Arb. was needed just to keep that +.$44 gain.

 If you invert the SPX's price as I have done to the candlesticks and compare it to VXX, you can see how close the algo buying/selling is to the arbitrage.

This is the SPY (green) vs HYG (red), again the arbitrage has an almost identical price pattern intraday.

This is a closer view of VXX today vs the inverted SPX, if they were exactly equal it would show a perfect correlation, but the outperformance of VXX shows there's a bit more of a reach for safety despite the manipulation.


On Friday, I had already had an idea HYG and VXX were to be used because the day before I had commented how one (HYG) was being propped up while the other (VXX) was being held back.

However when HYG gapped up Friday to help move the market (no it wasn't about some apathy toward the NFP) I was interested to see someone was using that price strength to either sell or short in to.

Friday's 1 min intraday HYG chart.

This is why I was so interested this morning in what would happen in HYG today.

 An even larger 5 min negative divegrence which is many orders of magnitude stronger than a 1 min was clearly present.

However late intraday you could see them trying to prop up the SPY Arbitrage in HYG 1 min
 As distribution was taking place in HYG intraday price started wobbling and getting volatile, HYG got a little extra late day support to stabilize it in to the close.

What is interesting is that Junk Credit is High Yield as the warning, "Junk" would imply, but it seems to have no relation with the market, but it tracks HYG nearly perfectly.

 This is HYG in candlesticks and JNK in the blue line on a daily chart.

To make it even more clear how close they track and when Credit REALLY left the building...

This is the SPY vs HYG in white, JUNK in Blue and High Yield in yellow, you probably don't even notice there are 3 types of credit vs the SPY, the blue and white are HYG and JUNK tracking nearly perfectly. However you can see clearly that the 5/22 Key 1-day reversal played a major role in turning credit risk off.

HYG and JNK are similar in tracking Very liquid US high Yield Bonds, but one tracks Markit, one tracks Barclays, still they are nearly identical and not that different in size.


What I find interesting is looking at the JNK 3C charts as JNK doesn't seem to be used in any arbitrage scheme.
 JNK 1 min intraday, it would look like HYG 1 min if HYG didn't need some last minute help.

2 min also shows some propping up around the 4th/5th , same as when it was noted last week in HYG.

 Take a look at the distribution on the 3 min chart before the gap down, also mid point last week and in to this week.

Now look at the same 3C 5 min chart for HYG...
HYG 5 min 3C chart vs JNK'S below

 JMK 5 min,

JNK 60 min

The point is, regardless of the fact HYG is used to manipulate the market, both are seeing strong distribution on any price strength.

"Credit leads, stocks follow"

GLD/UGLD Equity Gold Positions

There's some very short term negatives in gold, negative actually 1 min, other than that, for any equity based gold long, I'd hold tight, there are some very strong signals Gold is coming out of a head fake move and a reversal process to the upside.

In fact, if I had an interest in gold and didn't already have an open position, I'd be looking for any price softness to look at a long position.

EOD Market Update

Pretty much all day intraday charts have been as boring as the TICK data, I would call today the true representation of a Doji, "Indecision". So, I have to go with probabilities and stick with intermediate to long term charts as always, "When you can't find an obvious signal or signals are confusing on short term charts, move to longer ones".

Other than that, the only notable improvement I see intraday is late in the IWM and AAPL.


More Market Strangeness

Right now, sentiment indicators have gone positive in to the late afternoon.

What is also interesting is the last time HY Credit went positive was last week before Friday's pop, now HY Credit is clearly going negative.

We have contradictory signals and a rather strange day on the whole, HYG is again being used as an arbitrage asset along with VXX and TLT, in other words, they need to manipulate the market to keep it where it is, the SPY arbitrage has been on almost all day, HYG has been all day.

While I trust the sentiment indicators, I also trust the HY Credit.

The last time HY Credit was positive I noted it, it was during lmid last week's foggy market, now it is clearly negative.

The market isn't standing on its own, the SPY arb being used at +60 all day just to hold a Doji isn't a very impressive market, however something definitely feels on edge just like those quiet markets I warn about.

Dalas F_E_D President and Hawk, Fisher: Taper at the Earliest Opportunity


NEW YORK--Federal Reserve Bank of Dallas President Richard Fisher said Monday that it is time for the central bank to begin winding down its easy-money policies and give a clear time table for how that process will play out.
"The current program of purchasing $85 billion per month in U.S. Treasuries and mortgage-backed securities comes at a cost that far exceeds its purported benefits," Mr. Fisher said. "We at the Fed should begin tapering back our bond purchases at the earliest opportunity."
"To enable the markets to digest this change of course with minimal disruption, we should do so within the context of a clearly articulated, well-defined calendar for reducing purchases on a steady path to zero," he said.

Mr. Fisher said that when the Fed does begin to cut its bond purchases, it should make it clear the reductions will continue as long as there is no "serious economic crisis" to argue for a different policy path. The official said slower bond purchases don't argue for raising short-term rates any time soon. He said "we may wish to keep overnight rates low for a prolonged period, depending on economic developments."

And that's for the bond market.

Fisher speaks again at 6:30, the market's strange lack of movement reminds me of my own admonition, "Be careful of a dull market", especially in a situation like this.

KEEP AN EYE ON MCP

It looks like it's prepping to make a move

Market Update 2

At 2:18 something happened the market didn't like much...
 You can see it in the price candle on this QQQ 1 min chart (larger candle with the open at the high and close at the low on volume), however you can see it in just about every average, some more than this.

TICK responded the same at the exact same time with a -1000 hit on a 1 min bar, it felt like a knee-jerk reaction to something passing.

 The Q's seemed to have already been starting to lead negative just before then.

The larger 3 min QQQ chart was definitely leading lower, but not tied to that moment.

I wondered how HYG would respond today, I have my answer...
I'm trying not to draw on the charts too much so they are not distracting.

The only thing I can imagine at the moment is Richard Fisher started speaking at 2:15, I imagine he started with prepared remarks and there may have been something the market didn't like, I'll check in to what he's said thus far.

I'll also check a few other indications, leading, and some sub industry groups.

Market Update #1

If I ONLY looked at the NYSE TICK chart for today, my guess would be that the daily candle would be a stalemate or a Doji which is an opening and current/closing price at almost the exact same level, it's an indecision candle and while that may not sound bearish, when you have a day like Friday, you want to see follow through not indecision as indecision opens the door to reversals, this Evening Start Dojis, Harami's, etc. all being reversal patterns as well as the bullish versions too.
 This is the NYSE TICK index, all NYSE advancing issue less declining issues. Readings that range in the +/- 750 area are very neutral, so looking at this alone, I'd guess there's no trend other than lateral as TICK itself shows no trend other than lateral.

A look at the SPY...
A Textbook, perfectly formed Doji, actually an "Evening Doji Star", which is the second part of a 3-candle downside reversal pattern.

The reason why?

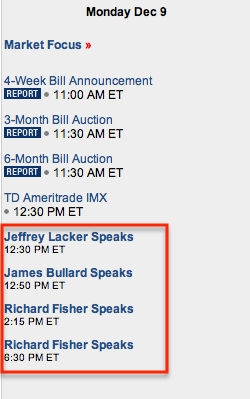
Next Tuesday and Wednesday the F_O_M_C meets with a policy decision coming Wednesday December 18th at 2 p.m., that means today is the last day before the 1 week "Blackout " period for F_E_D speakers, thus today we have 3 different F_E_D speakers at 4 events as the market has a last chance to try to divine what the F_O_M_C might do through their speaches.

Here's today's schedule for F_E_D speakers.
Considering this is the scenario, it's not surprising no one is making any big moves before they hear what is said.

Richmond F_E_D President Lacker already spoke and from what I can see, he didn't have anything surprising to say and there has been no market reaction. I think one of the highlights of his speech was, "There's nothing the F_E_D can do to boost growth".

From what I've seen of St. Louis F_E_D President, James Bullard, his most exciting comments (also with little to no market reaction) have been, "A small taper of QE in December might recognize the improvement in the Labor market, while giving the F_E_D an opportunity to monitor inflation in early 2014"

Other speakers have not started yet,

However I think there's something to Bullard's statement that sums up the F_E_D's scenario uncomfortably between a rock and a hard place.

Recall the Taper talk back in May/June and the Bond market lifted yields 1% on the benchmark, it hurt housing and various other industries that are interest rate sensitive, THEN THE F_E_D DID AN ABOUT FACE AND COMPLETELY SHUT-UP RE: QE TAPER.

Since then, Bernanke himself has gone through extraordinary pains to pullback original F_E_D guidance that an interest rate hike would follow about 6 months after QE ends, this is what sent the Yields spiking when hearing that half of the participants wanted to end QE3 by the end of 2013, several wanted to start at that meeting. The bond market didn't like that and they (not the F_E_D) took rates up 100 basis points and hurt housing and other areas.

You may recall I kept asking, "What is the F_E_D so Afraid Of?" That's the answer, they are afraid the bond vigilantes will do the same on a QE taper thinking a rate hike is soon to follow which they are more concerned about that tapering itself.

Bullard's comments hint at a small taper in December that allows the F_E_D to see how the market responds, but not with regard to inflation, with regard to yields. It makes perfect sense.

In any case, this explains (for me) why the market is in a holding pattern, I still haven't forgotten about Friday's overwhelming Dominant Price/Volume relationship which would normally see the next day (today) close down.


VIX Charts

You already know about what I think , timing wise taken with record margin debt (leverage) and record investor net worth as well as investor sentiment (Investor Intelligence) with "percentage bearish" levels lower than any reading on the chart, presumably since they've kept records back to 1990, all of this indicates the most sensible contrarian trade of the last nearly 24 years (maybe more) and that's before we even look at the VIX.

Remember earlier this year when the VIX just kept hitting new lows, first a new 1 year low, then 2 year low and then lowest VIX reading since 2007 and then it just stopped, it's at this point where VXX also can be seen refusing to make lower lows, it was apparent then that investors were seeking the safety of VIX, but still not willing to give up on their record bullishness. This brings Warren Buffet's admonition, "When there's blood in the street's it's time to buy", which is just a way to say when emotions have reached an extreme, things are usually on the tipping point of change, the reverse would be true.

 The VIX Bollinger Band, I rarely use BB's except on the VIX, there they seem to be especially useful and I'm sure it's because the VIX is an emotional gauge, even called "The Fear Gauge" A Bollinger Band Squeeze like this I have found to be very effective over the years, the only other indicator I like as much is my Custom, DeMark inspired Buy/Sell indicator which has been right on the VIX on each of the 3 signals it gave this year.

As you know I had said well before the VIX started to breakout of the BB' Squeeze, in fact while price was still under the 20-day moving average on the chart, that after the initial breakout price tends to hang around and pullback to the 20-day then make it's move to the upside, I even posted a chart showing every VIX breakout on the chart (over a half dozen) all pulling back after the initial breakout to the 20-bar m.a. before rocketing higher.

Friday's touch of the 20-day was unexpected, but as you may recall mid last week was a "foggy market" and I suspected something was up with HYG being held together and VXX being suppressed in to Friday.

Today's candlestick is much more bullish, price is in the area, it's a perfect Doji star, perfect balance of indecision which is where we find reversals of trends.


 The Tend 3C showing mostly confirmation, but I marked some smaller positive and negative divergences, the current leading positive is clearly the largest divergence on the chart.

 Plus the actual VIX futures (unlike spot VIX, this is the tradable asset) with a never before seen 4-hour leading positive divegrence put together in what would likely be record time.

Remember the VIX trades nearly perfectly opposite the market.

The 3 min UVXY chart, a very strong positive until last week when it was held up as the red box.

Compare to the inverse of VXX/UVXY, SVXY...
 The 4th is the key date and the current divergence after the 5th.

5 min VXX and the congestion mentioned last week holding HYG and holding back VXX.

Compare to SVXY 5 min.
 The VXX's leading positive in November is the exact same as SVXY's leading negative in November.

 UVXY intermediate/strong 15 min signal leading positive...

compared to SVXY...
SVXY is even worse as UVXY is at least in line in October (green arrow) while SVXY is relative negative, the current divergences are opposite each other as well on a strong  timeframe.

UVXY (just because I can't scale VXX this far out (although this is just the 2x leveraged version of VXX and most think it tracks better), this is a huge leading positive divergence.

Compared to the inverse, SVXY.
These are nearly like the folded paper "Butterfly" images, UVXY slightly negative at the 7th, SVXY slightly positiver at the 7th and UVXY leading positive around the 25th with SVXY leading negative and the current signals as well.

As I said, I'd have a very hard time now not having a position in a VIX long product as Fear moves the market faster than anything, just look at the 4 stages from a bull to a beat market and see how much faster a bear market falls vs a bull market rising. Fear is stronger than greed

VXX / UVXY Long

I'm going to get some more charts of VIX related assets up, but RIGHT NOW, I'd have a VERY hard time not having some long exposure (even if only speculative) as Fear is the fastest market moving emotion.

It's not just about the VIX doing exactly what was expected and the expectations having been laid out days (even a week) before anything remotely close to their fulfillment happened, it's the ongoing positive VXX / UVXY signals and the negative signals in the inverse assets like SVXY.

I was saying earlier a dreadful candle for market bulls today would be a bearish engulfing of Friday's SPX candle, there are numerous other downside reversal candles that all need a gap up, and off the top of y head only one that doesn't, a bearish Harami.

Furthermore, the Dominance of the Price/Volume relationship on Friday was huge and we haven't seen even reasonable dominance in any one of the 4 possibilities in a week or so, but Friday something like 70% dominance in almost every average and complete dominance in every average and that being the most bearish relationship of Price Up / Volume Down, for those of you who have been following this rare metric over the years, you know the next day close is typically down after a P/V dominance like that, it's like a 1-day overbought signal. Taken altogether, I'd have a very hard time not having some exposure, even though I'm more skeptical of these assets than ever. However, I'm not looking for a month long trend, but I think the way these can move and the way we are set up, they are a very intriguing asset.

Charts coming.


BIDU Trade Idea Follow Up

I look at the BIDU chart today and just want to ask, "Isn't Wall Street and predictable?", but it's really Technical Traders that are predictable and Wall St. just uses that against them.

In any case, last week on Friday December 6th I wrote about a "Trade Idea: BIDU (Short)"

This was the exact chart and commentary following it from the post above....
"This is the same ascending triangle, first month Technical traders learn these triangles and know an ascending triangle is expected to breakout to the upside and start a new leg higher, so long as we know there's distribution already present in BIDU which we know from out initial entry, we know the chances of an upside breakout being a false or failed breakout are very high, but the breakout provides us with a short entry that is a better price, much less risk and much better timing as head fake moves usually come right before a change in trend."

And wouldn't you just know it, the move we are looking for for a BIDU entry or add-to as it was a phased in trade idea originally with 1/3 entered and 2/3rds remaining to be filled, as discussed last Friday, this is the actual chart and commentary in the post linked above....


"My first choice entry is "A", a breakout to the upside above the $170.78 level, the breakout would usually be quite strong, it has to attract the attention of bulls and convince them that this is a strong move, they are selling a lie, so they must really make traders believe so don't just expect a move to $178.85.

Once we confirm distribution in to a breakout, we know the probabilities are very high it will be a failed breakout and "From failed moves, come fast reversals", this is the hardest to short emotionally, but it is the best price, the least risk and best timing so holding your nose and jumping is actually rational even though emotionally it is hard to short a strong looking breakout."

BIDU today, just 1-day after the "Trade alert/set-up"....
 My EXACT "Option A" preferred set up... "My first choice entry is "A", a breakout to the upside above the $170.78 level, the breakout would usually be quite strong, it has to attract the attention of bulls and convince them that this is a strong move, they are selling a lie"

As I said in the initial post, since there's already significant distribution there the chances of such a move being a false breakout are already very high just like our last textbook short in BIDU, but I always want to confirm. Even though it's probably a little early, we do have initial signals.


 The initial 1 min chart, the fastest to respond is negative.

An intraday look at the same chart.

And the initial migration from the 1 min chart to the 2 min chart, also note the little dip accumulated just before the breakout.

From here I just want to keep watching these charts until I think BIDU is at a position where the divergence is so strong that it's ready to reverse and then enter the rest of the trade so the timing is as close as possible to get the best entry and to have the least amount of opportunity cost.

This is the exact, preferred set up posted Friday. As I said and even demonstrated Friday, that ascending triangle wasn't naturally occurring.

MCP Trade / Follow Up

MCP is a current long, even though I don't like chasing assets, MCP's +2.5% gain today is still below the momentum area where it would really be chasing it above the $4.95 area. Friday MCP was put out as a long idea. There was also this update for MCP Friday and this update Thursday and this Trade alert Thursday.

Friday I felt very strongly that the MCP move was a stop-run/head fake move, today we are up 1.25-2.5%. Right now there's a bit of a pullback which I like for an entry.

Here are the charts and expectations near term.
 This probable X-Over daily screen was one aspect, the first pull back after the initial long x-over is to the 10-day (yellow), but we don't have a full long signal, so being there isn't that much space to pullback, MCP holding at the 22-day is fine.

 This is the apparent stop-run move, we see head fake moves just before reversals.

 3C remained very positive on the stop run as you can see.

Even here we have the 4 cycles, to the left stage 2 mark up, then stage 3 top, stage 4 decline which is the pullback which turns in to a stage 1 base with a head fake move just before an upside reversal, the same as you'd see on a long term daily chart's base. This is the fractal nature of cycles in the market.

I believe the stop run hit around the $4.95 area means upside momentum is likely as price crosses back above $4.95, as long as MCP is below, I think it makes for a reasonable entry long.