Thursday, December 23, 2010

More Trades

RDK is a grocer, you may remember my post which was bearish on grocers due to their razor thin margins and higher input costs.

RDK was one on the list. It's seen a bounce within a flag type pattern and ir looks as if that bounce is nearing completion.

 RDK 5 min showing slight accumulation for a bounce in white and distribution in red as it begins to round over.

 RDK 10 min confirming the chart above

And RDK 60 min which carries the most weight, very divergent. A stop can be placed either at $36.70 or to give it  bit more room, there's a gap resistance zone just above $37.00

By the way, XOMA just turned into a 200% trade in 4 days.

BAC and Financials

Yesterday afternoon under the post, Financials Update I showed you a few charts of the negative divergences and a rounding top. Today Financials are being hit. FAZ is doing pretty well, BAC is not. So far it's down about 3%. BAC may be offering a decent risk:reward trade. 

A short on BAC can be entered here with a stop above yesterday's highs at $13.45. With the way financials are looking, I'd say this is a bounce that is ending and BAC very well may continue the 7 month downtrend it had been in. I like the trade here, it makes sense as the risk is rather limited.

FAZ is another to take a look at, it's up +2.43% . Again, this is a fairly low risk, high probability trade with a stop below yesterday's lows around $9.40-about $.29 risk per share.

As you can see, BAC has erased yesterday's gains and is currently at a support level, if this support is broken, BAC could see a nasty move down.

Market Update

Support levels in the averages are being taken out. Earlier I posted a number of negative divergences across several timeframes, now we are seeing the market take out some important intraday support levels.

 DIA 3C negative divergence at today's highs-basically the highs were sold by institutional money.

 DIA support has been taken out around $115.60. Note the sell side volume at the intraday highs today. Also note MACD confirming the move down.

 The QQQQ showing negative divergences at the highs-again, distribution at the highs.

 Note the sell side volume at the negative divergence at yesterday's highs. The Q's have yet to take out the support around $54.65

 The SPY showing a negative divergence again at yesterday's highs. Right now 3C is in a nasty negative leading divergence.

The SPY has taken out today's intraday support as well as Tuesday's close.

More on Real Estate and REITS

Yesterday I wrote in this post, RESIDENTIAL UPDATE that it appeared the bounce is ending.Many of the REITS were already in downtrends.

Here are their charts today, most have reversed.

 CLP is at 0% for the day and will likely end the day lower

GGP is down on a reversal of the bounce today, -1.65%-MACD is also in a negative divergence.

SLG will most likely end the day lower

 SNH with a -1.54% reversal to the downside today, this is also in an established downtrend, MACD is confirming the downrend.

SPG-with a MACD negative divergence and reversal today.

These are REITS that are tied to various forms of Real Estate, residential and commercial. From what we've seen in the residential space and the last post on SRS, I'd say that this was no more then a typical bounce-nothing goes straight up or down and as pointed out last night, the sector is facing many fundamental problems.

If you like any of these ideas, they are fairly low risk/high probability trades. You can simply place a stop on a closing basis above yesterday's highs.

SRS UPDATE

BY NOW MY OPINION OF RESIDENTIAL REAL ESTATE SHOULD BE CLEAR.

This is a daily chart of SRS, note how close price is to support. A trade here has relatively little risk and the larger pattern of the descending wedge is a bullish one with a target of at least $25.

 SRS 5 min positive divergence

 SRS 10 min positive divergence


SRS 15 min positive divergence.

It looks like the pullback is SRS is over and it has successfully tested support and held. In my opinion, this is a low risk, high probability trade here and now. The target isn't too shabby either. Take a look and take this long trade under consideration. Remember, this is a leveraged, inverse ETF so buying SRS gives you short exposure to the Real Estate market.

Precious Metals Update

There's been a lot made of the JPM Silver market manipulation and the viral campaign to force JPM to cover their silver short. I really don't know about this, how true the rumors are, whether it's realistic to think people buying silver coins will force JPM to cover the short, but from what I've heard and more to the point, what I've seen, the $29-$30 level seems to be a line in the sand.

First the chart here does not look constructive, the long MACD I use shows a negative divergence and both attempts to break the $29 level have been met with some heavy volume.


The 3C 60 min. chart shows distribution at both attempts at $29

The 1 min chart today, thus far is in line, but until resistance is taken out, I just don't see the odds being very good for long positions in silver right now, at least not any substantial positions.
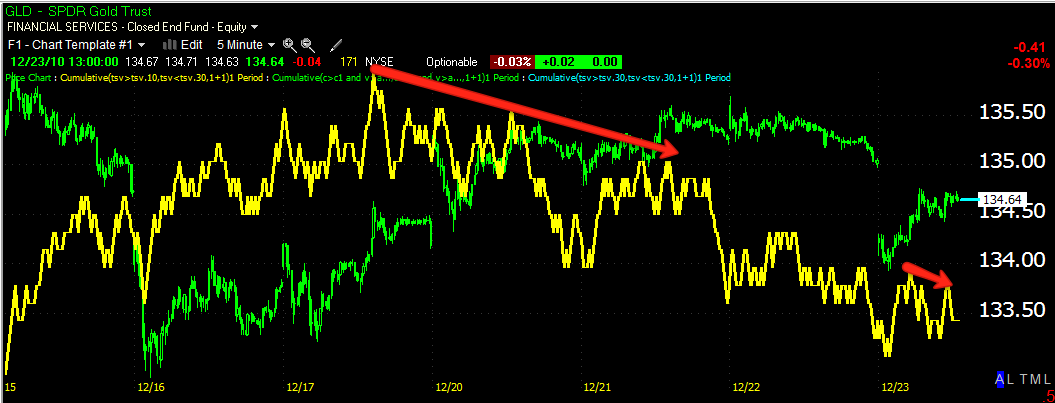

GLD
 The daily 3C chart above shows distribution at both attempts to break through resistance.


Above the daily chart also shows heavy volume on the breakout attempts

 The 5 min chart above shows distribution that led to a move down on a gap, so far the 5 min chart today isn't confirming the attempt to fill the gap.

The 15 min chart above shows that same distribution leading to the gap down.

Much like SLV, I just don't see either one of these trades (long) as high probability until the resistance levels can be taken out or until we see a healthy run of accumulation indicating that a successful attempt may be made.

As for short positions, other then the occasional quick trade of a day or two, I also am not seeing any outstanding advantages right now. Both SLV and GLD seem to be in a lateral trend and there's not much use in my opinion in having money at risk either direction without a pretty good reason.

Market Update

 DIA 1 min.

 QQQQ 10 min.

 QQQQ 60 min

SPY 5 min

Last night I mentioned the "Cats and Dogs rally" We are seeing some of those stocks pop and probably will see some more (XOMA, JSDA, etc), however, as you can see above we are seeing serious distribution in the averages in a multitude of timeframes. My experience has been the cats and dogs rally precedes a decline in the market. Right now we have evidence of both.

JSDA

JSDA has been featured several times recently, on Friday, December 17th I wrote the following,


"As you can see, JSDA has held the 200 m.a. for 4 months which makes for a fairly low risk entry."


JSDA since, has held that 200 day moving average.


Accumulation picked up yesterday and today.
 5 min 3C, showing strong accumulation yesterday and this morning.


The 10 min 3C shows the same.


So far it's up about 7% today. The volume is already double the 200 day average so it looks like it's going to be a strong contender moving forward.

Financials Update

Yesterday I posted this article on the apparent reversal in financials.

Here's where we are today-

 FAS (long leveraged ETF Bull Financials)-today the negative divergence continues, it is in a leading divergence which is the worst type.

 FAZ (Short ETF on financials or Financial Bear) today the leading positive divergence continues, it looks like there's some serious accumulation into the dip recently. Since this is the opposite of FAS above, we are seeing confirmation between the two.

XLF-Financials ETF-This is a 10 min chart, fairly substantial timeframe for reversals. It too, much like FAS at the top, has seen continuing deterioration today and is also in a negative leading divergence.

Bottom line, financials look to be under distribution/selling while FAZ-a short play on financials is under accumulation.

XOMA-Still Going

Remember this little trade from Monday?

Continuation of last night's post

Last night I talked about the fractional gains the market has seen over the last 3 weeks, that's how long it's been since we've had even 1 day above 1%.


On the hourly 3C chart you can see distribution into year end, the red horizontal trendline was the last time the market closed with a gain of 1%. Over the last 15 trading days, the average gain has been .18%. Tomorrow the market will be closed and next week will be light volume, but after the new year starts and the prospectus business is out of the way, it will be interesting to see if the Fed can or will continue to support the market through their POMO purchases. As our member pointed out last night in his email to me, 


" In addition, keep in mind that this dramatic drop in refinance activity to nearly zero will also affect the early prepayment of MBS loans on the Fed's balance sheet.  It is this prepayment of MBS loans that the Fed is using to fund the POMO program.  Where is the money going to come from to continue the program through next year, more printing?"


The common answer would probably be "yes", they'll continue to print money, however, I don't think the Fed in it's nearly century long existence has ever come under the scrutiny of Congress as they will come the start of the new year. Ron Paul has openly advocated abolishing the Fed and at minimum, strip them of their dual mandate. This is the man who will be charged with oversight of the Fed. I have a feeling the Fed is not going to look the same come 2011 and may never recover the absolute independence they've had over their 98 year existence.

Black-boxes and pattern recognition

There is a company, I believe it's called Trade-Ideas that is for retail investors; some brokerages offer Trade  Ideas as part of their research package. The point is, Trade Ideas is a retail based, pattern recognition system; it seeks out flags, pennants, triangles, etc.

I've told you in the past, about 90% of technical patterns that traders have learned to trade for over a century, are now being manipulated by professional HFT and other black-box systems. For example, yesterday during the afternoon session, a bear flag developed. A century of books have taught us that bear flags are continuation patterns and once they break below lower support they should make a new leg lower. Traders continue to fall for this as the black box systems continually manipulate these common patterns.

Here's yesterday's bear flag (bearish continuation pattern)
The trendlines in red define the bear flag, traders expectations is for a break of lower support and a new leg down. Instead you see near the close there was an upside breakout. This leads traders to believe it's a failed pattern, any who entered the flag on hopes of the next leg down were stopped out. This morning the flag broke to the downside. Traders who entered long at the close yesterday seeing a failed pattern where at a loss and most likely sold while shorts seeing the pattern finally work enter the market. Once again price moves back into the flag and some of those shorts are going to cover. Around 10 a.m. this morning we see one more break below the flag, drawing in short day traders again.

The point of all of this? HFT companies and market makers/specialists, etc are all making the spread on each transaction that is precipitated by the false or expected moves around this flag. In addition, these large institutional middlemen also get rebates (cash back) for volume they run. In a market with very little volume, the manipulation of a single flag at least 5 times in a few hours, is providing these middle men and HFT's income in a market where there are few participants left.

The point-whenever you see a technical pattern, always assume it will be manipulated.

Residential Part Two

After I posted this, "Residential Update" this afternoon, I received an email from a subscriber who works as a loan officer for a bank.


 "By the way, I would say the mortgage applications are down why more than they are letting on.  I have taken maybe two decent applications in the last month, compared to 10-15 a month up til the end of October.  Volume has dropped off a cliff with the rise in rates.  More bad news for the housing industry; as rates rise the payment goes up, which drops the amount a potential buyer can qualify for.  As a result, home prices will need to come down to a level of the buyers. In addition, keep in mind that this dramatic drop in refinance activity to nearly zero will also affect the early prepayment of MBS loans on the Fed's balance sheet.  It is this prepayment of MBS loans that the Fed is using to fund the POMO program.  Where is the money going to come from to continue the program through next year, more printing?"


Later in the day today, ZH published this article, this one straight from the Fed.


Once again today the Price/Volume relationship for at least a 3rd day was the most bearish, stocks close up on diminishing volume. At this point, the market is rising on fractional gains +.06% for the NAS 100, +.34 for the S&P-500 and +.23 for the Dow, not even a gain of a half a percent for any of the averages. This is not bullish market momentum, we haven't seen a 1% gain, which still would be mediocre, in nearly 3 trading weeks. Instead it seems that either the Fed or institutions are simply trying to keep the market green to finish the year. Remember, prospectuses for the new year need to look as strong as possible, especially in light of the outflow of funds from the market and various funds. Domestic equity funds have seen an unbelievable 33 consecutive weeks of outflows of capital. At this point, with distribution being as high as it is (3C has been showing this since August) it's no wonder with that kind of capital exiting the markets, funds must sell stock to redeem the outflows. 


This is a ticking time bomb to the likes I've never seen or even read about historically. There' no confidence in our markets, these fractional gains are proof of that and in my opinion, proof of manipulation to keep the markets green throughout the year. Jan. 3rd should be an interesting day. Until then, the cats and dogs rally (stocks like XOMA) seems to be taking hold, I'll be posting more of these trades as they tend to give large 1-2 day gains in the double digits. The cats and dogs rally in my experience has always preceded a market decline. People who feel they missed the rally tend to look for inexpensive stocks that haven't taken off yet in sectors that have done well. These are the cats and dogs and the market seems to be aware of this behavior as they accumulate these stocks and quickly distribute them into 1-3 day double digit gains.


Needless to say, residential related equities will remain on the radar as a central theme.