Monday, February 7, 2011

Today's Action

I'm going to make this short and sweet. First, there's a bunch of trades that have not triggered. I suggest setting alerts for any you like. There are a lot of great set ups there and you don't want tomiss them. The way many of our members have had a lot of success is by setting alerts. www.Freestockcharts.com is real time, free and allows you to set alerts.

Today I saw something in the market that didn't look good in 3C, I've verified these same findings in several other indicators that are similar to 3C.

The fact is, the "buy the dip" trade is extremely crowded, even today with a high probability of POMO money entering the market, we didn't see it. Statistically it's a very high probability that the money would show-it didn't.

The market structure has changed dramatically, not just because of Fed manipulation through primary dealers like GS, but through the lack of liquidity caused by HFT (High Frequency Trading firms). There simply isn't the traditional market maker/specialists there anymore as HFT's can front run them by micro seconds and scalp a penny here and there. Many liquidity providers are simply not there.

IF-really when, the market breaks, the break will be horrible as the market structure won't permit for the crucial role of liquidity providers that can give the market a break during a massive sell-off. Thus, the same way the QE 2 trade has seen only 1 pullback as I showed yesterday, there will be very few opportunities for longs to get out. They are going to caught in a severe downdraft with no liquidity to provide exits. It's kind of the bigger they are, the harder they fall. This is a failure of the underfunded and ambivalent SEC.

Whether what I saw today emerges into the eventual flash decline I believe we will see, I can't say for sure, but today's 3C negative divergences spread from the 1 min chart only all the way to the 30 minute which is rare and shows a high degree of divergence. Not to mention Dow Theory non-confirmation.

What I'm saying for now, is be extra careful in chasing market averages higher-the greater fool theory is close at hand in my opinion.

Risk management is essential during these times. And eventually, if you want to make profits quick and big, you better be comfortable with being short the market. I have many articles at Trade Guild linked on the left side about short selling-it has a bad rap that is not deserved. Any questions on any of these subjects, please feel free to email me.

Have a great day!

NEW TRADES UP O BOTH LISTS

The speculative list is sporting 17 new trade possibilities tonight, the February list has another 14 trades, there's a little something in there for everyone. Most trade are based on 3C analysis , some on swing set ups. If you have questions about any or want to see the deeper premise behind any of them, please feel free to email me. I've been looking at charts all night and it would simply take another 7 hours to list all the trades with chart explanations, but if you are interested in a particular trade, I'd be more then happy to show you.

The Fed IS Partly Responsible for Reshaping the Political Landscape of Foreign Countries.

I've said many times that the Federal reserve's main export is inflation to other nations, particularly Emerging Markets.

Yet when Bernanke was asked last week if the Fed felt it had a role in the revolutions and protests across the world, Bernanke answered as if he had never heard or thought of the idea before. It's been clear, it's been made clear by many markets-just watch China this month as it is highly likely the PBOC will raise rates in February.

Here's an article that expounds on the idea.


And the Fed maintains it is not a political entity, it's independent !

HUnderstanding a Head and Shoulders top/FXE

 Here's the H&S pattern, very rarely do they look like what you see in books, for that reason and for the reason of people not understanding the emotional aspect that forms the pattern, if is often mistaken as people rely on the price formation itself-VOLUME is crucial. We are looking at the Euro through the ETF, FXE. First to get an idea of the downside associated with the pattern, you need to measure the neckline (support) and the top of the head. In this case we get approximately $170.70 and $142.48. Deduct the neckline from the top of the head (170.70-142.48=$28.22) that's our downside target from the point in which the pattern is broken when price crosses below the neckline. Assuming a neckline of $130 (currently) we get a target near $100. Often H&S patterns will overshoot to the downside though.

 Here's the test of the pattern, volume. I've constructed a simple cumulative volume indicator to better illustrate the trends in volume. You want to see diminishing volume on the rallies and rising volume on the declines, especially as the pattern progresses, but it's not uncommon to see the heaviest volume on the decline from the head.

Here 3C verifies distribution taking place at key points in the shoulder and head tops.

FXE or the Euro seems to be finishing this pattern and will most likely break down pretty hard. There is an element of pattern manipulation, but it is usually on short timeframes and a large pattern like this is pretty reliable.

If you wish to go long, you can use the Dollar Index or the leveraged version which is UUP as 50% of the dollar index is made up by the Euro. This is why I remain bullish on the dollar in the intermediate term and bearish on Europe and particularly the Euro.

SPY Update

 The daily SPY chart has been in a relative negative divergence for some time, interestingly, today at new highs, the 3C chart did not confirm at the far right arrow.

 The 1 min chart.

 5 min chart-in the red boxes are leading negative divergences.

 The 15 min chart which was untouched earlier is looking worse

Now we have a relative and leading negative divergence all the way to the 30 minute chart today.

We'll have to watch for inflows of capital as the 5 min. chart showed a slight positive divergence

Rounding tops and the TICK Index

 Today, thus far is an unusual day in that the low POMO submitted : accepted ratio hasn't brought in a melt-up of Primary Dealer funds. This is peculiar and while isn't a definitive sign (certainly the day is not over) it's worth noting. Also worthy of note is a near perfect intraday rounding top. The price pattern is one component, the second is the rounding volume. Taken with earlier posts, this also is not a definitive sign of anything, but worth noting.

Today's TICK Index is remarkably neutral, even somewhat negative and compared to other days, it is out of character. This is the tick of every stock in the NYSE either moving up or down. We see some significant action below zero-stocks moving down on that tick.

Taken altogether, if we do not see a melt up into the close, this may be a false breakout day so we want to watch the afternoon closing trade carefully. for those with Worden platforms, you can view the Tick index intraday on a 1-minute chart with the symbol "$TICK"

Does Dow Theory Still Matter?

I think so, because it's telling us something about the market. In the first charts I want to show you the Dow -20, better known as the transports. In red is the comparison symbol for the Dow-Jones 30 index.

 Here we see relatively good confirmation between the two averages.


 Take a closer look though and you'll note the Dow 20 has broken down recently as the Dow -30 makes new highs. This is part of Dow Theory, the averages should confirm each other in their trends, Primary, Intermediate, and short term and some have added sub-intermediate. I'd say the DJ-20 has reached a short term and perhaps sub-intermediate down trend while the Dow-30 makes new highs. In traditional Dow theory, this is always a caution flag. Think about it and this is the reason that I have added select transports to the trade list; The Dow, S&P, NASDAQ, etc are all signs of the economy, that is why the stock market is considered a leading indicator. Manipulation aside, when the companies that are components of these averages rise, economic activity is thought to be on the mend or doing well, however, those goods must be shipped and if the index representing the companies that ship those goods is diverging, something is amiss.

Here, right at the breakdown in 2008, we see an inverse version where the Dow failed to confirm, but shipping companies where testing and making marginal new highs. shortly after that we saw the huge chaotic plunge into the start of 2009.
I've showed you the Baltic Dry Index (cost of shipping prices for dry goods) many times recently. Some would maintain that a new fleet of dry ships has caused the drop in shipping rates, there are a few realities to that argument, but there are a few holes in it as well. The bottom line is now we see the DJ-20 (transports) acting badly as well. Again this is the reason I've added several companies that fall in the transports industry to our trade list.

As for the averages themselves, today we have marginal highs on the Q's and IWM, but there's little doubt from a Dow theory perspective they are lagging the S&P and Dow.

This is not an alarm bell, it's a call to vigilance and to remember that bubbles creep up on you, usually when you least expect them.

SPY Updated chart request

We have some short term traders trading leveraged derivatives of some of the market averages so here's today's report. I've been a little quiet because I ran a scan and am trying to sort through about 70 different charts.

Here's the SPY
 As I mentioned to a reader earlier, it seems the accumulation/distribution cycle hasn't been very committed on the accumulation side, it's been piece meal since we saw that last blast of accumulation over a week ago on that Friday afternoon, most since has been in small pockets that are distributed fairly quickly leading me to wonder if there's something bigger at play here as the reason why they don't seem to be committing to larger positions in a more extended distribution-rally? Also I've noted as I did in a post today that the Bernanke Put or the "buy the dip" mentality has reached a level of giddiness among the bulls who have this market figured out-simple, "Buy the dip". It's this kind of sentiment in which I become very alert and watch very carefully for a change. The pundits claim-this time it's different as the asset bubble continues to build. There's all kinds of people with reasons regarding why this market can't go down and thy seem convincing-at least as it would apply to the averages themselves. However, once again it's that sentiment that always accompanies bubbles-"it's different this time" and there's no shortage of analysis that would lead you to have full faith in confidence in that. This s where the greater fool theory starts to poke it's head out. We have had numerous excellent double-triple digit gains going long and I'm not afraid to do such, just in the right assets. As you saw by my Q's post last night, that risk for a half percent over 15 trading days isn't worth it, a trade like EEE that's made 700% as of today, is worth it. However, this is a time to remain cautious and not fall in love with the propaganda. Earlier today, the 15 minute chart was untouched by negative divergences-they are there now.


 Even the 10-minute above was still in line this morning, not so anymore.

 The 5 min has become noticeably worse and is bleeding into the longer charts. This is where you have to "consider" the idea of a possible false breakout just as we saw a false breakdown in UUP-3C showed the support for UUP even as it broke down, now it's back above support.

The 1-minute chart is looking horrible and has kept prices in check and started some downside.

It remains to be seen if we get the influx of cash from PD's and the unwinding of the Treasury program, but as always it's this type of news that makes the market's rise seem like fate, that you must be more cautious then usual.

YGE Trade Alert

Take a look at YGE, it might be one to put a limit alert on as it crosses overhead resistance

 First the daily 3C is showing accumulation at the December base, a good sign. The trend hasn't been too whacky or volatile which I like as well.

 Here's the new 3C I've been fooling around with as the market is adapting and changing, we must do so as well. It's showing a positive divergence  into today's slight pullback.


 Here's the area I'd consider this a long trade, on a new high above Wednesday's highs.


And here's the Trend Chanel Stop, which will move up so I've compensated a little by lifting the stop a bit higher. Let the trade come to you, let it prove it can take out those highs and hold them on increasing volume. I'd certainly set an alert for this one around $12.32

MORE ON THE DOLLAR/UUP

LIKE I SUSPECTED LAST WEEK, THE DIP BELOW SUPPORT SEEMS TO HAVE BEEN A FALSE BREAKDOWN-THIS IS PART AND PARCEL OF THE NEW DYNAMICS OF THE MARKET.

 UUP's false breakdown seems to show significant accumulation at the breakdown-these are the false signals that we have to be aware of, they are near 85% of significant chart patterns in larger stocks.

 Here's the daily Trend Channel and the stop I'd consider using, it's surprisingly close to the next chart's intraday stop.

Here on the 60 min x-over screen, we have a positive x-over (long signal) and the 22-bar moving average where I would expect any pullback to this area to hold is around the same level as the Trend Chanel Above. I think UUP is in fairly good position right now to consider any long trades.

A Brief History of Quantitative Easing and the Current Regime's Lack of Pullbacks

You can see the effects the Fed's Quantitative Easing have had on the market. What is interesting is even though throughout Q.E. 1 breadth and volume suffered, there were still healthy market corrections around the 50-day moving average. Q.E. 2 breadth has also been horrible, but the healthy consolidation/corrections that are part of any bull market to squeeze out the excesses has been met with a totally different dynamic-the "Buy the Dip Crowd" has rushed in to buy any slight correction, never allowing for a full, healthy correction to squeeze out the excesses. QE 3 is not assured and this is starting to take on a HUGE asset bubble look in my opinion. There's no fear of downside risk, the prevailing sentiment is that the Fed will keep Q.E. coming in the form of Q.E. 3. This is no different then any of the past bubbles in which respected individuals have made the case regarding "Why the market MUST continue to move higher"-we see it every bubble. When I did my 5 part series on bubbles in 2007, the market was yet to seriously breakdown, but the signs were there. Still well respected talking heads on CNBC made very compelling cases as to why we should expect Dow $20,000. Shortly after that the market fell 50+%.

When a trade becomes too obvious and a bubble forms, you have to take these talking head experts with a grain of salt. Every bubble that I've chronicled back to the Dutch tulip Craze had the same thing in common, THIS TIME IT'S DIFFERENT" and with the market structure having broken down with few middle men able to compete with the High Frequency Trading firms and very little in the way of market participants, eventually this may create one of the most severe asset class bubble reactions we have ever seen. there's simply no market structure left to provide liquidity should a sell-off ensue and sooner or later it will happen-the Fed has made that a reality.

I know right now it's difficult to see and to believe, there are too many experts telling you why "This time it's different" and they are right, but for all the wrong reasons as the market structure has completely collapsed. The chart above is just one small proof of this fact.

That doesn't mean you can't continue to follow bullish trends, it just means you must be aware of the situation. While it is different, it's for all the wrong reasons. The SEC won't step in, the exchanges have no motivation to change status quo and once again we are in the midst of creating another bubble. How many times must one be burned before they learn.

The worst part for those who are unprepared for the eventual reality is that FEAR is a stronger emotion then GREED and for every day of greed we have seen in the market, the reality and effect of fear in a market in free-fall with no backstops, no liquidity providers may very well present one of the greatest opportunities you are yet to see in your investing lifetime.

POMO Finished

Here are the results


It looks like the S:A ratio came in at 2.77x which is well below the median suggesting the Primary dealers are flush with cash from today's operations, cash that typically makes it's way into the market around this time. We'll have to watch for the tell-tale signs of that.

Chart Request for the SPY/IWM

 IWM 1

 IWM 5

 IWM 10

 SPY 1

 SPY 5

SPY 10

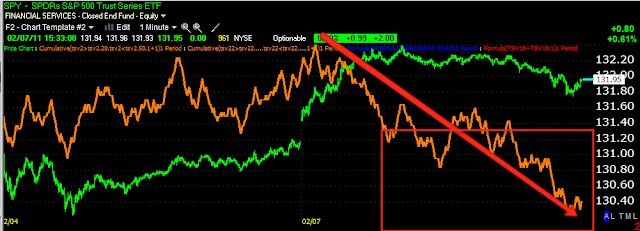
Both charts look very similar, the 1 minute is showing a negative divergence indicating we should see a pullback from the morning highs. There are slight signs on the 5 min chart point to negative divergences that are rolling in from the 1 min chart as these are quite strong in leading formation. For now, the 10 min continue to confirm the trend. It's early in the day, I haven't checked POMO results yet, but I will and get back to you as the submitted:accepted ratio seems to be very high on the predictors of later afternoon activity.

EEE Update

EEE has significant profits in it, another example of a segment of the market that is delivering returns with little in the way of manipulation from the micro second HFT firms. This is increasingly a segment that we should be paying attention to. As I showed last night on Trade Guild, despite the Fed's manipulation, the last 3 trading weeks have barely brought the NASDAQ 100 up above half a percent-it's just not worth the risk and the seemingly more risky trades are the ones bringing in the profits.

Here's my last post on protecting the significant profits in EEE, whether you caught the original move at $.61 of nearly 700% return in a little over a month or the new trade issued I believe last week, you should be at a significant profit in EEE.

It seems profit taking is happening in EEE, yet we continue to see higher highs, this is why I recommend you trail a stop behind it.

These remain the stops I feel are best suited to the trade at this time

 Either a longer trend channel stop to give the trade some room, on a 60 min chart.

Or the 22 bar simple moving average on a 15 minute chart. To really tighten it up, you can use the 10-min in yellow.

FBP-a C&D Trade

Here's a link to past FBP posts


Recently I posted FBP looked like it was about to start another leg up-that was last week.


 The 30 min chart showing good accumulation as the basis for last weeks call-

 Right now on the 1 min we see some profit taking, I view this as an opportunity.

 Here's the breakout level to start a new leg up, it would be nice to see volume pick up.

And here's the T.C. stop. You may want to adjust that depending on your tolerance for risk.


While many stocks are manipulated in the averages especially (component stocks) it seems the HFTs and PD are not interested in these lower priced stocks. I never liked recommending stocks under $10, certainly not under $5, but the market structure right now has changed and there's a segment that can be traded successfully, it calls for good risk management and not swinging for the fences, but building your portfolio slow and steady, not spiking it with volatility in your position sizing.


So for now, we go where the opportunities are, and this seems to be a segment of the market that is ripe with opportunities. All in all, thus far I like FBP for another leg up.

A Longer Term View on USO


 First the 30 min chart which showed us accumulation out of the channel breakdown...

 We see the same on the 15 min chart with recent accumulation on this dip as well.

 The 5 min chart makes it more clear and shows it to be more recent. As I stated when the Egyptian crisis started, "if USO is going to go higher because of tensions in the middle east, expect to see accumulation before they let it go too much higher" meaning they won't be without their shares to sell into higher prices, they won't miss this opportunity (they being smart money).

 Here's the trend Chanel showing two important areas of resistance and support, a break of either should be considered carefully, especially to the upside.

 The daily chart shows that there was a decent base for USO to rally from, it's still big enough to provide support in my opinion.

 Finally when looking at past pullbacks within the context of an uptrend, we have to look at a longer 100 day moving average which supported pullbacks in 2008 while oil was still on the huge Bush/weak dollar rally.

A closer look at the 100-day m.a. reveals price support and good volume coming off that support. I believe the 100-day is the average to watch with the current pullback.

Reform and Change in Egypt is Just the Start of the Chaos to Come

The market is supposed to discount the future, right now, its just whistling past the graveyard. This article shows what is likely to happen n Egypt even if reform and Mubarak is ousted. Look at Iraq years later of Afghanistan-now Tunisia. Why would we expect the fulcrum of the Arab world be any less chaotic?

Here's the latest from Tunisia

NR from last night's list-Short

NR was a limit order under $6.08-you may want to see if it can close below $6.08

CPSL Long-

Keep an eye on this one

 Good accumulation on the daily chart

This morning's 1-min chart.

German Manufacturing sends the EUR Lower

Here's a chart showing in red the start of the FX trading week.

This should keep UUP moving up.