Thursday, April 21, 2011

Not a Great Sign For AAPL

So far this has played out as I posted earlier when it was just breaking out to the upside. The failure of that breakout, as mentioned in a previous post, is the equivalent of the opposite of a short squeeze. The fact AAPL went below the apex of the triangle after a failed breakout on increasing volume is not a good sign.

Important USO Update

The Fed has a problem, the Chinese finger trap and commodities rising in price is a big part of that problem. So the Obama administration has decided to try to intervene.

Here's the full story

Here are the USO charts
 USO has broken resistance, it should be heading up to test the highs, instead the price action has become very thin today and volume is dropping off.

 Here's a closer look on a 10 min chart, the implication of a wedge like this is a move down, although black box programs would normally create a false breakout to the upside first, not sure if that will happen this time. Again note the volume.

And 3C has gone negative about the time the announcement came out.

It may be time to take profits in USO and wait for some clarity.

PCLN

PCLN is another one that has been mentioned recently, you may recall that the only thing I wasn't too keen on, was the fact that there hadn't been a convincing breakout above local resistance at the $520, area, that's happened and now the volatility is looking toppy. This would be a major trend change for PCLN and if it comes through, I would imagine there are a lot of traders in the long trade full throttle on margin as it's been trending higher for a very long time.

 Price action that is a little uncommon for PCLN. Also note the volume, the large volume spike isn't as interesting to me as the smaller clump of increased red volume.

 Here's the 1 min chart

 The 5 min chart

and the 15 min chart.

Again, there's a couple of ways to play it as mentioned yesterday, getting in here with a stop that allows for a little upside, or the more reliable confirmation of a false breakout if price crosses back below $520 or so. It's kind of the opposite of a short squeeze,

AAPL continued

Here's the earlier post about a directional move in AAPL 

Here's what has happened since..
If AAPL keeps falling an volume continues to increase, it's likely we'll see AAPL fall back into it's descending trend channel of the last 2 months.

Breadth

Here's the 2-day breadth for the NASDAQ 100 component stocks on a 1/5 min interval


 Today the count of new lows over a 250 bar period is higher then it's been recently, you may remember yesterday there wasn't much if any action on the new lows so this is a definitive change in character.

 Over a 5 min interval, the A/D ratio continues its decline from yesterday, seen on a 1 min chart.

And on a 5 min interval (yesterday we looked at 1  min as it responds faster) the % of stocks above their 50 bar 5 min moving average in increasing, while those above are falling off.

The SPY has broken below the ascending triangle, but there's plenty of room for volatility around the apex of the triangle.

Here's AAPL's break above the triangle as expected, now however, it's important to watch the action, especially volume here.

SPY Update

The SPY also looks ready for a highly directional move.

 Here's what would be considered a bullish ascending triangle, another continuation pattern that's very obvious, be aware of the high potential for a false breakout.

 The Bollinger Bands again are very tight suggesting a directional move shortly.

 3C 5 min is negative

 More importantly the 15 min is negative.

 Just to compare to other accumulation/distribution indicators, MoneyStream on a daily chart is very negative, including the move of the last two days.

 As is the hourly chart which hasn't budged a bit toward confirmation.

 The same is evident on the 30 min chart.

and the 15 min chart.

I'm going to take a look at the TICK chart and breadth next.

AAPL Action

AAPL is getting ready to make a directional move.

 A VERY obvious triangle in probably the most watched stock today. More often then not, the HFTs and the rest of the Black Box crew, break these patterns to go against what technicians believe will be the breakout based on technical analysis. Based on technicals, this would be a consolidation/continuation triangle, remember though, most of the time technicals are used against technicians so be vert wary of a false breakout here.

 Bollinger Bands with very wide volatility this a.m. and since they've narrowed considerably suggesting a highly directional move very soon.

Watch the price action around the triangle and volume especially, a break below the apex of the triangle on volume will be a negative event for AAPL.

CAT Follow Up

There's been a couple of posts on CAT, but the original idea best expresses the trade idea (click on link)

Here's where CAT stands now, don't forget to check on earnings:

 The idea was to let CAT bounce up to you and short into strength, there's a couple of resistance zones that have been broken which is what we wanted to see. The candles of the last day or two have been fairly weak momentum wise.

 Here's the 5 min chart which has been in confirmation of the move up which was expected, we are now starting to see the distribution of tis cycle.

Remember that in the original idea, an up cycle was already in play last week until the S&P leak on Friday caused the market to go short an prematurely end many cycles. The entire idea was based on the notion that Wall Street would try to recoup lost ground and finish the cycle up. This 15 min chart has been in confirmation at the green arrows and is now starting to show distribution. Distribution occurs into demand/higher prices, so if you like the trade, you can wait for a bonafide price reversal or start accumulating short shares. You probably don't want to accumulate more then 50% on your intended position and then add the other 50% on the price reversal confirmation. Personally I wouldn't mind starting to accumulate shorts here, especially on any intraday strength. Make sure you have a stop zone and it should be higher then present prices as we are seeing the start of distribution.

If you have any specific questions, feel free to email me.

Market Update

Breadth is starting to deteriorate.

The SPY has a leading negative as well as the DIA which is worse. Expect some downside action for a bit

Home Sales

I meant to publish this yesterday, but was kind of busy to get it out.


Here's the article on March Existing Home Sales

Luckily we have a diverse membership and I've always gained an interesting perspective by asking the opinion of one of our members who is in the middle of the mortgage industry and basically is what I call, "Boots on the ground". Yesterday I asked for his opinion on the report, which seemed a bit shady, but hey, there's always revisions as we saw today with the BLS.

Here was his response to my question, "What's your take on the numbers?"

"These numbers are such crap, I don’t know where to start.  The NAR has been grossly overinflating their numbers for years, just like all the other BS numbers that come out.  I don’t know what or how the calculate. But I am sure they have “seasonality” adjustments that allow them to come up with a much higher annualized rate than we are actually seeing.  This is by far the worst spring home buying season I have seen in 13 years.  Foreclosed homes prices are driving down home values.  In some areas 40% of the sales are REO’s paid in cash.  Many of these are going for 30 cents on the dollar of assessed value.  Appraiser’s are having a tough time finding sales comparisons to support existing home sales for those parties that are legitimate private party transactions.  At some point the reflective value of a home may drop significantly because the sales market will be a majority of REO’s.  Several regional banks in this area have seen 85% of their loan originators with 0 loans in their pipeline.   New rules put into place by the FED on April 1st have made loans more expensive from a rate and closing cost perspective.  This will lead to more “walk away borrowers” as their property values continue to be eroded by this spiral of death.  As you say; the system needs to cleanse itself and just take it’s medicine.  At some point real estate will be a value, I don’t see that right now and would be buyers are voting their voice by staying on the sideline.

Expect more layoffs coming in the future from the RE side of the banking industry and support industries that facilitate these transactions.  More than likely, it will be kept of the radar screen by doing it in small chunks by state rather than one company coming out and saying they are letting 20,000 people go.  I believe Wells Fargo announced they are laying off 1900 mortgage related positions in California.  Doesn’t sound so bad in small increments like this."

AAPL Update

This morning's action in AAPL is exactly why we don't chase stocks in after hours, someone was left holding the bag at $354. In a few emails I received about AAPL, I reminded members that smart money isn't going to chase AAPL in After-hours, they may however us it to sell into strength/short.

Here are the current AAPL charts and I think this one will be worth watching over the day and possibly tomorrow.

Remember, earnings for Wall Street aren't about what you did, that for main street, it's about what yu will do moving forward and AAPL's downgrade of EPS for Q3 could be seen as a problem for a company that is historically very conservative with guidance in the first place. Price will tell in the end.

For now, here's what the opening has looked like
 AAPL daily

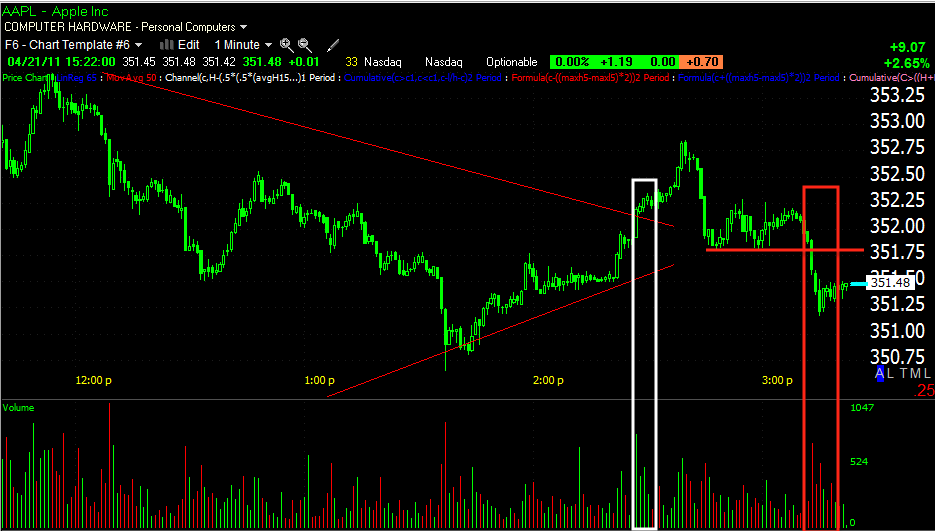
 1 min chart, very little attempt at confirmation, the negative divergence on the open has caused the downdraft in AAPL. Locals used strength to sell into, that's part A of their plan, we need to watch carefully for what part B will be.


 AAPL 5 min. Again, a very nasty negative divergence

 10 min chart, I wanted to wait a bit to see how this chart would respond before posting, it's not looking good either.

Even on the 15 min chart there's no hint of confirmation, just an ugly negative divergence. I suspected it would be possible for AAPL to breach the upper trendline yesterday as it has done so at least once, arguably twice, this certainly qualifies.