well, we are on the 5th trading day of January, the first week and the SPX is still at the worst start of the year performance in 9 years. They use to say, how goes the first trading day, so goes the year, then as goes the first trading week, so goes the year, then so goes January, so goes the year.
Don't forget we have a recent cluster of Hindenburg Omens that haven't moved yet (which makes sense considering all the year end dynamics).
What I've noticed ever since Window Dressing in late December finished, has been this almost ineffable change of character in a big way, it reminds me more of the way the market "use" to trade before QE, like in the late 90's or 2002-2006, in other words, a normal market that wasn't dominated by rehypothecated F_E_D flows. In some ways it's difficult to describe and difficult to show, it really hasn't been that long on a chart basis.
Some of the stuff from the minutes today that I found interesting were the things we noticed a year ago about what we thought the F_E_D intentions were based on little comments and slip ups here and there and especially the way they changed forward guidance from a VERY objective way to the most subjective way possible. A few things I think, only we mentioned, I didn't hear them any place else, but for instance I explained how the F_E_D (despite it's governmental sounding name and quasi-hybrid nature) is still a "For Profit" corporation that has share holders, can you imagine being a share holder in the F_E_D? I've often tried to explain the F_E_D and compared it to Bank of America having its CEO picked by Congress, but in almost every other way, they are a private corporation that differs only in that it has exclusive rights to print US currency and set certain policy (rates, etc.) The size of the balance sheet, the fact they own about a third of all US treasuries, the fact that banks need those treasuries as collateral and the US treasury's issuance is going to be lighter due to budget deficits being smaller (believe it or not), I have suspected (90%) that they were and have been looking for their exit since late 2012. The fact that this odd inter-meeting questionnaire talked about concern that the F_E_D will take "LOSSES" was a first I've heard them address that. There were quite a few other things that stood out, I'd say this is as close to the hawkish summer meeting that send the bond market nuts and sent the F_E_D back in the closet over QE for the rest of the year.
In some ways (long term and short term), we can see some of these changes. Taking the most complete, broadest view would require looking at things like market breadth over the last year which is a post in its own right.
The initial "seeming" non-volatility today was a bit strange, but it wasn't without incident. Tomorrow we have some interesting data, take the ECB's policy statement. Friday Non-Farm payrolls, but the point is, I don't think we saw the reaction to the minutes today, I think we will.
I closed up several positions because I wanted to be more in line with the strongest 3C probabilities in an environment that was for lack of a better word, opaque today, but still some things stood out.
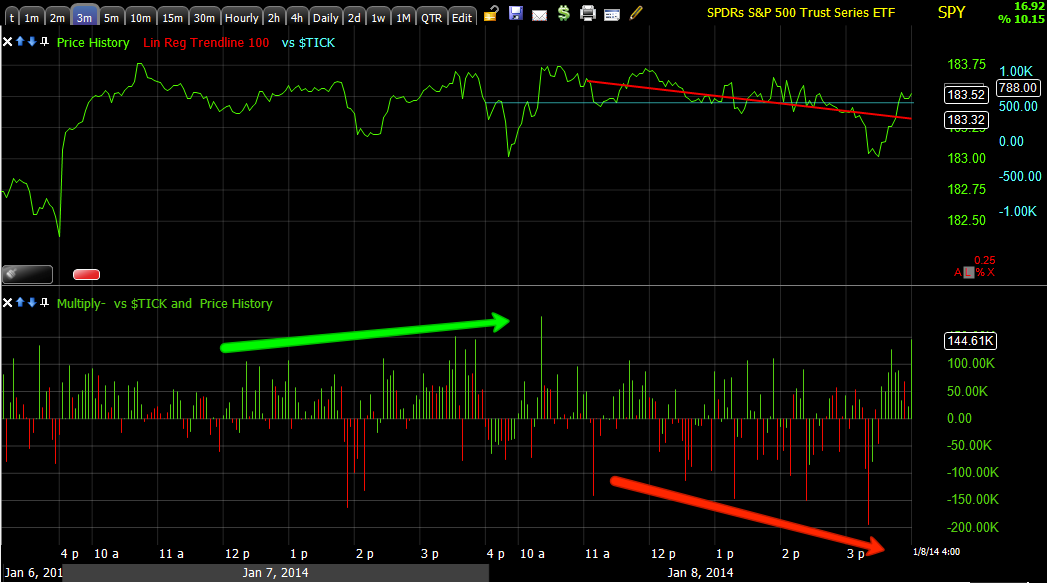
As far as the Dominant P/V relationship, it worked on Monday and last night's worked today although not much of a move. The dispersion that was missing from the market yesterday was back today, from -0.41% (Dow-30) to the other averages a fraction of a fraction of a percent just above or below unchanged, it was the TICK data in this environment that stood out.
There was no high Dominant P/V relationship today and with so little movement on a closing basis, the TICK data again really stood out.
I have a lot of charts so they may not be organized in the best possible way...
First, if you remember generally how you can tell what's going on in the market by where an asset like ES/SPX futures above, are vs. VWAP, you might look at today as the fading of the bounce (expected to be short duration) as the sales or short sales would be conducted at the upper channel above VWAP, however
what stands out today is just after the minutes were released, the break of VWAP and ES only caught support at the very lower channel (2 standard deviations below VWAP) and the EOD (which I commented on as it looked like intraday VXX was being whack-a-moled) move that looked like a desperate attempt to save the market from a fate worse than the lower channel and to at least return to VWAP by the close.
In one sense you could look at is as, "Trouble" and orders (sell side/short) came in pushing price below VWAP, the market makers/specialists would "try" to fill them at least at VWAP which is where we closed on some minor tinkering with VXX, but very minor.
High Yield Corp. Credit (an arb. asset) clearly slid on the open today and wasn't available for EOD use.
This 15 min HYG chart as it has been in a lateral range may explain why.
Charts like this are among my favorite when you see confirmation of a trend and then you seee a deep divergence, it's as if 3C is well calibrated and then you get an intense signal knowing it's well calibrated.
This signal was grown deeper since the end of Window Dressing in late December and through the new year.
HY credit which is not an arb asset, but thin enough that it is used for trades as no positions here are going to be very large went flat in to yesterday's gains after having been positive just before as a leading indicator should and today just lost a lot of ground.
Since the 10/9 lows/cycle, HY credit is leading, it was leading the SPX before the lows and the rally and then negative in to what would have otherwise been the area stage 4 would have started. Even after stage 4 was delayed and price moved above the large range, HY credit saw even more selling. On a year basis, it's much worse than this, May 22nd was a defining moment, I'm not sure why, but there are probably 20 different assets/signals I can think off that saw significant bearish changes on that specific 1-day key reversal day.
Sentiment also a leading indicator led, it led for our move up yesterday and almost immediately started losing ground as if our "Short duration" bounce was really short,
this is one of the changes in character I've noticed, the moves that use to always be extreme and serve a purpose are no longer extreme at all, this has really been true since the last 3-trading days of 2013.
Now the sentiment indicator is leading or starting to, lead negative.
TLT's (long term bonds) behavior has changed as well since the end of 2013, the correlation there was difficult to define, I'm not even sure there was one,
but now it's back to its historical legacy correlation, inverse as if its acting as a flight to safety trade which I already mentioned, US peripheral bonds and EU bonds are seeing in flows.
Intraday TLT got a big boost as the SPX lost late afternoon ground and hit the highs of the day, even on the closing ramp attempt.
In fact it's almost pure upside since the minutes came out,
safe haven flows?
VXX as mentioned, outperformed most of the day, only near the close did it underperform a bit as it was whacked to get ES back to VWAP in to the close.
Commodities have also seen a true risk off move as the SPX has been in a flat range.
I'm not sure how much weight to give this yet, but there was a time not too long ag in which commods were a true risk on asset.
This is NASDAQ 100 futures today with the minutes (yellow) and that same almost panic selling and a closing save back to VWAP.
This is ANOTHER notable change in character, the USD/JPY carry vs ES in purple, it use to be that the carry pair led the market. I could wake up, look at the carry trades and know pretty much where the Index futures would be. In this case it's clear to see that ES is leading the Carry pairs, my opinion I have shared the last week or so since I noticed this is the amount of leverage in a carry trade that is used to leverage up a fund's AUM can be astoundingly high which is great when the carry is working, but when it's not, it only takes a small move to make a big dent.
It seems that the carry trades are falling (being covered) either as a result of selling assets which is the first step or as a result of seeing assets fall and knowing that the cost of the leveraged carry going against them can sink a portfolio running 100:1 leverage.
This has made the Yen's 3C chart very important because it will be the leading indication before the carry trades register anything in price. We have a 30 min positive that sent the Yen higher (carry trades lower) and now, after I suspected a slight pullback in the Yen, we have a new positive divegrence, if taken with what appears to be the end of the short duration bounce, it makes sense and would be confirmation.
More to the point, the 5 min Yen is positive too which is important because it's a more effective timing indication,
this is why I relay on the 5 min signals of Index futures for trading positions.
Speaking of which, part of the reason I expected a short duration bounce was because of the 5 min chart going positive, as of last night it was in line with price, today, it's negative.
I'd normally take this as a signal to set up shorts so long as the reversal process is in place, the VXX is confirming and 3C is confirming in other assets,
we are close to that today, but not quite there, thus I closed long positions/trades and hedges. So that leaves the initial shorts as the bias of the trading portfolio. If we get those other signals, then I'd look at adding options trades as well as maybe expanding some of the trading positions and as you'll see, there's good reason to start talking about filling out core positions as well.
Gold which has been trading opposite the market has a 10 min positive, the 10 min negative is why I entered DGLD as a hedge position, why wouldn't I consider a GLD long here? "Consider" being the key word.
This would also have market implications, however as you know, my initial GLD/SLV targets have not been met, but they were based on market behavior and not as much on objective data.
Although the DGLD sale did not execute, as you know the SLV put did at a nice gain, this positive divergence is one of several reasons I went ahead and closed that position.
VXX 10 min shows near perfect 3C divergences/price action, today the leading positive wasn't coming from shorter timeframe charts. The white hash mark on 3C shows how much was added today alone and in to a very flat range where we most often see underlying trade as they are trying to avoid drawing attention to their set up and to keep prices stable for their fill.
UVXY's 15 min is very similar after near perfect confirmation.
This is the 30 min SPY I showed earlier (last week), this is the entire 10/9 cycle, the accumulation in to the lows, the divergence at #1 which in any other market would be more than enough to send SPY below the 10/9 lows, other indicators above went negative here too. The leading negative at #2 is very strong, the fastest, largest of the year and at least half of that was done in a single day.
Again, note the flat range.
This is what was very strange iin the NYSE TICK, yesterday we had the move up we were expecting, but a VERY thin TICK range of +500/-300, that was hard to reconsile with the daily gains. Today we are darn near flat in 3 of the 4 averages, but have very large TICK volatility from +1150/-1350, these are extremes and more toward the downside in an otherwise FLAT market.
Take a look at my custom TICK indicator for the last 2-days, also interesting, a slight positive yesterday and a clear negative trend today.
Here's the QQQ 2 min accumulation Monday as we expected the market to open down on Monday based on Friday's closing divergences and then accumulation and the move with 3C confirmation, that went negative today as I had mentioned as a high probability last night as 1 min charts were negative last night.
This is a cycle, the 4 stages, as mentioned, we see these on every time frame and that's why it's a useful concept. You have to know where you are to have an idea of where you are going.
Talk about in line and calibrated to an extreme divergence, the QQQ 10 min is something else.
This is the 1-day move in the QQQ 10 min today alone.
This is the 60 min (a huge move in such a short period on such a strong chart) IWM leading negative that started 12/30/2013 and got a lot worse in to the first week of January.
The point is the size of these flows are astounding and the speed in which they have developed and many right as window dressing or 2013 ended. Just about every where you look there's something like this.
As far as some individual assets...
I won't even comment much, just let you look at them. Remember the size of a reversal process is directly proportionate to the preceding and proceeding trend. Note where divergences are, what timeframes, how fast or deep they are and whether they had confirmation before. There's a lot of information on each chart, but I want you to be able to read it and make observations for yourself.
GS which was just downgraded by ...I don't recall who, but another big bank, I think French.
30 min...
IOC, this is in the trading portfolio as a long, it's been tough thus far, but I've stuck with it because I've seen things on other timeframes, this move on a 30 min is pretty impressive, not a impressed with the reversal process, but I think there's something here.
NFLX (which has been on hold for new or add to positions) 4 hour.
PCLN 4 hour
SRTY (Russell 3000 3x leveraged short ETF) 2 hour
URTY, R2K 3x leveraged long ETF also 30 min.
FAZ, 3x short Financials 15 min, note previous divegrences and following price trends and the size of the reversal process.
FAS, the exact opposite on the same timeframe- 3x leveraged long financials.
AAPL 30 min was perfectly in line which is why I stayed away from AAPL, a HUGE difference.
There are quite a few assets that I need to confirm before I'll make new trades, move existing ones around, etc. VXX is one of those, it develops fast as I said last night and as it proved today, so that's one, the market averages are another and Index futures which are already at a new signal.
We have the typical op-ex Friday plus non-farm payrolls which are probably the most significant data point other than inflation for the F_E_D's taper so if something happens in to Friday, perhaps a leak, that would be interesting. As I mentioned today and last night, the timing between the minutes and the NFP is about perfect for the short duration long to transition, but honestly, I expected a much stronger move than just what we saw yesterday, if that holds as being it, then as I mentioned above, the market is starting to trade much more like it did before the F_E_D got involved.
If anything changes tonight I'll let you know, right now the key futures are the Yen divegrence and UIndex futures 5 min charts.
One last note, the reason January and early January is usually such a strong time for the market is because new funds and re-working of window dressing funds are being deployed, something's missing here.