Wednesday, August 10, 2011

A Screwy Market

The SEC MUST address High Frequency Trading, it causes excessive volatility, it puts the little guy at a disadvantage and if left unchecked, will ultimately result in a few machines trading the market via all kinds of manipulation and have nothing at all to do with the reason the stock market was created.

When the NASDAQ alert went out 24 minutes before the close, one channel handling tickers "S"-"Z" was only about 7% away from a reset, I'd love to know how close we came on a closing basis, and thus you can see how short term manipulation can move markets. What their intention was, is still an unknown, I can think of at least 3 possibilities off the top of my head, from essentially front running trades of sort, to forcing prices down lower to buy, to just forcing prices down lower.

What was an outwardly ugly market today, did show something unique and interesting, a type of inside day consolidation. Take a look.

 This is the potential Inverse Head and Shoulders bottom I mentioned earlier today.

 Note that all of today's trade, every second was a sort of inside day, contained within the last hour or trade from Tuesday as you can see in the red box; an inside day-type consolidation.

 This is the reversal that got the ball rolling to the downside, this was a pretty clean reversal, but still took 3 days, rarely do we see "V" shaped reversals, especially in this market. One of our members turned $2k in to $22k on the 3C signal for this negative divergence.

The second divergence is the one above, the former one was also about 4-days.

The Price Volume Relationship today was DOMINANT-Price Down/Volume Down, of the 4 possible relationships, this one is the most ambiguous, and the most common P/V relationship seen throughout bear markets as volume tends to be low. It can also be interpreted positively as it shows there was selling, but not aggressive panic selling. You may wonder why we see a Volume Down Dominant relationship with the Quote Stuffing, it's because they are quotes that are cancelled, they never were meant to be filled, vs trades that were filled.

Interestingly, CSCO's after hours earnings release beat, but not by a huge margin, actually an uneventful margin, however the stock is up nearly 7.5% in after hours trade and as high as 11%.

 CSCO's close, vs. the after hours bid/ask (light blue hash marks)

And on an intraday basis...

Here are some of the charts I watch in my nightly analysis.

 This is a price volatility indicator I've been fooling with for awhile, the green hash marks are price above the volatility stop, the red are below the volatility stop. Note the IWM showing green the last 2 days. Also my Trend Channel has gone from down to flat with what would be a short cover signal coming in yesterday. This is an interesting indicator and I think will show some promise.

 I'm not a huge Fibonacci fan, but it was interesting to note the 2-day chart posted a Doj candlestick reversal right at the 50% retracement from the 2007 high to the 2009 low with capitulation type volume.

 As mentioned earlier today, the hourly SPY Bollinger Bands are pinching, indicating a highly directional move soon.

 I have fooled round a bit with Demark indicators and created a few custom Demark indicators so I didn't have to follow the count. This is a 3 day chart, with some interesting buy signals, including recently.

Here's the 2-day version of the same indicator. There have been numerous intraday signals as well.

I'm going to eat and get back to looking through the market and specifically at breadth indicators. This is a pivotal area and right now I want to find as many pieces to the puzzle as I can. Check back later for another update.


QUOTE STUFFING WAS JUST THE START

When will the SEC finally create some kind of rules for HFT, like "Every trade must be executed by  human"? That would be nice. The Quote Stuffing that coincided with the end of day sell-off was so out of control, that NASDAQ almost had to reset their system!  To understand how close we were, this message was sent out 24 minutes before the close, what the final tally was, it may have been very close (you'll understand). Here's the details from NASDAQ...


Monday, August 08, 2011

UTP Vendor Alert #2011 - 2
UTP SIP Reminds Firms of Message Sequence Reset Procedures

Products Impacted:

  • UTP Quotation Data Feed (UQDF)

Contact Information:

What you need to know:

  • Given today’s extraordinary market conditions, the UTP Securities Information Processor (SIP) processed more than 92.5 million quotations on the UTP Quotation Data FeedSM (UQDFSM) Channel 6 (NASDAQ-listed symbols S to Z) during normal market hours.
  • As outlined in the UQDF data feed specifications, the UTP SIP has a message sequence number limitation of 99 million quotation updates per channel per day.
  • If the UTP SIP processed more than 99 million messages for a single data channel, it would need to exercise the sequence number reset procedures as outlined in the UQDF specification document.
    • When the UQDF message sequence number hits 99 million, the UTP SIP will disseminate a Category C – Type L reset event message on the affected UTP data channel.
    • Following the reset event, the UTP SIP will restart its message sequence number count to zero for the affected channel.
    • Please note: The UTP SIP will be unable to process retransmission requests for data sent prior to the reset event.
    _____________________________________________________________________________ I personally have never seen this before, but with HFTs going berserk in to the close with fake orders, it's not hard to imagine why.
Essentially, for tickers that start with "S"-"Z", there's a dedicated channel to serve up to 99 million quotes for the day, at the end of the trading day it is reset and starts at zero, however today there was so much quote stuffing that the NASDAQ was only about 7% away from a system failure that would have forced a re-boot during the trading day. What the effects would be, I'm not sure anyone knows. One effect would be all previous orders would be nullified as they are essentially erased. Apparently there's some that think you wouldn't be able to even get a quote, much less trade.


More Quote Stuffing

Here's the link to the action


And here's an explanation of the practice...


Some in the market suspect the flood of orders is the result of high-frequency traders attempting to profit from tiny discrepancies in stock prices. They say waves of orders slow down electronic stock-trading networks or otherwise distort stock prices, creating profit opportunity to buy or sell at artificially high or low prices.

Intraday reversal...?

The Q's and IWM look like it
 IWM

QQQ

Testing Support

The SPY below looks to be testing support

 The 50 bar 15 sma has been resistance through the entire downtrend, it was broken yesterday and again today, it has also flattened out, there should be some support at the trading range and at the moving average.

Which could also be setting up an inverse H&S short term bottom, volume will be important moving forward on advances.

PM's

The short term charts of SLV and GLD look like a downside correction is coming, at least on an intraday basis.
SLV intraday 3C chart has gone quite negative

GLD's signal is a bit longer term.

Bollinger Bands starting to predict highly directional move

Here's the hourly SPY Bollinger Bands which have showed very heavy volatility, but are now narrowing, which is indicative of a highly directional move. You may want to keep an eye on these bands set to 20/20 on the hourly chart, it looks like an explosive move may be coming.

IWM Update

The IWM has been locked in a bearish descending triangle most of the day, of course we know how Technical Analysis views these patterns and how Wall Street disrupts them.

 Breakout from the consolidation

This chart shows the descending triangle better as well as a 3C positive divergence most of the day.


Euro

The market is clearly benefitting from a stronger Euro and weaker dollar, earlier I pointed out the Euro seems to be tying to get a foothold after a pretty strong/fast sell-off this morning.
 1 min 3C FXE (Euro Trust)

 5 min UUP (Dollar Index)

In white, the FXE/green the SPY. Note the correlation between the two represented by the red trendlines.

3C indications

Much like yesterday (and I suspect today is caused by range bound trade as 3C makes comparisons to money flows at different relative levels and when a market is in a tight range, those comparisons are harder to make), the intermediate to longer term harts (10, 15 and 30 min) are the strong charts today, many have gained in their leading divergences today.

Here's a visual representation of what I mean.

The 10 min QQQ 3C chart is at a higher level today, then compared to yesterday's closing highs, although price is off by 2.35%. This is a positive leading divergence.

LDK Follow Up

Earlier I mentioned LDK as a possible long on a pullback to the 10-bar s.m.a on a 15 min chart, it just completed that pullback.


The 22 bar sma on the 15 min chart (blue) can be used as a potential stop.


GLD Update

GLD's problems are not as evident on daily charts as they are with intraday action.

 GLD's breakout met by a negative short term divergence and a negative leading divergence.

Currently there's a small flag sitting at support, I would expect an intraday bounce off this area, but I will continue to keep an eye on it.

Trade Idea VICL (Long)

VICL is a trade that we were in 3x, the first time was March 9th and made 103%, there was a May 9th trade that gained 22% and a 5/27 trade that made up to 33%.

Right now it seems to be putting in a short term bottom and looks like a potential swing trade.

 Daily chart

 Potential intraday base

 3C 15 min

 3C 10 min

It would be bullish to see a breakout above the 50 sma on a 30 min hart, around $3.91, but I like the risk reward scenario here, with a potential stop around $3.61, there's about $.10 risk and a swing target of about $4.25, a nearly 6:1 risk/reward ratio.


Trade Idea LDK (Long)

This may be good for a day trade or a swing trade. LDK appears to be effecting a short squeeze.

 Price action looks like a short squeeze.

The 30 min chart has given a long signal, I would look it trying to get a potential position at a pullback around the yellow 10-bar moving average on a 30 min chart.

Market Update

Since the 11:10 "early divergence I pointed out, 3C has stayed positive and the SPY has done a pretty good job of holding above the down trend line.


The original divergence at 11:10 at the last update in the white box, and a continued positive divergence in the SPY and other averages. The red trendline is the downtrend line from the decline from 8/3.

The Euro has been selling off since before the open on concerns of a French sovereign downgrade, being 1 of 6 E.U. members holding a Triple A status. It seems the Euro, which has put upside pressure on the dollar, may be finding some footing.

Market Update

It looks like we may have our first positive divergence of the morning, it's young and still early, but it's there.

 SPY 1 min p. divergence.

 VXX 1min negative divergence

VXX 10 min chart, bigger picture is bearish, the early upside action didn't mov 3C at all, non-confirmation.

The DIA is also showing a early positive divergence.

Goldman's Read of the FOMC-QE3 Coming !?!?

The Story


"We now see a greater-than-even chance that the FOMC will resume quantitative easing later this year or in early 2012. We have changed our call because today's statement suggests that the committee's reaction function to incoming economic news is more dovish than we had previously thought," said Goldman's chief economist, Jan Hatzius.

SPY Update

The SPY is still grappling with major support/resistance, which is often the case when an important level is first broken.


The Intraday TICK Chart Seems to be Firming Up

Silver Follow Up

Yesterday in this post I showed you this chart of SLV
 The long term hourly chart suggests something may be quickly changing with SLV.

 Yesterday we had an intermediate term signal as well

And a short term signal, which is good confirmation and SLV is higher this morning by 3.3%

I'd like to see a retest of support or recent lows to confirm the signal, but so far, Silver looks like something has changed since it turned down in early August.


DIS Taking A Beating

The happy's place on earth is down around 13% after reporting earnings last night, not helpful for the Dow.

NYSE Rule 48 Invoked Again...

France at Risk of Losing AAA Rating

Here's the WSJ Story, if this were to happen, it would be game over for EU bailouts.

Scenario 3, Sort Of ?

On Thursday, August 4th, I wrote this long piece in which I laid out 3 scenarios as to why 3C continued to show positive divergences, despite the market falling-this is the nature of 3C signals, to contradict price movement and depict underlying institutional movement.

I also posted this piece about some difficult calls I've had to make with 3C when everything seemed to be against 3C, however they worked out, A Controversial Call

So timing wise, thus far it seems Scenario 3 is the winner, but we still have to see follow through buying. The idea was that the Fed would say something that would get this market turned around. The meeting between the Fed and the large Wall Street Investment Banks/Primary Dealers preceded the sell-off by one day.  I still believe some plan was put into motion then, I've seen too much manipulation, leaked information and actual documents over the course of my trading to believe otherwise. The fact 3C works at all is a testament to this belief.

However, I was as shocked as most with what the Fed did and didn't say. First lets take a look at what the Fed did say, and if you like, HERE'S A LNK TO THE FULL FOMC RELEASE TODAY.


Instead of QE3 or some other out of the box, market supportive statement, the Fed essentially admitted failure, they admitted that QE1/QE2 did not work in saying,

"Economic growth so far this year has been considerably slower than the Committee had expected."


"Household spending has flattened out, investment in nonresidential structures is still weak, and the housing sector remains depressed."

They admitted temporary factors such as the Japanese Earthquake, were less significant then they had previously telegraphed.

The outlook on growth and unemployment could only be called, "pessimistic". This sounded like a Fed admitting failure and that they had few options left to deal with the economy.

I noted today, "Beware of the FOMC knee jerk reaction". There really didn't seem to be anything substantive for the market to grab hold of and get excited about. The only thing I think, and this is important and was telegraphed by Janet Yellen back in late February when she said that, “forward guidance” would be the next tool used by the central bank-she was right!

The Fed certainly gave a realistic view of that and the FOMC said it would keep the target federal funds rate at between 0 and 0.25 percent, where it has been since December 2008. And -- here's the news -- given the current environment, it is promising to keep them at this level "at least through mid-2013." In other words, the central bank is committing to keeping the interest rates it controls at this exceedingly low level for another two years. This may have been the kicker; ever hear the saying, "When the missiles fly, it's time to buy"? It has nothing to do with war, it has to do with the build up to war and the uncertainty, when war breaks out, there is certainty and if there's one thing the market hate more then anything, it's uncertainty.

In keeping short term rates low for a CERTAIN period of time, the FOMC is creating an environment where banks have a window of nearly 4.5 years of nearly free money-Certainty was assured today in an unprecedented way by assuring the market that they will not be withdrawing the extraordinary measures of cheap/free money at least until 2013. The FOMC by saying this, is also saying they feel inflation won't be a problem for this period, whether that is true or not, remains to be seen; the Fed's forecasts have been dismal at best.

As I warned of the initial knee jerk reaction, the market headed lower on disappointment, having expected some hint of QE3. I don't know if the market rallied after that because they realized that the certainty factor was in place, I suspect this has more to do with the chess board being set up well in advance and institutions as well as the Fed's PPT went to work in the market creating support and crossing some levels that initiated short covering. The idea of the 3C divergence is just that, the massive rout in the market has a lot of people short using record levels of margin, should those shorts continue to lose money in a rising market, the margin calls and short covering alone would be enough to create a break neck rally. That's what Scenario 3 was all about.

As I have said recently, tops are volatile and the closer we are to the second shoe dropping, the more volatile they get. Yesterday was interesting in the fact that we saw what in my view was unprecedented capitulation as outlined in this post from last night.

Also interesting was the convergence of Greece and South Korea banning short selling for two months on the same day as the FOMC policy statement. Furthermore, last night's futures signaled an epic plunge in the markets today, before reversing and moving in to positive territory, this was sure to take out stops, draw in shorts and stop them out as well and create an accumulation area for Wall Street.

Should we see follow through on this move, we'll have a good idea of exactly why 3C has been showing a positive divergence and that alone should speak volumes as to how the market really works.

As far as today's price action, 3C did a good job of calling the weakness before the FOMC announcement. I watched the market nervously, but expecting a bounce off the lows as the knee jerk reaction to FOMC announcements is almost always wrong.

advancers for every 1 decliner, a huge change from yesterday. The NASDAQ Composite had 2237 advancers vs. 461 decliners and 65 unchanged. The NYSE had 5475 advancers and 1437 decliners. The Dow had 29 advancers and 1 decliner, a near mirror reversal of yesterday. The NASDAQ 100 had 7 decliners vs 93 advancers, another near mirror image of yesterday. The Russell 2k had 1546 advancers and 403 decliners. The S&P-500 which had 500 decliners yesterday, had 471 advancers today! Of my 5+% gainers, there were 1250 and -5+% decliners came in at 162.

The dominant Price/Volume relationship today was Close Up and Volume Down for the NYSE components, with second place, Close Up/Volume Up at 1215. The NASDAQ 100 had 79 stocks at Close Up/ Volume Down. The Russell 2k was Close Up/ Volume Down at 1236 and the S&P-500 had 384 at Close Up/ Volume Down.

Typically this dominant relationship is bearish, but considering yesterday's huge volume, the relationship doesn't concern me at this point, especially considering the cautious trade ahead of the FOMC statement.

Of the 239 MorningStar Industry/Subindustry groups, 230 posted gains and only 9 posted losses-again, a mirror reversal from yesterday and one of the strongest days I've ever seen in this respect; 202 posted gains of 2% or more, 77 posted gains of 4% or more which s exceptionally strong considering these groups can have hundreds of component stocks. Some of the top gainers included Retail 8.48%, Aluminum 7.9%, Internet Software and Services 7.27%, Regional Mid-Atlantic Banks 7%, Heavy Construction 7%, Broadcasting/TV 6.92%, Major Airlines 6.7%, Residential Reits 6.69%, Credit Services 6.38%, Copper 5.85%, Mortgage Investment 5.68%, Money Center Banks 4.71%, Financial Services 2.95%.

Losers included: Manufactured Housing -5.67%, Wholesale Building Materials -2.86%, Home Health care -.53%, Residential Construction -.30%, Toy and Hobby Stores -.20% and Long Distance Carriers -.08%

As you can see, even the losers weren't that bad.

The Charts:

GLD
 Today was another day n which GLD gave up its opening gains and came in on a .92% gain on the day.

 The short term 3C chart did an excellent job of tracking underlying Acton in GLD.

 The 15 min chart which called a recent move higher, is negatively divergent at today's highs.

 The hourly chart still looks rough.

As does the daily

DIA
 As mentioned, it was the intermediate to longer term charts that were giving the signals while the short term charts were caught in the volatility, however this is important because usually 15,30 min charts don't move this fast unless there's very strong underlying action in the market. Here the DIA 15 min chart puts in a higher positive divergence at today's afternoon capitulation

 The persistent positive, leading divergence on the DA 30 min chart, also note the leading positive divergence as afternoon capitulation took hold.

DJ-20 Transports
 The long term positive divergence on the 30 min chart, with a huge uptick this afternoon

IWM
 Again, it was the 15 min chart that put in a leading positive divergence at afternoon capitulation, a very strong signal.

 Even more impressive is the way the 30 min chart went in to leading status at the afternoon lows.

QQQ
 QQQ 15 min chart

 And the long term 30 min positive divergence, which suggests we have more upside over the coming week/s
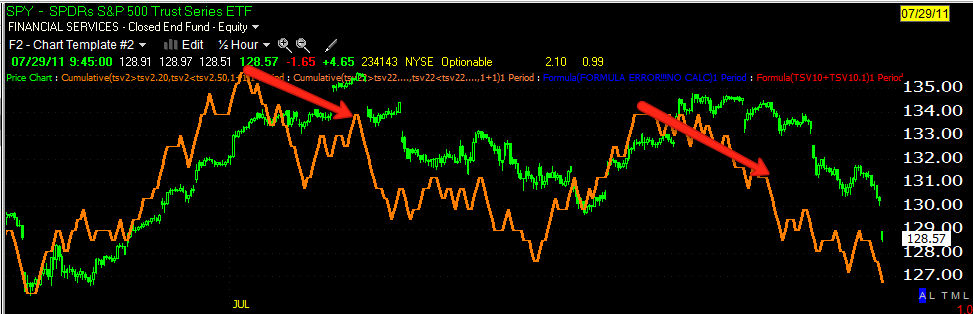
SPY
 SPY 10 min leading positive divergence at the lows of the day

 As I said, it takes a lot to make a 30 min chart move this fast, usually it is a process of days.

 The 15 min 50 bar average has been resistance throughout the downtrend, decisively broken to the upside today.

FAS-Financials 
 Another impressive 30 min positive divergence puts financials back in the game

 The 5 min chart was pretty sharp at picking positive divergences at the lows.

FAZ Bear Financials
 Negative divergence on a new high, a typical reversal/head fake trapping longs who bought the breakout in this inverse ETF.

 Again, a negative divergence at the highs, which also showed volume churning

FCX Copper, often a leading indicator
 15 min chart

 10 min chart

FXF-one of the safe haven trades I've been watching
 A nasty daily candle

 3C going divergent at the highs

 a sharp 5 min negative divergence at the highs today

TLT Another Safe haven trade
 Today's daily candle looks like churning in TLT-Treasuries

 An RSI negative divergence at the highs, churning on high volume

 3C also calling the negative divergence at the highs

UUP/$USD
 Falls sharply on a 3C divergence and volume
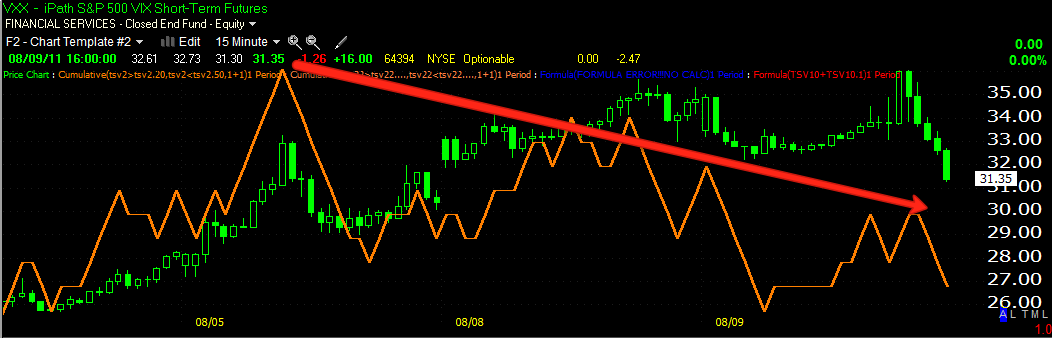
VIX
 VIX puts in a reversal formation today

 VXX-good thing I updated the stops last night on this trade, another example of a negative dvergence at new highs on heavy, churning volume

 3C 15 min quickly going negative at today's highs.

XLK Technology
 The long term 15 min hart, note the red negative divergence that started this rout in the markets compared to the size of the positive divergence. This seems like a well planned out market rout.

A sharp 10 min positive divergence on afternoon capitulation.

As you can see, the long term positive divergences are quite large and suggest that we have quite a bit of upside. Yesterday's unprecedented capitulation was another serious warning of what was to come today. It looks like we have the reversal 3C has been suggesting, if 3C's positioning tells us anything, the upside should be substantial.

Lets see what tomorrow brings.