" I'm leary of taking trades in either without VERY strong conviction, but as I said, it seems something is going on, even though it may be early in the process."
By Thursday (April 4th) we were opening partial positions at the very lows of the move, on Monday of this week were were able to add on a small intraday pullback. Today as luck would have it, Silver and Gold both had their biggest 1-day move in 7+ months. AGQ produced about an 8% gain which isn't bad for 3 days. I still like both silver and gold (although they truly are my least favorite asset to trade so you know there's something I really like) and will be looking to add those positions back, hopefully at better price with less risk and another high probability move.
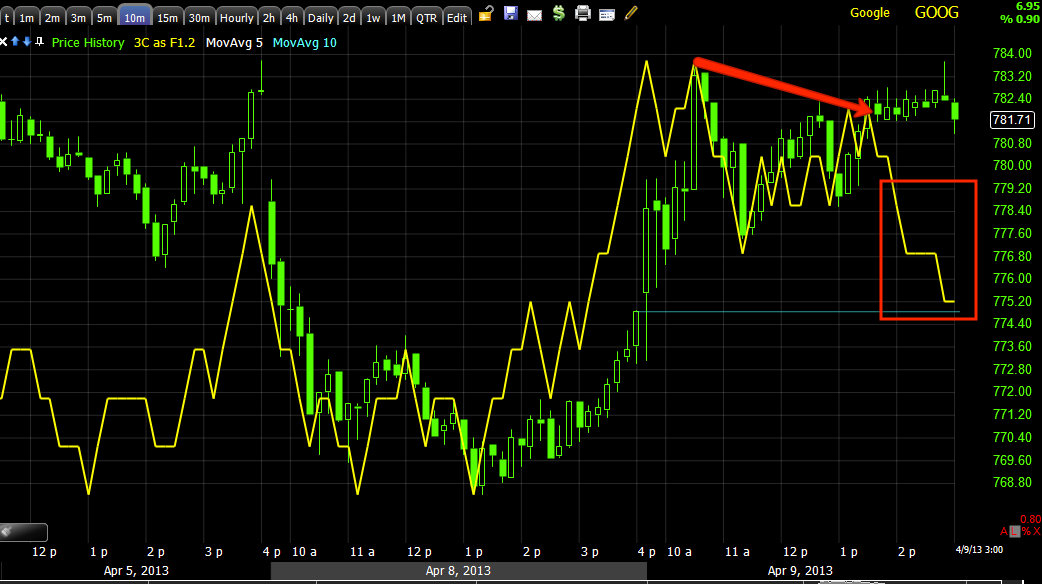
Quite a few other positions were closed today including GOOG Calls with an add to position yesterday and some of you opening new positions yesterday, I mentioned them as a buy again this morning around 10 a.m., those calls closed out today brought an 82% gain, again not bad for 1 day.
We saw improvement in AAPL today and expected an intraday move, but for the second day it just didn't feel right for the move I've believe it can produce.
We lightened up on some other long positions like the IWM weekly calls (expired this week) closed at 1:41 and within a few cents of the IWM's top today; for a +50% gain.
Today also saw the opening of a couple of new positions with weekly puts including QQQ $69 and IWM $92 puts that are already at a profit of 20+% today.
Taking a look around, after yesterday's algorithmic abuse of the market when literally no one was looking, volume today wasn't much better.
It's become fairly easy to see when levers to "help" the market are being pulled,
Yields seemed supportive earlier in the day, but by the late afternoon highs they went the other way and finished unchanged on the day.
High Yield Credit which also had been supportive recently went about as far as it was going to go by 10 a.m., it wasn't moving to help the market at all from there, but unlike HYG, HY credit is not nearly as liquid and seems to break off first. Speaking of Credit, Junk Credit (JNK) which is a high yield credit as the name would imply, according to State Street saw their 2nd biggest withdraw ever from the $11.6 billion fund. Three percent of the JNK fund was redeemed, however shares are not reflecting that drop in shares. Apparently the last time this happened was 2012 right before a 9% drop in the SPX.
Investment Grade Credit was bid up today, which is typically a flight to quality or safety over their High Yield Cousins, this chart shows the performance in to the afternoon.

All in all it was an active day, it had the feeling of yesterday's manipulation, except today didn't seem to be as algo driven and the levers like TLT, HYG and VXX were VERY obvious in their use to lift the market.
Transports continued their separating to the downside from the Dow-30 (something that the pundits were big to note earlier in the year-the Dow Industrial and Transports correlation) with the Dow-30 closing at +.42% on lower volume and IYT closing at -0.35% on heavier volume.
Many would agree that the performance of the Russell 2000 vs the SPX is even more worrisome. Any risk on move should be led by the R2K, as mentioned last night I believe, even Bernie cites the R2K and not the SPX in Congressional testimony as to the "Wealth Effect". The R2K is a broader index, it has a large diversity of industry groups. Before the markets were so manipulated, one of the criteria we used to judge whether a rally had legs or not was how the R2K performed.


Today's closing candles saw a small bodied SPX close with intraday highs seeming to run in to resistance from 3/28 and 4/2, the SPY formed a perfect star (small bodied candles represent indecision/loss of momentum).
The DIA formed a Star, although it has seen quite a few in that range of see-saw up/down in the market that lasted 14 days before the pattern being broken today. In fact I only count 3 days of the last 18 that weren't either stars or smaller Dojis.

In fact on a Dow weekly chart, something interesting emerges as well (it's good to compare as many different charts as you can-differnt timeframes being a great way to get a different perspective)

After yesterday's Dominant Price/Volume Relationship which was Close Up/Volume Down, which is the most bearish and typically indicates a 1-day overbought condition with the averages seeing the next day close down, the R2K met that standard, but the other three averages did not.
Today there's a dominant theme in the Dow and the NASDAQ 100, both Close Up/Volume Up. The relationship is considered the most bullish of the 4 possible relationships but after yesterday's lowest volume of the year (excluding holidays), that's not saying much to close with volume up. The relationship is also the strongest 1-day overbought signal with the averages typically closing down the next day. The Russell 2000 and 3000 as well as the SP-500 had no dominant Price/Volume relationships which doesn't tell us anything.
Among Leading Indicators, we already mentioned credit, commodities closed well, partly from the boost from 7 month high closes in silver and gold, the other part is said to be because of lower than expected inflation readings out of China overnight, however I suspect it had more to do with PM's very bullish action today and the $USD's very weak action today.

As mentioned above, Junk Credit traded almost exactly in line with the SPX..

Here's a chart better illustrating it.

Here's VIX Futures being manipulated to help the market higher...

Here's another way to show the manipulation of VIX futures, just compare the futures to the VIX.


As mentioned already Yields were initially supportive, but they gave that up at 1:20 p.m. and made a lower high in to SPX top around 2:50 p.m.
Also High Yield Credit as mentioned was initially supportive, but decided not to move up any further around 10 a.m. and closed the day flat, never having made a higher high after 10 a.m.
As you can probably guess from the $USD's performance, the Euro was supportive of the market today, however in the afternoon it started or the market started trading almost exactly like each other which was curious.
In addition to that curiosity, it looks highly probable that the market became very sensitive to the Yen as well.

Note the SPX topped out just as the Yen bottomed out.
Among some other interesting things, in addition to the 3C charts I posted near the close, this Money Stream chart is interesting as well. These charts largely confirm the 3C charts of the averages.


I have some other charts to look at and I'll post futures as they develop a bit more as well as currencies if there's anything interesting.