Friday, February 3, 2012

Santelli on the NFP

Here it is, as we figured, pure manipulation.

End of Day Sector Rotation Gets Defensive Again

Financials, Basic Materials, and notably, Technology are all falling off, Utilities, probably the most defensive sector has been notably strong today, we don't usually see that on a risk on day as allocations tend to be more aggressive. Industrials are also picking up, which may be more of a rotation in to blue chip names. Energy has been climbing all day, I have little doubt that crude oil/USO has contributed to the turn around in Energy coming off a bad day yesterday(actually a string of bad days) as it fills the gap today.

As I expected just an hour ago or so, AAPL is showing weakness in to the close.

The NYSE Tick Index has been surprisingly mild today, after hours breadth will probably explain what's going on there.

Both GLD and SLV are down on the day, SLV has not broken it's trendline, but is very close to doing so. Other commodities have done pretty well including steel and copper, most probably as a result of the NFP print because the $USD is literally unchanged on the day.

The AEO short idea from yesterday still looks good, yesterday's long idea, GALE is up 30% on the day and up 43% since the idea yesterday and on increasing volume.

I'll give you the internals/breadth after the close.

TrimTabs Take on the Non-Farm Payroll

ES Update

I have been waiting for ES to do something before posting it,


AAPL

AAPL which is uncharacteristically underperforming the NASDAQ 100, just saw a pretty large break in volume.
 The most recent volume spike is in the area as an earlier spike, almost exactly. This is likely not smart money moving around a position so much as sending a signal to traders.

The charts below show AAPL has been negative throughout the day.

 1 min

 2 min

5 min

I would expect some downside movement as we move toward the close.

GLD Update

 From the earlier update today, it looked like GLD would break this channel, which as pointed out is slanting the wrong direction for a consolidation, something you may want to make note of for future reference, a consolidation develops counter to the trend. In any case, it seemed it would break this lower support line and it has done so.

 Here it is on an intraday basis, after testing resistance a few times, it broke pretty hard.

 This is the negative divergence when it first looked like it would break and this is what confirmation of the trend looks like, I pointed it out in some of the long trades we have that are making 30% in 3 days and here it is again, 3C is in lock step with price which is confirmation, something that has been long missing in the market's move.

This is the long term 60 min chart, which is what alerted me to the possibility of GLD reaching the top of its correction.

GLD is moving closer to a fairly high probability short, although I would not take a huge position in it as it may see safe haven buying in the days to come. On a longer term basis though, it still looks like either a primary or intermediate top .

PFE Trade Update

PFE was a trade idea from Jan 31, so far it's doing better then it looks, being down everyday since the idea despite the market. These trades that buck the market, even a little are usually the ones that really gain steam when they align with the market.

 This is what PFE looked like on Jan 31st as of the close. RSI was negative as well as 3C and it appeared we'd see a nice rounding top develop.


 This was the X-over screen short signal on the same day with RSI negatively divergent as well.

 This is PFE as of today and still looking good in the Trend Channel, which I would continue to use as a stop, currently at $21.70

 I would consider a new position or an add to on any strength toward the yellow 10-day moving average as this is rounding over beautifully.

Here's volume rounding over as well.

Because of its size, PFE is a good candidate for some long dated Puts.

The Greek Drama Is Coming To An End

The bast description of the Euro-zone out of Davos was that of, "A slow motion train wreck". Not only does this describe the immensity of the ordeal (look at the world financial global ramifications of Lehman and now imagine instead of a company, it's a country), but it also implies that we all know what the outcome of a train-wreck will be, in so far as to say, horrific.

As I made mention earlier in the week when the market took off on Wednesday from a bogus rumor about a Greek deal being done in hours (which we have hear dozens of times, this time the market acted out of character), when in fact we already knew from the day before that Greece and the Troika had reached an impasse which was forcing the Greek PM to schedule an emergency meeting as soon as Thursday. That meeting came today as mentioned in an earlier post, in which the new G-Pap threatened to resign if he could not get all 3 Greek political  parties on board to cave in to the Troika's demands so Greece wouldn't become the first developed nation in 65 years to default. It should be noted that in this new age of globalization, there is no historical precedent for such an event.

It seems that PM Papademos may have to resign as the meeting today didn't go too well.

The FT reported


Greece’s leaders oppose new austerity measures


All three party leaders in Greece’s teetering national unity government have opposed new austerity measures demanded by international lenders, forcing eurozone finance ministers to postpone approval of a new €130bn bail-out and moving the country closer to a full-blown default.

The further austerity cuts demanded by the Troika for them to consider the next tranche of bailout money that Greece needs in order to not default in March, have been rejected.

The Greeks did make a counter proposal that the Troika has rejected.

I was going to write last night about the rift between Germany and France as Mer-Kozy are no longer very cozy with the French President opposing the German plan to have the EU administer Greek Finances. Along those lines, the meeting set up by what is essentially the new Troika, included Germany, the Netherlands, Finland and Luxembourg, notably absent was Sarkozy's invitation.

As things stand as of this moment, if the new bailout is not approved in a matter of days, Greece WILL default and I don't think there have been too many EU summits on making that an orderly default.

With each side now firmly dug in and refusing the other's demands, it seems that the slow motion train-wreck is about to make impact.

While Credit, as shown in an earlier chart today makes a run for the hills, equities march on as nothing bad can possibly happen. However the underlying tone has been some of the worst I have seen, which implies that the equity market does know what's about to come and they are using this time to take full advantage of it. 

As I have relayed to a few of you, I use to get trading research papers from a well known large Wall Street investment bank via a person close to me working there. I thought they would provide a huge edge, but nothing in the papers made any sense, the investments they were buying or selling were not moving and I chalked them up as useless until I stumbled upon them a few months later, then everything made sense. The point being, Wall Street works a lot further in advance then you would imagine.


Quick Market Update

I checked a little further in to those triangles...
 DIA

 QQQ

SPY

Their clear enough not to need annotations.

Triangle

The main averages all have a small triangle, similar to this one in the SPY
Although volume is wrong for a consolidation at least in the SPY version, I suspect this triangle will mean something as whenever volatility pinches like this, it typically produces directional moves.

Money Center Banks / BAC

Remember the negative divergences this week in BAC? As is often the case, we can see what is going on, but usually don't find out why until later.

We found out why today.

Bloomberg Reports:

Bank of America Corp.Wells Fargo & Co. and JPMorgan Chase & Co. were sued by New York Attorney General Eric Schneiderman over the creation and use of a mortgage database.


The banks’ use of the database, known as MERS, has led to deceptive and fraudulent foreclosure filings in New York state and federal courts, Schneiderman said in a statement today.


“The banks created the MERS system as an end-run around the property recording system, to facilitate the rapid securitization and sale of mortgages,” the attorney general said. “Once the mortgages went sour, these same banks brought foreclosure proceedings en masse based on deceptive and fraudulent court submissions.”


So where does this leave the foreclosure settlement? Probably a moot issue now as the NY AG just set the precedent. 


I suspect Wall Street didn't just find out today that this was a likely outcome. Here are the charts of the 3 major money center banks named in the initial suit.


 BAC

 JPM, looks a lot like BAC doesn't it?

And WFC


All 3 are off their highs, we'll see if they drag financials lower, it's still early.

Something to keep an eye on-Dow Theory

Lately the DJ-20 has been performing in sync with the Dow-30, right now that correlation is starting to break up.

DJ-20

DJ-30

Further divergences between the indices would spell trouble. Have you ever noticed when good news becomes bad and vice-versa?

Today's NFP print, although seemingly way out of whack through adjustments, certainly lowers the perception of the probabilities of QE3 as well as the 2014 ZIRP policy.

GALE/QCOR Pair Update

Yesterday I suggested GALE as a hedge/pair trade to QCOR short

And although as I mentioned,  "It's not easy to buy a 12% gain, but that is where the phasing in works, allowing some room for a possible pullback"


Gale has put in a 11+% gain today and a +19% gain from the time it was featured yesterday.


 GALE advancing on volume today, likely already in the mark up phase.

 The bigger picture in GALE on a daily chart.

While QCOR is breaking down from an obvious top. With both stocks in the same sub-industry group, this is a beautiful pair trade.


If you want to consider a GALE long (I'd prefer it as a pair trade with QCOR short), I would wait at this point for the next pullback before entering in any size (keep in mind this is also a speculative trade so the amount of capital committed to GAIL should be less then QCOR).


The next likely pullback in GALE should be between it's 10 and 22 day moving averages. The target on QCOR is around the $20 area.

Credit/Equity

As you know, I recently introduced the Credit-Risk basket indicators vs the SPX, the idea being Credit as a much larger market, leads equities and it has been showing dangerous dislocations, that are actually quite large.

That taken with 3C and even MoneyStream readings point to the rally, particularly since 12-20-2011 as being very high probability bear market rally. I have described the conditions of a bear market rally before, but the main conditions tend to be a very sharp rally after a significant top is broken (the 2011 top), they tend to be on weak breadth, low volume and they sucker in investors and as such, bullish sentiment is very high. However they end in an even more dramatic way, with sharp, water-fall like declines. Many investors being bullish will continue to buy, thinking it's an oversold pullback.

In one neat, organized chart which a member sent, you can see the divergence between credit markets (which should rally with equities in a true rally) and how they have diverged from equities, the same thing we are seeing thus far today in High Yield Corporate Credit...

High yield is significantly less enthusiastic then the SPX.

However this chart lays out the big picture...
Not only does Credit call out the 2007 top (highlighted in a light shade), credit also calls the March 2009 bottom while equities continue to drop. While it's not shaded, credit also calls the 2011 top and the subsequent late July decline. Highlighted, you can also see it is currently diverging in the same area that appears to be a sharp bear market rally.

USO fills the gap

In yesterday's USO Trade Update we were looking for the gap down created yesterday to be filled, this morning, despite a stronger dollar, it did exactly that.

 The larger trend of a lateral market in oil, despite geo-political risks that would normally have pushed oil much higher on uncertainty.

 The gap , which was partly filled yesterday and completely filled today.

If you aren't already in the USO short and looking for an entry, the highest probability entry is a move (even on an intraday basis, but closing is stronger), below yesterday's lows. A tighter entry would be on a move below yesterday's doji close around $37, I would consider waiting until it is below $37 a bit.

You could also enter in this area, however the probabilities are much higher as the move lower resumes and in this case you aren't giving up much in the way of the Percentage move for those higher probabilities.

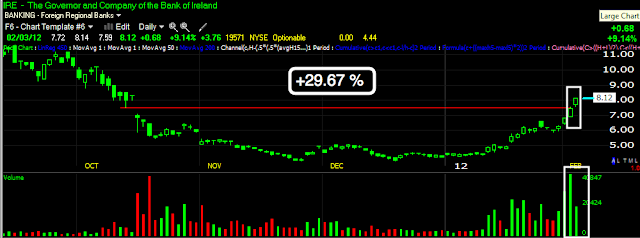
IRE Long Trade Likely Moving to Mark-Up


In Yesterday's Update of our Jan. 31st IRE long trade idea we looked at two potential entries, 1) on a pullback, but as 3C showed confirmation in all timeframes (see yesterday's post) it didn't look likely and 2) on a move to a stage 2 breakout, described as the following:

" If you are not in the trade, the two entries I would favor would be 1) a breakout above resistance at the gap that is being filled today, but the volume should be huge, nearly double what we have already seen, this entry gives you a high probability entry"


Thus far price is in the mark up area and volume is already huge this early, making today a look a lot like the transition from a base to the mark up period. In talking about buying a breakout to stage 2,


"I would wait for a breakout before buying,  you give up some percentage points, but you make up for it in probabilities and this could easily be a 300% trade."


What we want to see is price hold above the red trendline which represents the breakout from the base, we also want to see volume increase markedly.


It can be difficult to buy a breakout like this, but stage 2 is where the stock really moves, although the original entry was the best, which is now nearly at a 30% gain in 3 days.


Right now the short term timeframes are in line with an intraday pullback we are seeing, but timeframes from 5 , 15, 30, 60 and daily are all either confirming the upside move or are leading positive. It may be worthwhile to phase a portion of the entry on the intraday pullback and see how IRE closes, near the top of the range on expanding volume is what we are looking for.


This is an example of a stage 2 breakout, I didn't cherry pick this... This is a stage 2 breakout and 74% gain, however IRE's Beta is double that of STX!


GLD close to breaking

My last update on GLD this week pointed out a pattern that clearly was not a consolidation pattern, as well as GLD being in a broad resistance area defined by the large triangle (top?) apex.

 The triangle's Apex as well as a small channel pointing in the wrong direction for a consolidation, even though volume has fallen off in a way that looks like a consolidation.

 Intraday move thus far at the bottom of the trendline.

And the longer term cycle in GLD from accumulation to distribution.

Volume is rising on the move today in GLD, this early, it is already more then 2/3rds of yesterday's volume. I personally would be patient in considering a position and base any decision on where GLD is near the close.

QCOR Entry and Profit

The QCOR short Trade Idea I just featured just yesterday triggered


"The Trend Channel and the 22-day moving average would be my rough targets and considering where they will be, I'm thinking somewhere in the $36.50 area, "


As you know, I'm a huge proponent of setting price alerts, QCOR hit our $36.50 target this morning and reversed sharply


QCOR Daily


There still may be an entry worthwhile, the downside target was in the $20 area.

NFP Beats Bloomberg's Estimates from 89 Economists

Some tidbits from Bloomberg...


With today’s jobs report, the government issued its annual benchmark update, aligning the data with corporate tax records covering the period from April 2010 to March 2011. The Labor Department added 165,000 to the job count over the period.
The report also included methodology changes to the household survey, incorporating new population data from the decennial census, according to the Labor Department.
It also included changes to the figures used to adjust the data for seasonal swings affecting numbers back to January 2007.
Employment climbed more than forecast in January and the U.S. jobless rate unexpectedly fell to the lowest in three years, casting doubt on the Federal Reserve’s pledge to keep interest rates low until late 2014.


 The data may boost President Barack Obama’s re-election bid and come one week after Fed Chairman Ben S. Bernanke said the economy wasn’t growing fast enough to push unemployment lower.


The median projection in the Bloomberg survey called for payrolls to rise by 140,000 after an initially reported 200,000 gain in December. Estimates of the 89 economists ranged from increases of 95,000 to 225,000. Revisions added a total of 60,000 jobs to payrolls in November and December. The Labor Department revised December’s gain to 203,000.


Today’s report may change the Fed’s thinking, said Michael Feroli, chief U.S. economist at JPMorgan Chase & Co. in New York. “The report definitely scales down the odds for QE3, particularly the drop in the unemployment rate,” Feroli said.


Euro Tumbles as Papademos Resignation is on the table

According to Greece's Kathimerini news

The Greek Prime Minister is set to hold a "make or break' meeting with the  three parties that make up the coalition government, if they cannot agree on a set of reforms to allow Greece to qualify for the next Troika bailout tranche, he is threatening to tender his resignation Monday.

The EUR/USD move on the news...


Non-Farm Payroll Stunner, In More Ways Then One...

After earlier data, including Wall Street layoffs , Chicago PMI, ADP Private Payrolls (which is usually off but to the upside, this one came in shockingly low) and the ISM Manufacturing Index, all showing lower employment in the sub-indicies, the expectation was for a pretty bad NFP number today, in fact consensus was at 135k vs a prior print of 200k, but at 8:30 today, NFP printed at an incredible 243,000. That's a stunner! Here's another...

As I half kiddingly joked yesterday about the "Bureau of BS, or rather BLS", it seems Goldman warned this morning that there would be significant changes to the way employment was calculated as the BLS revised it's model this month. From Goldman:


 'Non-farm payroll growth should slow on seasonal and weather-related factors'
 We forecast that payroll employment growth slowed to +125k in January from +200k in December. The deceleration largely reflects less of a weather-related boost (weather remains milder than usual, but not much more so than in December) and a reversal of positive seasonal adjustment distortions in the December survey (last month the category of “couriers and messengers” was boosted by 42k on temporary hiring for package delivery persons during the holidays; this increase is likely to be reversed in the January report). Even with slightly slower payroll growth, we still think the unemployment rate should fall to 8.4% from 8.5%, although this is a close call.


Today’s report will also include annual benchmark revisions to both the payroll and household surveys. In the payroll survey, the BLS we realign the level of employment with unemployment insurance records. In September 2011, the BLS estimated that this would add 192k to the level of employment. Today’s final announcement should be close to that figure. Historical data will also be revised for new seasonal adjustment factors and updates to the “birth/death” model. Separately, the household survey will be adjusted for new “population controls” incorporating data from the 2010 Census (essentially these are the scaling factors used to translate the monthly survey into a national estimate). These revisions mean that the raw change in household employment will have virtually no meaning. The BLS will report adjusted household employment estimates which remove the effect of revised population controls, and investors should focus on these figures.
Payrolls: GS: +125k; Consensus: +140k; Last +200k. 
Unemployment: GS 8.4%; Consensus: 8.5%; Last 8.5%. 
Earnings: GS +0.2%; Consensus: +0.2%; Last: +0.2%


From Bloomberg:


With the release of January 2012 data on February 3, 2012, the establishment survey will introduce revisions to nonfarm payroll employment, hours, and earnings data to reflect the annual benchmark adjustment for March 2011 and updated seasonal adjustment factors. Not seasonally adjusted data beginning with April 2010 and seasonally adjusted data beginning with January 2007 are subject to revision.

And the net effect of revisions?

1.2 million people dropped out of the labor force in 1 month! This sent the civilian labor force to a 30-year low of 63.7!  An election year stunt?

Look at the charts...

Persons not included in the labor report calculations...
That's a sharp 1 month jump.

Labor Force Participation Rate...

This chart goes back to January 1984, a 30 year low.


From Bloomberg:

About 113k of NFP gain from “low wage jobs,” David Ader, strategist at CRT Capital Group, writes in note. Additionally, “we didn’t see the drop in courier and messengers as expected - but suspect we will." Moreover, ‘‘long-term stress remains at the U6 measure at 15.1% is still high, but likely falling due to people leaving labor  force, and duration on unemployment remains over 40 weeks."