Although I'm way behind on emails as I have to first do what is best for all members, I have noticed a lot of emails about treasuries and TLT specifically which is a flight to safety trade when the market is in risk off mode typically.
I say it almost every day and long term members have seen it, I'd conservatively estimate that before a major reversal in any timeframe, there's a head fake move first, a false break out or false break down and there are numerous reasons for this, not the least of which is it gives the reversal a kick start/snowball effect when the bear/bull traps are sprung on the head fake moves. It is almost always a VERY obvious area, support, resistance, a major price pattern, but it has to be obvious to do its job.
I DON'T SAY THIS TO TAKE UP SPACE IN A POST, I SAY THIS BECAUSE WE OBSERVE IT ALMOST EVERYDAY ON SOME TIMEFRAME.
Lets take a look at TLT and it's inverse leveraged ETF TBT which should give us the opposite signals if there's confirmation.
First TLT...
TLT Daily chart, the obvious feature here is gap support that has been tested, if the shorts are going to enter TLT they want to see price confirmation and that is a break below that support, but did they bite?
There's decent volume on the break below support, someone has to take the other side of the trade, this is the fastest, most inconspicuous way for smart money to accumulate without leaving obvious footprints.
So was there accumulation ?
The TLT 1 min trend is nearly the opposite of the SPY 1 min trend as it should be for confirmation purposes, it also shows underlying activity that you would never notice in price alone. Also note the leading negative divergence to the left sending TLT lower, remember, smart money buys in to weakness and sells in to strength or supply and demand respectively.
Is the 1 min trend a fluke? Here's the 3 min trend, leading positive.
The 3 min chart on the move lower under support today shows a leading positive divergence.
As does the 5 min chart
even the 15 min chart which is slower to move.
Take a look at the big picture 30 min chart and the large leading positive divergence in TLT, it would seem someone has been putting together a decent position long TLT, a flight to safety trade.
Now for TBT, this is the opposite-UltraShort treasuries so for confirmation we want to see the opposite 3C signals...
1 min intraday leading negative in to price strength.
1 min trend, this confirms TLT as well as the SPY.
3 min leading negative intraday divergence
3 min trend leading negative
5 min leading negative today as TLT was leading positive.
Even the 15 min moved down intraday.
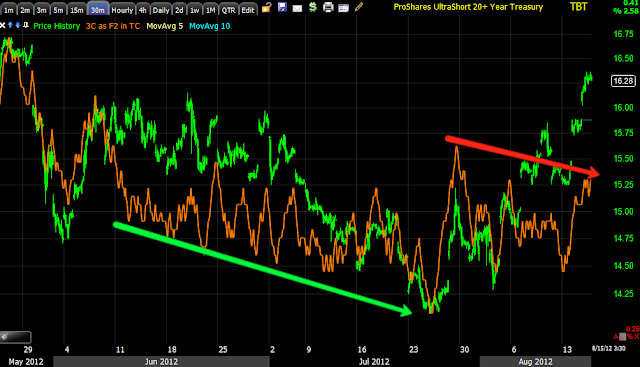
The larger view, confirmation of the downtrend at the green arrow and a leading negative divergence at the red arrow in to price strength, suggests distribution in to price strength.
It seems we have pretty good TLT/TBT/SPY/Market confirmation.


