Thursday, December 22, 2011

Volatility...

VXX was picking up on it, check out this volatility and this is not closing volume, this is about 3:56

 You don't see the price volatility in BAC because I'm almost 100% positive it is sitting right at the VWAP (which is where market makers/specialists fill orders), but look at the red volume to the right, almost panicky.

 The IWM which has been mellow all day sitting at about a +.20% gain just saw volatility pick up on heavier volume.

 Look at the chop in the SPY and some of those 1 min price candles, plus the volume and as I said, this isn't end of the day settlement volume spikes, this was at 3:56.

And the TICK went from +1250 to -800  with +1000 to -800 readings in 3 minutes.

The market looked a little panicky or rushed toward the close.

TZA Looks set for a pop

TZA is a leveraged short (inverse) ETF on small caps
 TZA 1 min in a flat range.

 TZA 2 min leading in a flat range

 TZA 5 min looks very strong

 Even the 30 min looks good.

Compare to the IWM -Russell 2k which is lagging badly today.

 IWM 2 min leading negative

 IWM 5 min leading negative

 Same with the 15 min,

I'd say IWM will break soon and TZA will benefit.

Another Triangle in the Euro

This is the 3rd in 2 days, the last 2 have been false breakouts, I think this one will do the same,
 Horrible trendlines, I know

 FXE shows it better and why do I think it will do the same?

Because it looks like it's getting ready to break out to the upside which is the first component in a false break out.

Financials Update

Remember I said with the price gain in Financials and the 3C charts, I'd be looking there today for shorts and specifically BAC?

Take a look at XLF at 3 p.m.

 XLF 1 min 3C

 2 min leading negative, suggesting price strength was being used today to sell/short in to.

 Leading negative 5 min, thus the reason I mentioned financials being a target today for entries.

 And XLF breaks some intraday support on the biggest volume of the day.

As far as the last post about the disconnect between VXX and the market, the market has been lingering near the highs or at them while the NYSE TICK index not only is trending down (artificial support or manipulation of the market), but the TIK is hitting negative -1000 meaning there are a lot more issues declining or ticking down then advancing. This is a set up for a nasty fall. The only thing  see that may be lending a little support to the market is the Euro rangebound, but the Euro certainly isn't supporting the market in moving up.

Good ole' Window Dressing manipulation, it's always the best at the end of the year.

VXX Extreme

VXX is a volatility index, like the VIX, but intraday and I think a better gauge, so as such, it moves inversely to the market.

This 1 min chart is going nuts, which suggest VXX is about to make a move up, which means the market makes a move down. Strangely VXX gapped lower as it should have with the market gapping higher, but it has climbed back up to the unchanged point while the market hasn't given up ground, 1 or the other has to break as the correlation (inverse) is very strong and with the 3C chart looking like this, I'm going to say VXX wins.

GLD/DZZ Update

We've been bearish on GLD at least as an intermediate top and possibly a bubble top, it was expected to bounce with the market and in doing so, perhaps set up a short ether shorting GLD or using something leveraged like DZZ.

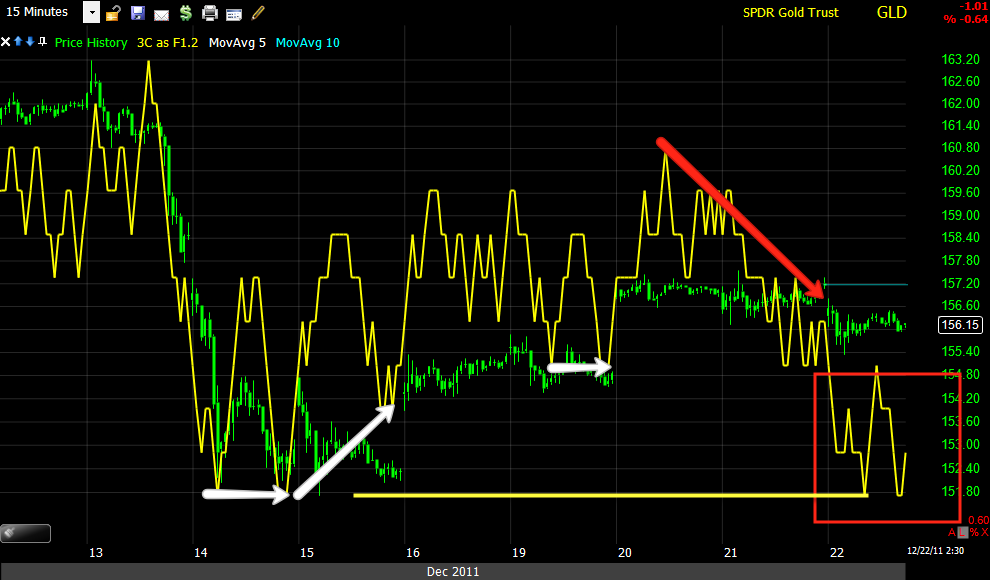
 Here's the top (Triangle) in GLD, the 150 day moving average which has supported GLD since 2009
has also been broken, we were very skeptical about buying GLD at the long term moving average when it hit it, even though we had been waiting for the chance, it was all of the volatility that is new to the trend that caused the well-founded skepticism and now it appears GLD has broken some sort of top, I'm guessing it's an intermediate top that may form a larger bubble top. In the red square, price sure looks a lot like a bear flag, volume is correct for a bear flag as well, which is a bearish consolidation/continuation pattern. However, as watched as GLD is, some sort of head fake would seem likely unless GLD is just that weak and there's a case to be made as most Hedge funds are being hit hard with redemptions and GLD is in many cases, their only profitable position in their top holdings so selling GLD to meet the redemptions makes sense. It will be interesting to see what happens after the new year.


 On the bounce, this is a 50 bar m.a. on a 15 min chart, volume has been horrible on the bounce.

 There's also a triangle today and I am guessing it wants to breakout to the upside before giving ground (head fake).

 The intraday Bollinger Bands are suggesting a directional move and soon.

 The 1 min 3C chart supports a head fake breakout, but...

 When we move to the 5 min above and 15 min below, you can see the obvious bearish distribution, so a head fake might just make for a good entry to short GLD.

 15 min negative leading divergence almost making a new low

 Here's the short on GLD, an inverse leveraged ETF, DZZ, note the triangle bottom and breakout, with a nice pullback.

While I don't like using my x-over screen for choppy markets, it did a good job going long/short and long with no false signals, well there was a false signal in the price moving average, but the screen uses 3 confirmations and the false signal would not have been taken as a trade. More importantly, after a breakout on a new long signal, the first pullback is almost ALWAYS to the yellow 10-day moving average, which s where DZZ is at right now. So keep your eye on this one if you like the trade. I would treat GLD as a swing trade for now until it proves different, I would also use a trailing stop like my Trend Channel to allow for more then a swing trade without making arbitrary decisions about what kind of trade it is.

AAPL VERY tempting right here.

 The head fake breakout I mentioned as being the VERY desirable spot, and check volume as well.

 The trendline to the left is the confirmed head fake, but if XLK and the Q's are all heading down, I might consider the $397 area, that's jumping the gun a little, but...

 The Hourly Trend Channel has held the trend , it's around $396, the head fake trendline is about $396.50. I think $.50 is worth the stronger confirmation. Again, these positions can be phased in to.

I'm not posting all the AAPL 3C charts, but the 15 min is important and it is looking ripe.

USO Update

 This is USO/Crude in green vs the Euro in white, look how nicely they track (it's really the inverse relationship with the dollar, but the Euro is a perfect proxy). Last week we had what started off as a day trade short in USO that worked for a few days, I said time to cover last Thursday / Friday which was pretty good timing as we were expecting a Euro bounce (the dates in red are the cover post dates). However the Euro is not giving the kind of support USO needs to continue moving much higher here.

 USO is also running in to some resistance.

 Look at 3C on that USO attempt to break higher, it turned out to be a peak.

 The other charts are coming together as well...

 Here's the 5 min

 And the 15 min.

 For longer term traders, the 60 min which is very negative for this long of a time frame.

 Volume has been light on this move, that has a lot to do with the season as well, still volume is volume and this isn't bullish. That gap in white should act as a magnet.

 Here's the 15 min Trend Channel which has held the entire move, it's stop out is now around $38.25 or so.

 The 50 bar 5 min has also tracked the move well and this is a set up a lot of traders use, a break below is a short signal for them.

Personally, I would feel more comfortable with a break of the 50-bar 10 min as we rarely see "V" shaped reversals, there's usually some side ways chap or a "U" shape and a break of the 10 min would be a bit more out of that choppy zone.

Euro isn't lending much support and the market looks frothy

 The Euro is in red, the SPY in green. Note the volume on the thin advance

As far as the bigger picture of our Euro bounce, there's actually a divergence. I'm surprised the arbitrage algos haven''t aught on to this yet.... yet

Market Update-Liking BAC Here (short)

 DIA-still looking the worst...

 QQQ looking pretty bad too

 SPY

 The NYSE TICK chart just broke the channel

 XLF

And BAC, note the flat area in price when the leading negative divergence started.

I may add  small amount of BAC short here.